

Introduction
Thyroid cancer (THCA) is the most common endocrine neoplasm, accounting for approximately 1.7% of all cancer diagnoses [1]. This cancer is classified into several histological types, including papillary thyroid carcinoma (PTC), follicular thyroid carcinoma (FTC), medullary thyroid carcinoma (MTC), and anaplastic thyroid carcinoma (ATC) [2]. Treatments including radioactive iodine and thyroidectomy are classic methods for clinical therapy of THCA and thyroid disease [3, 4]. However, in many cases, the benefits of these classic methods are inconclusive due to the poor prognosis and complications [5]. Thus, it is urgently necessary to reveal novel diagnostic strategies for the clinical treatment of THCA.
Differentially expressed genes (DEGs) are a group of genes that exhibit significant changes in expression levels between different conditions, such as normal and diseased tissues. Identifying DEGs in thyroid cancer can provide valuable insights into the molecular mechanisms of its development, progression, and response to therapy [6]. It has been proved that genes such as LGALS3 and CD44 were differentially expressed between normal and THCA samples, which can be used as novel biomarkers for the diagnosis and gene therapy of THCA [7, 8]. Bergström et al. reported that the aberrant activation of epidermal growth factors may lead to overexpression and activation of DEGs such as MET, which further contributed to the development of THCA [9]. A previous study showed that immune cells, including macrophages, promote tumor progression through several mechanisms such as cell growth and interact with various genes including COL1A1 [10, 11]. Therefore, a further study of the molecular mechanism during THCA progression is vital for the investigation of novel prognostic markers and treatment strategies.
The Cancer Genome Atlas (TCGA) is a comprehensive resource that provides genomic, transcriptomic, and clinical data for various types of human cancer, including thyroid cancer [12]. By analyzing TCGA data, researchers can identify crucial DEGs and pathways associated with thyroid cancer and explore their functional implications in the context of cancer development, progression, and response to therapy [13].
Based on the UCSC Xena platform (http://xena.ucsc.edu/), this study elucidates crucial DEGs and pathways associated with THCA by analyzing the TCGA dataset. Enrichment analysis and protein-protein interaction (PPI) network analysis were performed, followed by the prognostic hub gene exploration from the PPI network. Then, prognostic and mutation analysis was performed on these hub genes. Finally, the associations of the hub gene with immune cells were investigated. We hope to reveal the potential molecular mechanism associated with THCA progression and investigate promising biomarkers for THCA.
Material and methods
Microarray data and pre-processing
TCGA Thyroid cancer FPKM data and associated clinical information were obtained from the UCSC Genome Browser database [14] using R software (version: 3.6.5). The platform was Illumina HiSeq 2000 RNA Sequencing. The reannotation of RNA-seq data in TCGA was performed based on the annotation information provided by the HUGO Gene Nomenclature Committee (HGNC) database [15]. Finally, a total of 496 THCA samples with clinical prognostic information (THCA group) and 56 solid tissue normal samples (N group) were revealed from the TCGA database.
Differential expression analysis
The limma package of R [16] was used to explore the DEGs between the THCA group and N group based on the TCGA Thyroid cancer dataset. The Benjamini & Hochberg (BH) adjusted p < 0.05 and |log2 fold change (FC)| > 1 were selected as the thresholds for DEG screening. The volcano plots visualized the results using ggplot2 (version: 1.0.12) [17]. Then, clustering heatmap analysis of TCGA THCA with DEGs was performed to detect the diagnostic effect of DEGs using ggplot2 (version: 1.0.12) [17]. Finally, principal component analysis (PCA) was further used to investigate the classification effect of DEGs.
Enrichment analysis for co-DEGs
Gene ontology (GO) and Kyoto Encyclopedia of Genes and Genomes (KEGG) pathway analyses were performed based on the screened DEGs using Metascape software [18]. The GO functions include biological process (BP), cellular components (CC), and molecular function (MF). The p value < 0.05, minimum count = 3, and enrichment factor > 1.5 were considered as the threshold for the current enrichment analysis.
Gene set enrichment analysis
Gene set enrichment analysis (GSEA) was performed based on the TCGA dataset using the clusterProfiler package of R [19]. The “C2. Cp. kegg. V7.4. Symbols. GMT” and “C5. Go. BP. V7.4. Symbols. GMT” were selected as reference gene sets for the current analysis. P < 0.05 was considered as the threshold for GSEA.
PPI network construction
The hub proteins associated with DEGs were selected according to the STRING database (species: Homo sapiens). Then, the PPI network was constructed by Cytoscape software (version: 10.0; version: 3.8.2) [20]. Furthermore, molecular complex detection (MCODE, version: 1.5.1) [21], a plug-in of Cytoscape software, was used to screen the significantly enriched modules from the PPI network with a score > 10, followed by GO and KEGG enrichment analysis using Metascape software [18]. Finally, the hub genes were explored using cytohubba software [22].
Diagnostic and mutation analysis based on prognostic genes
The mutation analysis, diagnostic analysis, and receiver operating characteristic curve (ROC) analysis of each hub gene in the TCGA data set were carried out. cBioPortal for Cancer Genomics is an open-source resource for interactive exploration of multiple cancer genomics datasets [23]. The mutation analysis was performed on hub genes and THCA using cBioPortal software. Then, Kaplan-Meier (KM) assessment was used for the survival analysis of hub genes according to the high and low expression based on R survival [24] and surviviner [25] software, and hub genes with good prognosis (log rank p < 0.1) were visualized. Finally, ROC analysis was performed on each hub gene using the pROC package in R [26] to evaluate the diagnostic effect of this hub gene. The ROC curve between gene and patient was visualized using the ROC package. The area under the curve (AUC) was used to evaluate the diagnostic effect of gene expression on normal and disease tissue.
Immune infiltration and correlation analysis
Immune infiltration analysis was performed on hub genes. Briefly, a total of 22 types of reference cells were used to calculate the infiltration scores according to the CIBERSORT algorithm [27]. Then, the correlation and difference of immune cell infiltrations were visualized using the corrplot package and ggplot2, respectively [25]. The correlations of hub gene vs. immune cell infiltration and immune cells vs. immune cells were analyzed with Pearson’s correlation coefficient using corr.test in the psych package of R and corrplot in the corrplot package of R [28]. The results were visualized using the heatmap package in R software.
Enrichment results evaluation based on gene set variation analysis
Based on the msigdb.v7.4.symbols.gmt enrichment background in the MSigDB v7.4 database, the enrichment scores (ES) of each function and pathway in each sample of the TCGA Thyroid cancer dataset were calculated to obtain a scoring matrix using the GMT file in MiSigDB and gene set variation analysis (GSVA) algorithm in R package [29]. Then, differential expression analysis between the THCA group and N group was performed on each GO-BP, GO-CC, GO-MF, and pathway item using the limma package in R software. Finally, the BH adjusted p < 0.05 and |log2FC| > 0.3 were considered cut-off values for the current analysis. The top 20 terms of each enrichment result were listed according to the FDR values.
Results
DEG identification between the THCA group and N group
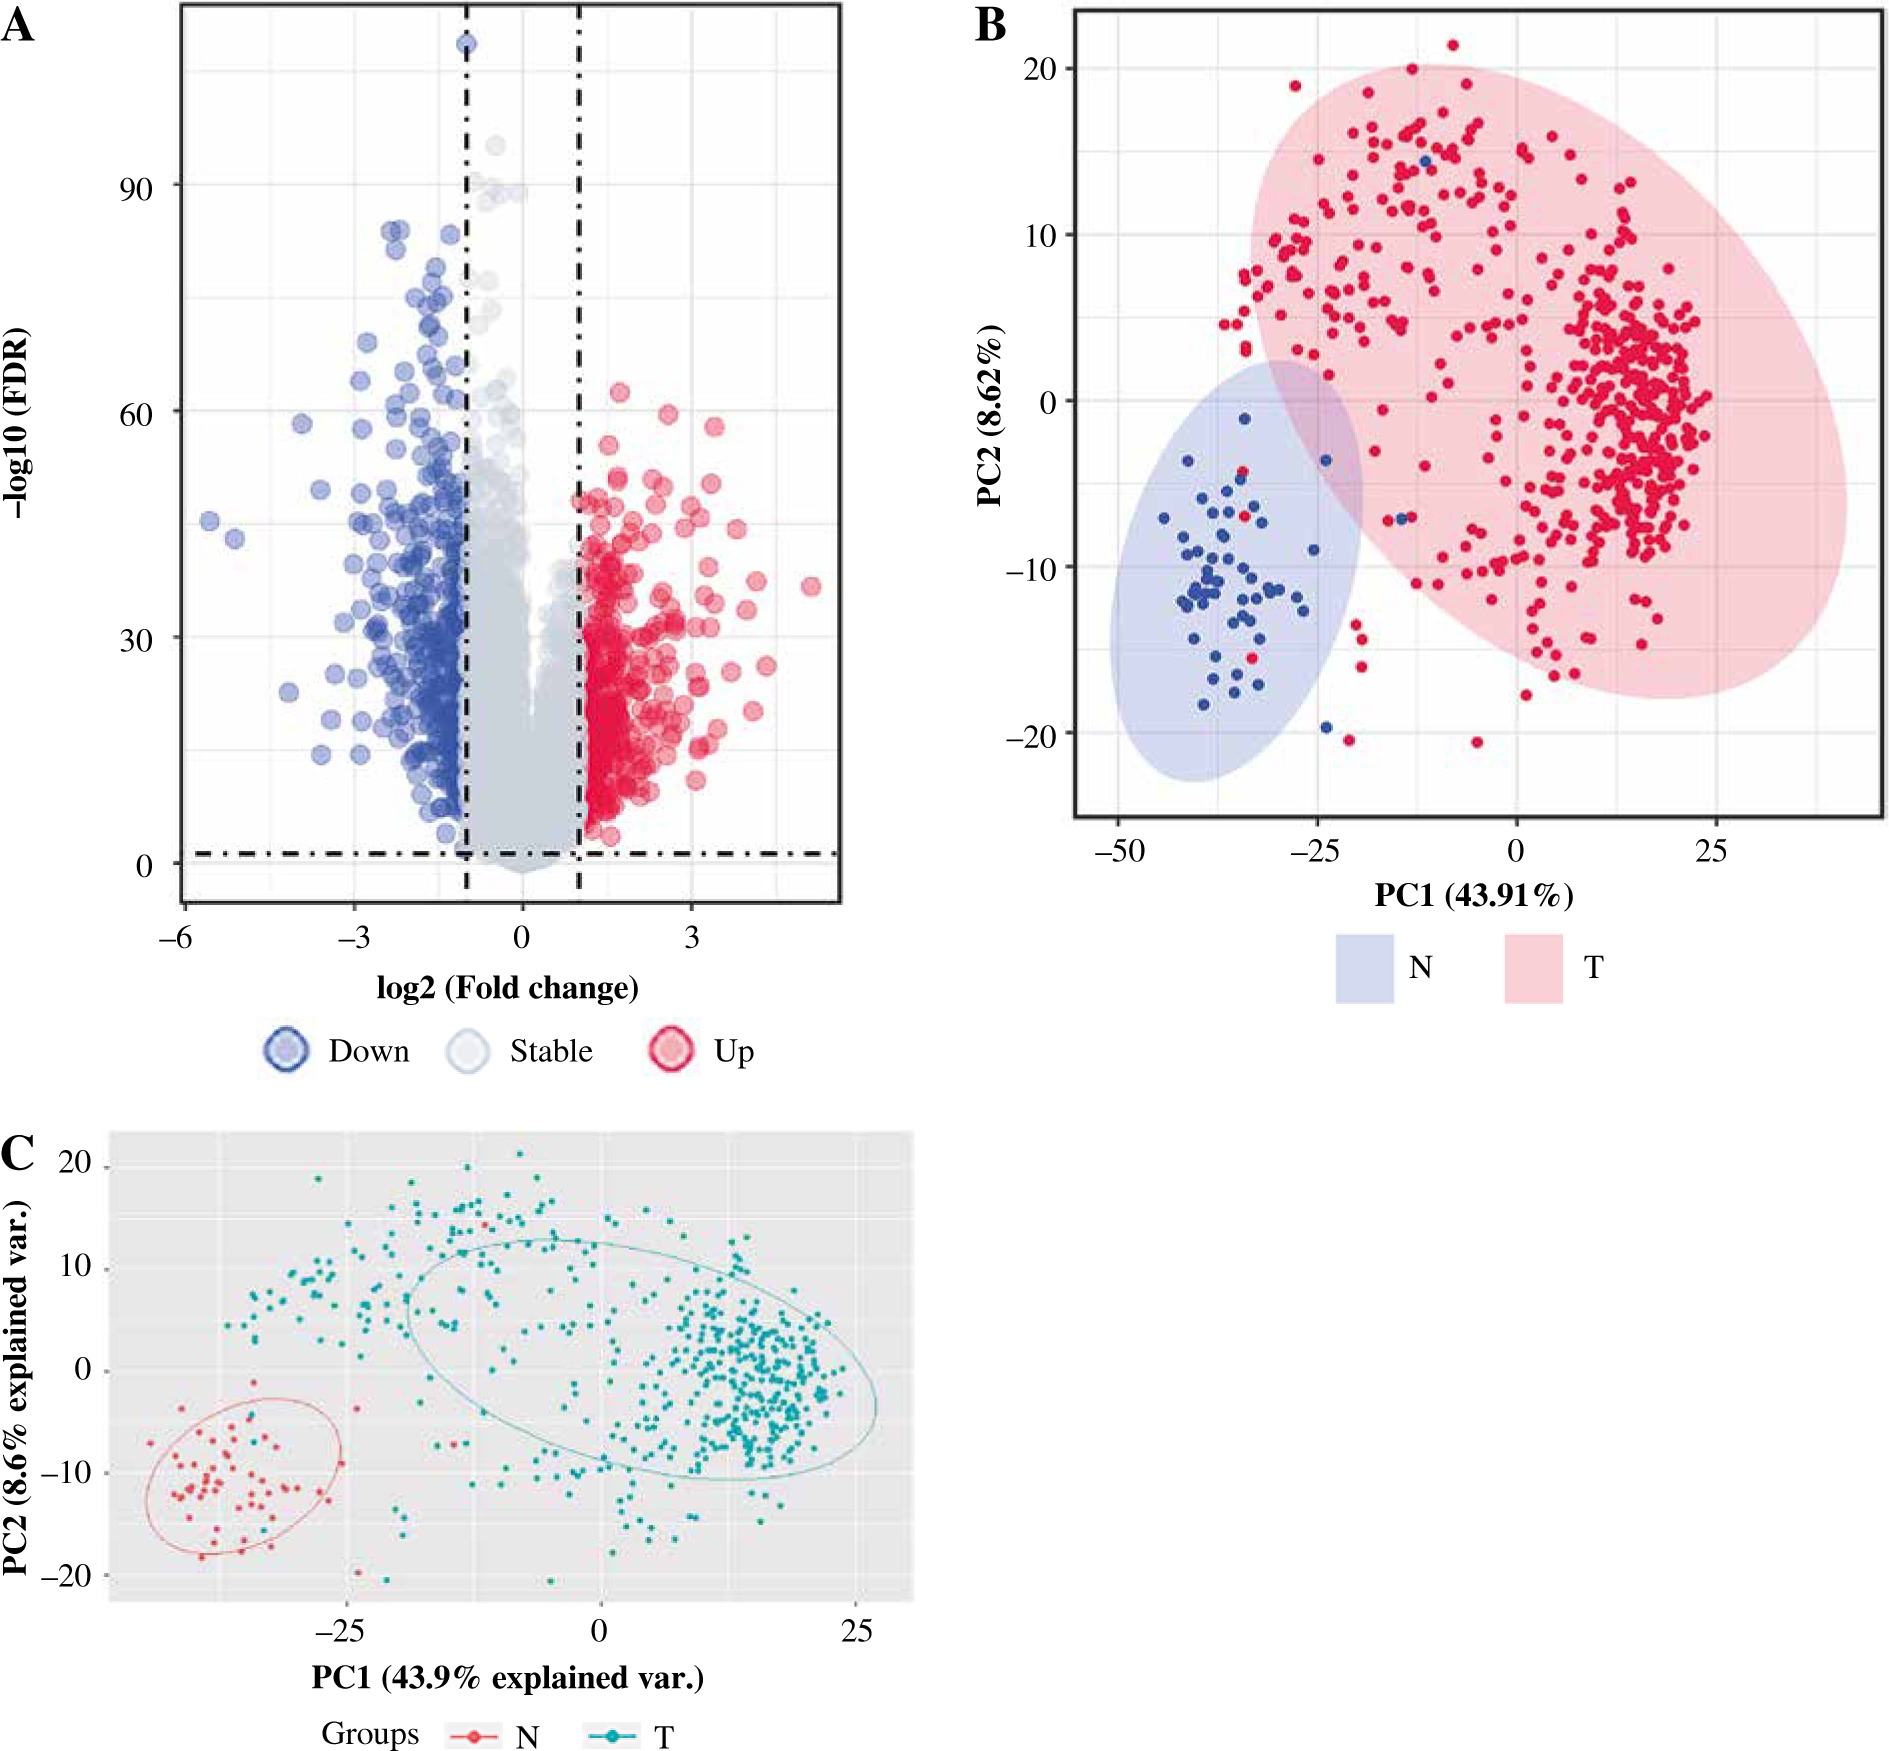
After pre-processing, a total of 19 070 mRNAs and 552 samples were explored from TCGA Thyroid cancer FPKM datasets. Then, with |log2FC| > 1 and p < 0.05, a total of 802 DEGs including 425 up-regulated and 377 down-regulated genes were revealed between groups. The volcano plot for these DEGs is shown in Figure 1A. The clustering analysis for DEGs between groups showed that most of the samples in the THCA group (red) were clustered into one class, and most samples in the N group (blue) were clustered into the other class (Fig. 1B). Furthermore, the PCA analysis showed that the disease samples and normal samples were separated into different clusters (Fig. 1C).
Fig. 1
The differentially expressed genes (DEGs) between thyroid cancer (THCA, shown as “T” in the figure) group and normal (N) group. A) The volcano plot for DEGs between THCA group and N group: the red dot represents the up-regulated gene, while the blue dot represents the down-regulated gene. B) The clustering heatmap for DEGs between THCA group and N group: the red block represents the up-regulated gene, while the blue block represents the down-regulated gene; the different colors on the top bar represent different groups. C) The principal component analysis (PCA) for all samples in the Thyroid dataset: the red dot represents the up-regulated gene, while the blue dot represent the down-regulated gene
GO and KEGG enrichment analysis
The 802 DEGs revealed in this study were mainly assembled in GO functions such as blood vessel development (BP, GO:0001568) (Fig. 2A), external encapsulating structure (CC, GO:0030312) (Fig. 2B), and extracellular matrix structural constituent (MF, GO:0005201) (Fig. 2C). Meanwhile, these DEGs were mainly enriched in KEGG pathways such as pathways in cancer (hsa05200), complement and coagulation cascades (hsa04610), and transcriptional misregulation in cancer (hsa04514) (Fig. 2D). The detailed information for all included GO functions and KEGG pathways is listed in Table 1.
Table 1
Significant GO functions and KEGG pathways enriched by 802 DEGs between THCA group and N group

GSEA investigation
The GSEA on the TCGA dataset showed that GO-BP functions such as muscle tissue development, cell fate commitment, and organic acid catabolic process were outstanding between the THCA group and N group (Fig. 3A). Moreover, KEGG pathways such as propanoate metabolism, lysine degradation, and valine leucine and isoleucine degradation were outstanding between the THCA group and N group (Fig. 3B). The result of the GSEA plot analysis for significant GO functions and KEGG pathways is shown in Figure 3C and 3D, respectively. Detailed information for significant GO functions and KEGG pathways in GSEA is listed in Table 2.
Fig. 3
Gene set enrichment analysis (GSEA). A) The ridge plot for top 20 GO-BP terms assembled by DEGs between the THCA group and N group. B) The ridge plot for the top 20 KEGG pathways enriched by DEGs between the THCA group and N group. C) The GSEA plot for the top 20 GO-BP terms assembled by DEGs between the THCA group and N group. D) The GSEA plot for the top 20 KEGG pathways enriched by DEGs between the THCA group and N group

Table 2
Significant GO functions and KEGG pathways of 802 DEGs between THCA group and N group revealed by GSEA
A PPI network was constructed based on 802 DEGs. Then, according to MCODE, the module with a score > 10 in the PPI network was selected (Fig. 4A). Finally, the top 20 hub genes including FN1, CD44, TGFB1, MMP7, CTGF, TIMP1, CCND1, JUN, CXCL12, SNAI1, etc., were revealed to play important roles in THCA (Fig. 4B). Then, these genes were mainly assembled in GO functions such as collagen-containing extracellular matrix (genes: FN1, TGFB1, etc.) and KEGG pathways including PI3K-Akt signaling pathway (genes: FN1, CCND1, etc.) (Fig. 4C, D).
Fig. 4
Protein-protein interaction (PPI) network and module analysis. A) A module with a score > 10 was extracted from the PPI network; the nodes represent genes: the larger the node, the higher the score; the line between two nodes represents an interaction. B) The top 20 hub genes explored from the module; the redder color means higher connectivity. C, D) The functional enrichment network of modular genes: the different colors represent different items of functions or pathways

Integrated analysis for hub genes
The hierarchical clustering analysis on hub genes showed that the sample in the THCA group was clustered into one class, while samples in the N group were clustered into the other class (Fig. 5A). Then, with log rank p < 0.01, a total of 5 potential prognostic genes – CCND1, CD44, LGALS3, MET, and SNAI1 – were revealed. In detail, the high-expression group of CCND1, CD44, LGALS3, and MET had a better prognosis than the low-expression group (Fig. 5B-E), while the low-expression group of SNAI1 had a better prognosis than the high-expression group (Fig. 5F). Moreover, the ROC analysis showed that the AUC values for all 20 hub genes were larger than 0.7. Importantly, the AUC in CCND1, MET, DCN, and KIT was larger than 0.9, indicating a good predictive ability of these potential prognostic genes (Fig. 6A-D). Furthermore, the mutation analysis showed that most of the mutations were deep deletions, in which PLAU and CXCL12 were the two genes with the highest mutation frequency (Fig. 7A). Meanwhile, the box plot of mRNA and CNA showed that the mRNA values corresponding to Diploid and Gain were the largest (Fig. 7B), but the mRNA and methylation scatter plots showed opposite trends (Fig. 7C). Finally, the KEGG pathway map corresponding to gene mutation showed that MET and KIT participated in the RTK-RAS pathway, and CCND1 participated in the cell cycle pathway (Fig. 7D).
Fig. 5
Survival analysis for 20 hub genes. A) The hierarchical clustering map for all 20 hub genes: the red block represents up-regulated genes, while the blue block represents down-regulated genes. B-F) The KM plot for the potential prognostic genes including CCND1, CD44, LGALS3, MET, and SNAI1: the red line represents high risk, while the blue line represents low risk. N – normal, T – thyroid cancer


Immune cell infiltration and its correlation with hub genes
The expression of 20 hub genes in 22 immune cell types showed that immune cells were clustered into two categories: dendritic cells activated, macrophages M1, dendritic cells resting, mast cells resting, plasma cells, and T cells regulatory. Tregs, monocytes, and M0 macrophages were significantly positively correlated with PLAU, TIMP1, ICAM1, TGFB1, LGALS3, FN1, MET, COL1A1, MMP7, POSTN, CCND1, and CD44, while the other immune cells showed the opposite trend (Fig. 8A). Furthermore, the results of heatmap analysis showed that dendritic cells resting had a significant negative correlation with CD4 memory resting T cells; monocytes were negatively correlated with dendritic cells, resting, plasma cells, M1 macrophages and gamma delta T cells; mast cells resting showed a negative correlation with NK cells activated and mast cells activated. There was a significant positive correlation between mast cells resting and M0 macrophages. Meanwhile, there was a significant positive correlation between B cells naive and mast cells activated (Fig. 8B). Furthermore, the box plot of immune cell infiltration showed that compared with normal samples, the cell infiltration in monocytes, M0 macrophages, dendritic cells resting, M1 macrophages, dendritic cells activated, dendritic cells resting and mast cells resting was more significant in disease, while memory B cells, follicular helper T cells, γδ T cells, NK cells activated, eosinophils and mast cells activated cell infiltration was relatively low (Fig. 8C).
Fig. 8
Immune cell infiltration investigation. A) Correlation analysis between 22 kinds of immune cell infiltration and hub gene: red represents positive correlation, while blue represents negative correlation. B) Correlation heatmap of 22 kinds of immune cell infiltration: blue represents positive correlation, while red represents negative correlation; the darker the color, the stronger the correlation. C) The box plot of 22 kinds of immune cell infiltration ratio: red represents the disease group, while blue represents the normal group. *p < 0.05, **p < 0.01, ***p < 0.001, ****p < 0.0001; N – normal, T – thyroid cancer

GSVA investigation
GSVA was performed based on all GO functions and KEGG pathways to explore the functions of prognostic genes in high- and low-risk groups with p < 0.05 and |log2FC| > 0.5. The results showed that a total of 20 GO-BPs including the semaphorin plexin signaling pathway involved in axon guidance and the semaphorin plexin signaling pathway involved in neuron projection guidance were significantly different between the two groups (Fig. 9A). Moreover, a total of 20 GO-MFs such as alcohol dehydrogenase and p plus activity, and semaphorin receptor activity were significantly different between the two groups (Fig. 9B). In addition, a total of 20 GO-CC including semaphorin receptor complex and postsynaptic specialization intracellular component were significantly different between the two groups (Fig. 9C). Furthermore, a total of 19 KEGG pathways such as the Notch signaling pathway and p53 signaling pathway were significantly different between the two groups (Fig. 9D).

Discussion
Thyroid cancer is the most common malignant tumor that frequently has genetic alterations leading to the activation of certain signaling pathways [30]. In this study, we successfully identified 802 DEGs and explored their biological functions through enrichment analyses. Additionally, we identified 20 hub genes, including FN1, CD44, TGFB1, MMP7, CTGF, TIMP1, CCND1, JUN, CXCL12, SNAI1, and others that may play essential roles in thyroid cancer development and progression. Notably, CCND1, MET, DCN, and KIT showed good prognostic predictive ability. We also analyzed the correlation between hub genes and immune cell infiltration.
Previous studies have demonstrated the importance of lysine in human cancer, with evidence suggesting that it increases survival and reduces metastasis [31]. Chen et al. reported that lysine degradation (carnitine) occurred in patients with liver cancer, potentially contributing to cancer progression [32]. Overexpression of lysine 27 is associated with aggressiveness and dedifferentiation of THCA [33], and lysine metabolism has been found to play a crucial role in THCA development by influencing methylation and gene expression [34]. In addition to the role of lysine, cell cycle pathway genes have been implicated in thyroid carcinoma progression [35]. Cyclin-dependent kinases, activated by cyclins such as CCND1 (cyclin D1), facilitate cell cycle progression [36]. Wang et al. showed that the up-regulation of CCND1 in the cell cycle pathway might play a vital role in tumor progression and may have prognostic significance in THCA [37]. The variant of the CCDN1 gene may be a susceptibility low penetrance allele in the development of papillary THCA [38]. A previous study indicated that mutations of CCND1, which probably render the protein insensitive to degradation, represent a previously unreported mechanism of cyclin D1 overexpression in human tumors in vivo [39]. In the current study, the GSEA investigation showed that lysine degradation was one of the most significant pathways enriched by DEGs between the THCA group and normal groups. Simultaneously, the mutation analysis showed that hub genes, such as CCND1, alternated in THCA via participating in the cell cycle pathway. Based on these findings, we speculated that lysine degradation might be associated with THCA development, and mutation of CCND1 could contribute to THCA progression by participating in the cell cycle pathway.
Effective diagnosis and prognosis are very important for the clinical intervention of THCA [40]. Biomarkers, indicators that can be measured objectively, can be helpful in the diagnosis and prognosis of human cancers including THCA [41]. CD44 (CD44 molecule) is a broadly distributed cell surface protein. A previous study showed that THCA exhibits specific patterns of aberrant alternative CD44 splicing, distinguishing them from histologically normal thyroid tissue [42]. Reduced CD44 standard expression is associated with tumor recurrence and unfavorable outcomes in THCA [43]. SNAI1 (Snail Family Transcriptional Repressor 1) binds to specific target genes and functions as transcriptional repressors in cancer [44]. A previous study indicated that the expression of SNAI1 is associated with lymph node metastasis in THCA [45]. A recent study showed that SNAI1 can be used as a prognostic biomarker for determining prognosis and immune infiltration in gastrointestinal cancers [46]. Furthermore, KIT (KIT Proto-Oncogene, Receptor Tyrosine Kinase) is a gene playing a key role in intracellular signaling during cancer [47]. Wang et al. proved that KIT was one of the genes in the most significant cluster constructed by DEGs between normal thyroid tissue samples and THCA samples, which could be used as a potential diagnostic gene for THCA [48]. Survival analysis showed that the overexpression of CD44 and suppression of SNAI1 contributed to the favorable and unfavorable outcomes of patients with THCA, respectively. Furthermore, the diagnostic analysis showed that the AUC of KIT in THCA was larger than 0.9. Thus, we speculated that CD44 and SNAI1 might be used as novel prognostic genes of THCA, while KIT could be used as a potential diagnostic gene for THCA.
Several studies have shown that immune infiltration plays an essential role in tumorigenesis, progression, and response to treatment in THCA. Infiltrating immune cells in the tumor microenvironment of thyroid cancer can include various cell types such as T cells, B cells, macrophages, and natural killer (NK) cells [49]. These immune cells can exhibit both pro-tumor and anti-tumor effects, depending on the specific cell types, their activation states, and the interactions between the cells. For instance, tumor-infiltrating lymphocytes (TILs), particularly CD8+ cytotoxic T cells, have been associated with a better prognosis in THCA patients [50]. On the other hand, Tregs within the tumor microenvironment can suppress the anti-tumor immune response, promoting tumor growth and progression [51]. In addition, tumor-associated macrophages are another critical component of the immune microenvironment in thyroid cancer. The balance between M1/M2 macrophage phenotypes can impact the overall outcome in cancer [52]. It has been proved that the soluble glycoprotein NMB produced by macrophage cells induces cancer stemness and metastasis via CD44 [53], which indicates a close relation between CD44 and macrophage cells in cancer. Our findings revealed that the identified hub genes were significantly positively related to Tregs, monocytes, and macrophages, which may provide new insights into immunotherapy for THCA.
In conclusion, lysine degradation might be associated with the development of THCA. CCND1 mutation might play a role in THCA progression by participating in the cell cycle pathway. Furthermore, CD44 and SNAI1 could serve as novel prognostic markers for THCA, while KIT might be a potential diagnostic gene for THCA. However, this study has a limitation due to the lack of verification analysis for the proposed prognostic and diagnostic genes. Therefore, additional research should validate these genes prospectively. The results of this study may contribute to the identification of novel potential biomarkers for the differential diagnosis, prognosis, and development of drug targets in THCA.