


Introduction
Allergic rhinitis (AR) is the most common allergic disease globally. It is one of the main risk factors for the development of asthma, and is known to influence its control. Up to 19–40% of patients with AR also suffer from asthma, and 30–80% of patients with diagnosed asthma also have AR [1, 2]. The two diseases are closely related, and according to the theory of united airways, they can be regarded as different forms of a single disease, only differing in the localization of allergic inflammation [3]. It is suggested that the risk of developing asthma in patients with AR may be influenced by their sensitization profile to airborne allergens. It has been shown that patients with AR and concomitant asthma are four times more likely to demonstrate sensitization to fur animals, including dogs and cats, than patients with isolated AR (44% vs. 11%) [4]. It is known that AR affects the course and degree of asthma control in both adults and children [5–7]. Appropriate treatment of AR improves the control of lower respiratory symptoms, and the use of intranasal steroids can ameliorate both rhinitis and asthma symptoms in patients with AR and asthma [8].
A number of risk factors increase the likelihood of both AR and asthma [1], such as family history of allergy, number of siblings and housing conditions [1, 9, 10]. It is known that the probability of a child developing AR in a family with allergic diseases ranges from 33% to 90%. This risk is three times greater compared to that of the general population if more than one first-degree relative is allergic [1, 9]. Other important factors associated with the development of allergic diseases include the level of vitamin D3 in the body and exposure to air pollution, including tobacco smoke [11–14]. Vitamin D3 affects the regulation of the inflammatory process by affecting the cells of the immune system, including Treg lymphocytes, B lymphocytes, macrophages and dendritic cells [15, 16]. In addition, a number of environmental factors associated with the prenatal period also affect the risk of developing AR and asthma; these include inter alia diet and vitamin supplementation in pregnant women, and exposure to tobacco smoke, pesticides, air pollution and infectious agents during pregnancy [17, 18]. Although data on the relationship between breastfeeding and the development of allergies vary, Han et al. report that children breastfed for at least a year had a lower risk of AR compared to those breastfed for less than 6 months. In addition, the development of AR was more often preceded by caesarean section than vaginal delivery [19].
It is possible to identify children with AR at risk of a more severe course of the disease by analysing the potential family, environmental and clinical factors related to the development of the disease; the findings will help identify patients with a higher risk of developing asthma in the future, and who will benefit the most from early allergen-specific immunotherapy. A commonly-applied method involves cluster analysis, which allows patients to be grouped according to similar characteristics. Such analyses are valuable in allergology to identify patients most at risk of AR complications, including the development of asthma and to implement individualized approaches to both treatment and prevention. However, cluster analysis data in children with AR in Europe, and the rest of the world, are scarce.
Aim
The aim of the study was therefore to identify factors (family, environmental, clinical) that influence the course of AR and its frequency of co-occurrence with asthma in children with AR living in the Kuyavian-Pomeranian voivodeship, Poland.
Material and methods
The study was approved by the Bioethics Committee of the CM NCU (approval No. KB 391/2017). All patients (≥ 16 years old) and their legal guardians gave written consent to participate in the study before taking part.
Patients
Patients for the study were recruited from among children hospitalized in the Department of Paediatrics, Allergology and Gastroenterology of Ludwik Rydygier Collegium Medicum in Bydgoszcz, NCU, and who had been under the care of the Clinical Allergology Clinic from 1 October 2017 to 31 December 2019. The study group included patients diagnosed with allergic rhinitis according to ARIA criteria [3], and met the inclusion and exclusion criteria presented in Table 1 [3, 20].
Table 1
Inclusion and exclusion criteria for the study group
| Inclusion criteria for the study group | Exclusion criteria for the study and control group |
|---|---|
|
Classification of allergic rhinitis
The classification of AR was carried out on the basis of an interview with the patient and the legal guardian, based on the frequency of AR symptoms in the last year, in accordance with the ARIA guidelines [3], i.e.:
Severity of allergic rhinitis
The severity of allergic rhinitis was assessed by three methods:
according to ARIA guidelines:
mild AR – symptoms do not interfere with sleep, daily activity (including sports), study or work, and the patient does not consider them burdensome,
moderate/severe AR – symptoms interfere with the patient’s functioning in at least one sphere of life (sleep, daily activities, including playing sports, studying, work) or the patient considers AR symptoms to be troublesome;
based on the answer to question 14 in Part I of the ISAAC questionnaire, modified:
Over the last 12 months, how much did the above conditions (symptoms of AR) affect your child’s daily functioning? (in general, to a small extent, to a moderate extent, to a large extent.)
based on Total Nasal Symptom Score (TNSS) [21], modified:
Patients were asked to assess the severity of each of the five symptoms of AR they usually experience (viz. nasal itching, nasal blockage, runny nose, sneezing, itching/watery eyes) on a scale from 0 (symptom absent) to 3 points (symptom is significantly intensified) (max 15 points).
Survey
A questionnaire was created based on the validated ISAAC questionnaire [22]. It contained 50 questions divided into two parts. The questions in the first part (22 questions) concerned the occurrence of symptoms of allergic diseases, i.e. asthma, allergic rhinitis and AD. The questions in the second part (28 questions) concerned allergy risk factors, including family history of allergic diseases, perinatal history, physical activity, exposure to air pollution, contact with pets, vitamin D3 supplementation.
Skin prick tests
The skin prick method was performed. The test used standardized reagents from Allergopharma – Nexter (Reinbek, Germany), according to the European Academy of Allergy and Clinical Immunology (EAACI) recommendations [23].
The tests examined the presence of allergy to a number of agents including grass pollen, rye, alder, hazel, birch, mugwort, plantain, Dermatophagoides pteronyssinus, Dermatophagoides farinae, dog epidermis, cat epidermis and mould (Alternaria alternata, Aspergillus fumigatus, Cladosporium herbarum).
Concentration of allergen-specific IgE against airborne allergens
The concentration of allergen-specific IgE (asIgE) in blood serum was determined by the Polycheck method (Biocheck GmbH, Munster, Germany) for allergens: birch pollen, alder, hazel, timothy, rye, mugwort, plantain, D. pteronyssinus, D. farinae, dog epidermis, cat, Aspergillus fumigatus, Cladosporium herbarum, Penicillium notatum, Alternaria alternata. Sensitization was considered indicated by the presence of asIgE against a given allergen in the titre ≥ 0.35 kU/l.
Assessment of bronchial hyperresponsiveness
Bronchial hyperresponsiveness (BHR) was assessed on the basis of a methacholine challenge using the Lungtest 1000 apparatus and MES ISPA. The tests were based on physiological saline and methacholine solutions with the following concentrations: 0.0625, 0.25, 1.0, 4.0 and 16 mg/ml. The study was conducted, and its results interpreted, in accordance with the European Respiratory Society (ERS) recommendations [24]. The degree of bronchial hyperresponsiveness was determined by PD20 (dose of the challenge substance causing a 20% reduction in FEV1, in mg).
Measurement of nitric oxide concentration in the lower respiratory tract (FeNO)
Measurement of the concentration of nitric oxide exhaled with air from the bronchi (FeNO) was performed using the HypAir FeNO device by Medisoft. At least two FeNO measurements were performed in each patient. The mean value of the measurements was taken as the final result. The examination was conducted and its results interpreted in accordance with the recommendations of the American Thoracic Society (ATS) [25, 26].
Measurement of nitric oxide concentration in the upper respiratory tract (nNO)
Nitric oxide concentration in the upper respiratory tract (nasal NO, i.e. nNO) was measured using HypAir FeNO (Medisoft). The mean value of the measurements from both nostrils was taken as the final result. The study was conducted in accordance with the ATS recommendations [25, 26].
Assessment of lipid metabolism parameters
Total cholesterol (TC), low-density lipoprotein (LDL), high-density lipoprotein (HDL) and triglyceride (TG) concentrations were determined in the blood serum using the ARCHITECT c System analyser. Interpretation of the results, according to the Test Data Sheet, is presented in Table 2.
Table 2
The interpretation of TC, LDL, HDL and TG values according to the test safety data sheet
Statistical analysis
The statistical analysis of the results was performed with the use of Statistica v. 13.1 (StatSoft Polska). Statistical significance was considered at p < 0.05.
Cluster analysis was used to identify parameters that clearly distinguish between groups of patients with AR. This method is called unsupervised learning and is used to group elements into classes characterized by relative homogeneity. In order to apply cluster analysis to the studied patient characteristics, the variables characterizing the clinical picture of patients were qualified. Univariate and multivariate logistic regression analyses were used to determine the suitability of the analysed biochemical parameters and survey data for classifying patients into individual groups (i.e. AR and AR with asthma) and clusters.
The importance of individual factors were described using odds ratio (OR) values with a 95% confidence interval. Any parameters found to be significant in the univariate analysis with p < 0.1 were included in the multivariate analysis.
Results
Cluster analysis
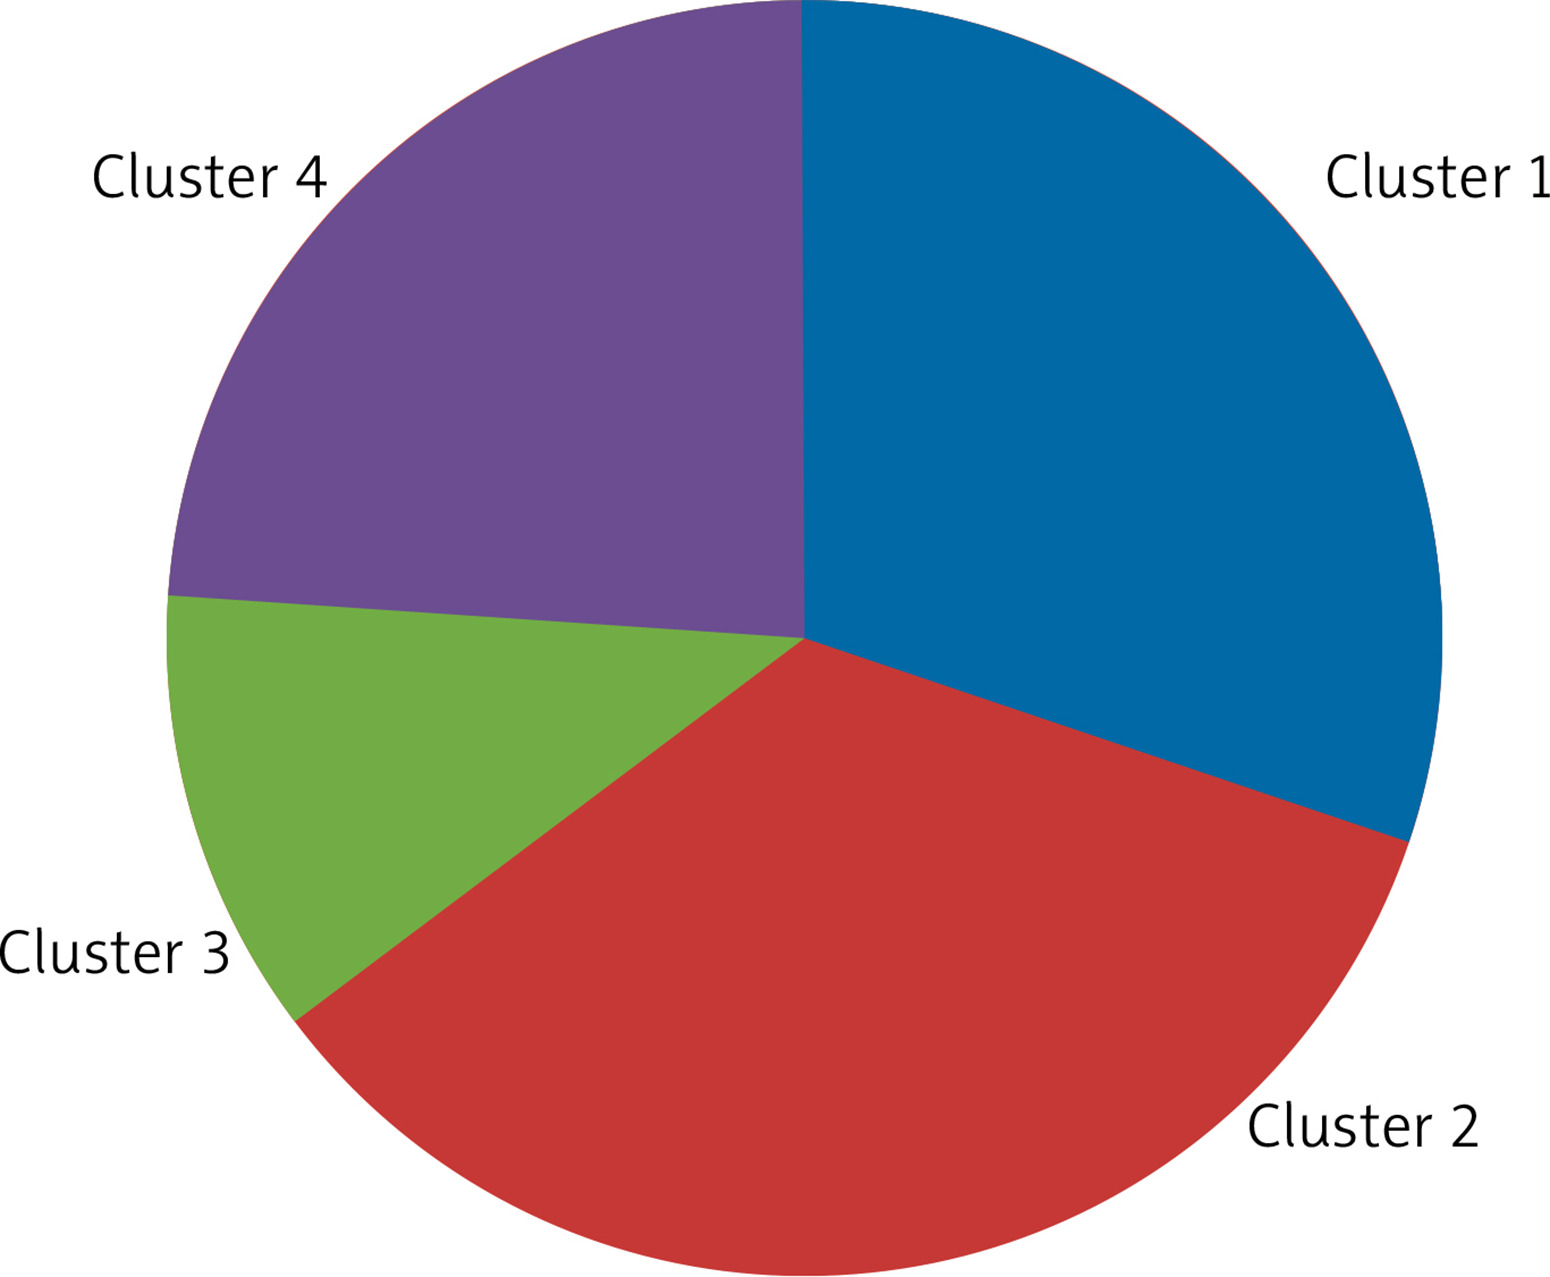
Four clusters were distinguished among patients with AR (AR group and AR group with asthma) based on the collected clinical and familial and environmental data. The clusters consisted of:
Cluster 1 – 28 (35.00%) children,
Cluster 2 – 19 (23.75%) children,
Cluster 3 – 15 (18.75%) children,
Cluster 4 – 18 (22.50%) children (Figure 1).
The factors found to play significant roles in assigning patients to a specific cluster based on univariate and multivariate analyses are given in Tables 3 and 4, respectively.
Table 3
Results of one-way logistic regression analysis for selected clusters of patients with AR
Table 4
Results of multivariate logistic regression analysis for selected clusters of patients with AR
Characteristics of Cluster 1 patients
Cluster 1 included children with pAR (n = 24; 85.71%), moderate severity of symptoms (n = 14; 50.00%) and concomitant asthma (n = 17; 60.71%), who were allergic to year-round allergens (house dust mite D. pteronyssinus and cat epidermis), including bronchial hyperreactivity (n = 26; 92.86%; p < 0.001) and elevated and high FeNO values (n = 17; 60.71%, p < 0.001). It should be noted that the prevalence of BHR in this cluster was 92.86%, with the prevalence of asthma being 60.71%; therefore, in addition to children with AR and asthma, the first cluster also included a large percentage of children with AR and clinically silent BHR. The highest nNO values were also found in this cluster (Me = 1815.95 ppb; p = 0.045). The patients were characterised by a higher birth weight than those in other clusters, had contact with a cat in the first year of life, and who were not supplemented with vitamin D3. In addition, they had a significantly higher incidence of abnormally high TC values (n = 18; 64.29%; p = 0.033) (Table 5).
Table 5
Comparison of selected clinical and sociodemographic data between clusters identified in the study group
Characteristics of Cluster 2 patients
Cluster 2 consisted mostly of children with pAR (n = 15; 78.95%) with moderately severe symptoms (n = 10; 52.63%), rarely BHR (n = 3; 15.79%), and usually presented with normal FeNO values (n = 18; 94.74%). In 6 (31.58%) children, asthma coexisted with AR. These patients were born with a lower birth weight than in other clusters, and were supplemented with vitamin D3. Significantly fewer had elevated cIgE values than other clusters (p < 0.001). Most children demonstrated normal lipid metabolism parameters: TC (n = 13; 68.42%), LDL (n = 16; 84.21%), HDL (n = 18; 94.73%) and TG (n = 14; 73.68%). This cluster was also significantly less likely to present with abnormally high LDL values than other clusters (p = 0.015) (Table 5).
Characteristics of Cluster 3 patients
Cluster 3 included mostly children with iAR (n = 11; 73.33%), without concomitant asthma (n = 11; 73.33%), and most presented with BHR (n = 11; 73.33%) and normal FeNO values (n = 12; 80.00%). Every fifth (n = 3; 20.00%) patient indicated that AR did not affect their daily functioning, while none reported any significant impairment of functioning. These children were mostly born to mothers with secondary education, did not have many siblings, were breastfed for a short time (< 6 months) and often required antibiotic therapy during the first year of life (three to five times). They tended to be supplemented with vitamin D3, and were rarely allergic to D. pteronyssinus. Similarly to Cluster 2, the patients belonging to this cluster were mostly characterized by normal lipid metabolism parameters: TC (n = 10; 66.66%), LDL (n = 8; 53.33%), HDL (n = 12; 80.00%) and TG (n = 12; 80.00%) (Table 5).
Characteristics of Cluster 4 patients
Cluster 4 included mostly children with mild iAR that did not interfere or only slightly interfered with daily functioning (n = 10; 55.56%); most did not present with BHR (n = 16; 88.89%), but indicated normal FeNO (n = 14; 77.78%) and were supplemented with vitamin D3. This cluster also demonstrated significantly lower coexistence of AR with asthma than the others (n = 1; 5.56%; p < 0.001). However, abnormally high triglyceride values were significantly more common (n = 12; 66.67%; p = 0.009). The mean age of children in this cluster was the highest (13.07 years), but the difference was not statistically significant (p = 0.117) (Table 5).
Analysis of the relationship between FeNO, nNO concentrations and the severity of AR symptoms in individual clusters
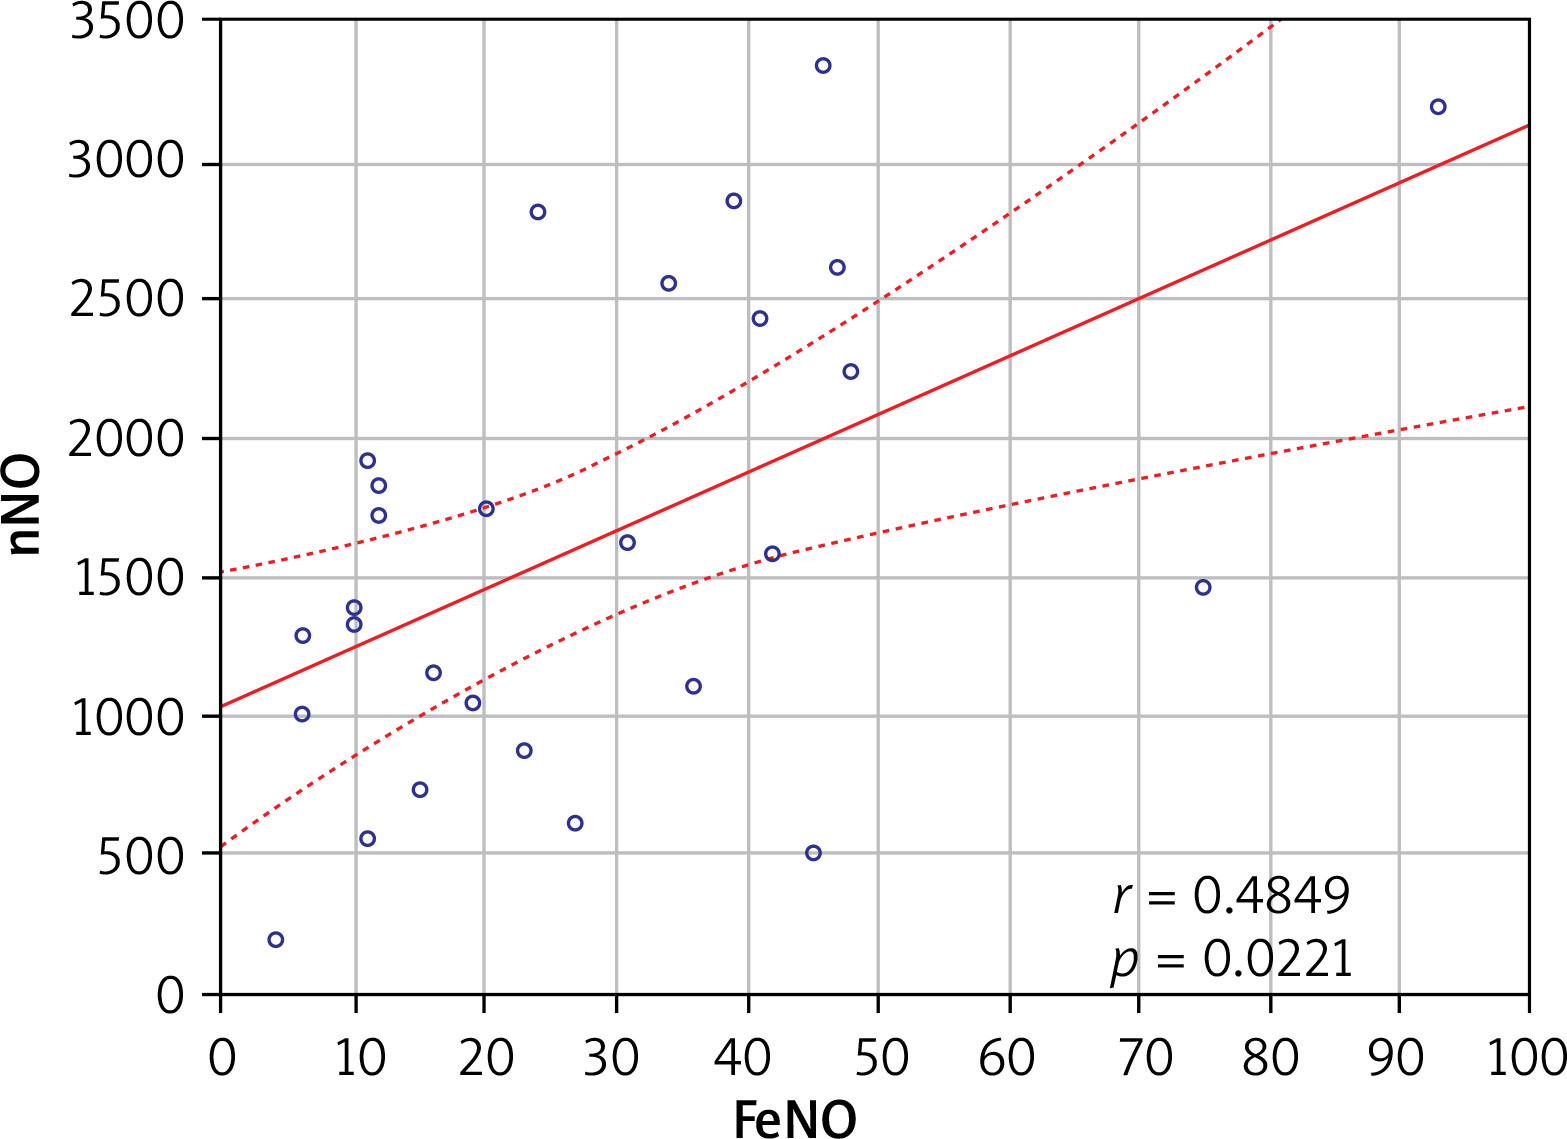
A positive correlation was found between FeNO and nNO values in Cluster 1 (r = 0.485; p = 0.022) (Figure 2); however no such relationship was observed in the other clusters (p > 0.05). No relationship was found between the severity of symptoms and FeNO values in any of the identified clusters (p > 0.05). A positive correlation was found between the severity of AR symptoms and nNO concentration in Cluster 4 (r = 0.628; p = 0.016) (Table 6).
Table 6
Relationship between FeNO concentration, nNO concentration and the severity of AR symptoms in clusters identified in the study group
Discussion
Our analysis identified four clusters of patients; these differed, among others, in the course and severity of AR symptoms, the frequency of asthma co-occurrence, the frequency of BHR, FeNO and nNO concentrations, and values of lipid metabolism parameters.
The characteristics of the four clusters are in line with those identified in previous studies on children with AR. Kurukulaaratchy et al. distinguished four clusters of patients with AR, which differed inter alia in the course of AR and the frequency asthma and AR comorbidity [27]. Cluster 1 (n = 128; 27.4% of children) included mostly teenagers with seasonal AR (sAR), with moderately severe symptoms, diagnosed during their school years (mean age of AR diagnosis: 11.09 years); asthma co-occurred rarely (41.4%). They usually had normal FeNO values and rarely demonstrated BHR. Cluster 2 (n = 199; 42.5% of children) included girls with mild sAR, diagnosed in their teenage years, with the lowest percentage of atopy and asthma, with normal FeNO values, without coexisting bronchial hyperresponsiveness.
In the present study, cluster four appears to most closely resemble clusters 1 and 2 of the Isle of Wight population; this group comprises children with iAR, with a mild course and a minor impact of symptoms on daily functioning, rarely accompanied by BHR or asthma.
The patients of Cluster 3 in the Isle of Wight study (n = 59; 12.6% of respondents) were mostly characterised by sAR and severe symptoms, and were diagnosed at the youngest age of the groups (mean age = 6.3 years) [27]. They tended to have abnormally high FeNO values, a high percentage of BHR and the highest percentage of asthma comorbidity among all the clusters (72.9%). This group corresponds most closely to our first cluster, including the most frequent coexistence of asthma with AR and BHR and elevated FeNO values.
Isle of Wight Cluster 4 (82; 17.5% of children) included mainly male patients with moderate symptoms, and were diagnosed typically at 9 years of age. sAR, often with co-occurring asthma [27]. They were characterized by abnormally high FeNO values and the presence of BHR, but with less severe symptoms than Cluster 3. Cluster 4 is most similar to Cluster 3 in our present study: iAR, the symptoms tended to have a mild/moderate impact on daily functioning, BHR was common, but less so than in the first cluster, and most patients had normal FeNO values.
In addition to the clinical data, both our present study and the Isle of Wight analysis considered a number of environmental factors when qualifying a patient to a cluster. In our present study, the significant environmental factors affecting the qualification of a child to a given cluster included vitamin D3 supplementation, birth weight, length of breastfeeding, number of siblings, mother’s education, frequency of antibiotic therapy in the first year of life and contact with a cat in the first year of life. In turn, Kurukulaaratchy et al. report that low birth weight or exclusive breastfeeding have no effect on qualifying patients to clusters. In addition, both studies found that neither a positive history of allergies in the family, paracetamol intake nor exposure to tobacco smoke had a significant effect on clustering [27].
A study of a group of young adults (median age – 28 years) with AR without diagnosed asthma by Ciprandi et al. identified a particularly high-risk cluster for asthma development; this included adults with the longest duration of allergic rhinitis (mean 7 years), sensitized to mould spore allergens (Alternaria alternata in 100% of patients), with significantly higher FeNO values (average – 41 ppb; p = 0.0007) and the highest percentage of BHR (70.6% of respondents; p < 0.0001) compared to other clusters [28]. The researchers propose that the patients belonging to this cluster, being the most at risk of developing asthma in the future, will benefit the most from an early commencement of allergen-specific immunotherapy [28]. In the present study, the highest percentage of comorbid asthma with AR was demonstrated in Cluster 1, in which, similarly to Ciprandi et al., allergies to year-round allergens (D. pteronyssinus and cat dander) prevailed.
Among children from the Polish birth cohort REPRO_PL, who lived from birth to 10 years of age in the same apartment, Kapsewicz et al. found that a high concentration of cat allergen Fel 1 in house dust collected from the apartment was associated with a higher incidence of asthma at 10 years of age (95% CI: 10.87 to 20.93; p < 0.001) [29]. Our present findings indicate that exposure to cat allergens in the first year of life (i.e. regular contact with a cat in the first year of life) was one of the significant factors classifying patients to Cluster 1, characterised by the highest percentage of AR and asthma comorbidity. Additionally, Kapsewicz et al. distinguished two clusters of patients depending on exposure to house dust mites. Cluster 1 was characterised by a low exposure to HDM: these children lived in houses or apartments with the “old” type of windows, which are more draughty, ensuring greater air exchange in the house and thus lower levels of humidity and fungal spores in the rooms, and which were cleaned more frequently. Cluster 2 was characterised by a high exposure to HDM: these children lived in houses or apartments with the “new” type of windows, with higher levels of humidity and concentration of fungal spores, and which are cleaned less often. Asthma was more frequently (but not significantly) observed in children in Cluster 2 (11.6%) than Cluster 1 (23.5%, p = 0.1015) [29].
A study by Meng et al. of children and adults (n = 259; 8–58 years; mean age – 36.1 years) reporting symptoms of rhinitis distinguished six clusters, of which the first two included patients with AR (Cluster 1 – AR, Cluster 2 – AR with asthma), with Cluster 2 patients being characterized by significantly higher FeNO values than Cluster 1 patients (43.8 ppb vs. 10.9 ppb; p < 0.001) [30]. Similar observations were also noted in the present study, in which the cluster with the largest number of patients with asthma also demonstrated elevated FeNO values. Clusters 1 and 2 in Meng et al. did not significantly differ in terms of tIgE concentration or AR symptom severity assessed according to the VAS scale [30]. On the other hand, in the present study, Cluster 1, with the highest percentage of patients with asthma, demonstrated a significantly higher occurrence of elevated tIgE values than the other clusters (p < 0.0001).
In turn, Malizia et al. conducted a cluster analysis among Italian children (aged 6–16) suffering from sAR allergic to grass pollen, taking into account the profile of cytokines present in nasal lavage [31]. The study distinguished three clusters of patients: Cluster 1 – lower level of Il-5 and Il-17 and moderate Il-23 and IFN-γ, Cluster 2 – higher level of Il-5 and moderate IL-17, IL-23 and IFN-γ, Cluster 3 - higher levels of IL-17, IL-23 and IFN-γ and moderate Il-5. The above clusters differed inter alia with regard to the intensity of eosinophilic inflammation in the upper respiratory tract measured by nNO, the intensity of concomitant conjunctival symptoms and the impact of AR symptoms on the quality of sleep. The study highlighted the presence of sAR endotypes that differed in terms of inflammatory cytokine profile, which influenced the clinical picture of the disease in individual children [31].
Park et al. found that the type of work has a significant impact on the occurrence of AR in the population of Korean adults [32]. The disease was significantly more common among “white-collar” workers, i.e. among people working in managerial positions or in positions requiring higher qualifications than pink- (service industry), blue- (manual workers) and green-collar (work related to renewable energy sources) (respectively: 20.1% vs. 12.5% vs. 9.9% vs. 3.3%, p < 0.001). In addition, among women, AR was significantly more common in underweight and normal weight patients compared to those with obesity (18.4% vs. 14.5% vs. 10.4%; p < 0.001). For men, the disease was significantly more common among non-smokers than among current smokers (11.4% vs. 9.7%; p < 0.001) [32]. In the present study, no relationship was noted between the occurrence of AR and body weight or tobacco smoke exposure. These factors were also not significant in assigning patients to the selected clusters.
Hence, current evidence and our present findings suggest that children with pAR, who are allergic to year-round allergens (D. pteronyssinus, cat dander, mould spores), and who present with clinically-silent eosinophilic inflammation in the lower airways (assessed by FeNO measurements) and BHR are at the greatest risk of developing asthma. Our findings indicate that these patients also have the highest nNO values, which indicates a higher intensity of inflammation in the upper respiratory tract in these children than in other clusters. In addition, our cluster analysis suggests that a relationship may exist between lipid metabolism disorders, especially hypercholesterolemia, and the development of asthma in children with AR.
The present study has some limitations, for example, it is based on a small group of children, and all history and allergy diagnostics data were collected at a single time point. Increasing the number of patients included in the study would increase its credibility; in addition, a prospective study would allow a better assessment of the true prognostic value of cluster analysis in children with AR. Nevertheless, our present study obtains significant findings that may be important for the management of children with AR.
Conclusions
Allergic rhinitis is the most common allergic disease in the paediatric population. It is associated with a decrease in the quality of life of children and their families, and with the possibility of complications, the most important of which is the development of asthma. Therefore, to support the continual improvement of care for children with AR, further prospective studies are needed, especially multi-centre ones performed on larger, representative patient populations.