


Introduction
Melanoma, a form of skin cancer, originates from melanocytes, the cells responsible for producing melanin, the pigment that colours our skin [1]. It is estimated that in 2023, around 97,610 new cases of melanoma will be diagnosed in the United States, with approximately 58,120 in men and 39,490 in women. Sadly, about 7,990 individuals are projected to succumb to this disease, including roughly 5,420 men and 2,570 women [2]. On a global scale, over 150,000 new cases of skin melanoma were reported in 2020 [3]. The development of melanoma is largely attributed to lifestyle and genetic risk factors [4].
In human beings, there are three unique gene families that produce soluble glutathione S-transferase (GST); these include mu (GSTM1) located on chromosome 1, theta (GSTT1) on chromosome 22, and pi (GSTP1) on chromosome 11 [5]. The GSTs are enzymes that facilitate the conjugation of glutathione (GSH) to a wide range of electrophiles, such as organic halides, unsaturated carbonyls, arene oxides, and other substrates [6]. There is a growing recognition of the polymorphic nature of an increasing number of GST genes [7]. The dynamic roles of GST and their varying expression patterns in individuals position them as a promising target for the development of new drugs [8]. The most prevalent polymorphisms at the GSTM1 and GSTT1 gene loci involve the total removal of the genes. Regarding the pi class, point mutations in exon 5 (codon 105) of GSTP1 (Ile105Val) have been detected and found to influence the enzyme’s activity [9].
GSTs can regulate several signalling pathways that play a role in melanoma, including c-Jun N-terminal kinase (JNK), nuclear factor-κB (NF-kB), and p53 [10]. Furthermore, GSTs can alter the metabolism and pH levels of melanosomes, which are the organelles responsible for the production and storage of the pigment melanin. While melanin can shield melanocytes from damage caused by UV rays, it can also impact the progression of melanoma and the response to drugs [11]. It has been observed that polymorphisms in the GST family can impact the risk of various types of cancers, including non-melanoma skin cancers [12, 13] and multiple cutaneous skin cancers [14, 15]. Moreover, two meta-analyses [12, 16] have highlighted the correlation between GST polymorphisms and the risk of melanoma. One of these analyses [12], conducted in 2015, and focused on the GSTP1 Ile105Val polymorphism across four studies. Another analysis [16] in 2011 examined GSTM1 and GSTT1 polymorphisms across eight and five studies, respectively.
Aim
In our research, we assessed three GST polymorphisms (GSTM1, GSTT1, and GSTP1 Ile105Val) through a meta-analysis that included a larger number of studies and incorporated trial sequential analysis (TSA).
Material and methods
The study followed the guidelines for PRISMA protocol [17]. The PECO framework (Population, Exposure, Comparison, and Outcome) was used to formulate research questions. Population (P): Individuals with GST polymorphisms. Exposure (E): Prevalence of GST polymorphisms. Comparison: Individuals with cutaneous melanoma compared with healthy or free-cancer controls. Outcome (O): Risk of cutaneous melanoma.
Study selection
We conducted a comprehensive search of four databases, namely PubMed, Scopus, Cochrane Library, and Web of Science, to gather pertinent studies up until 24 August 2023. We did not impose any restrictions during our search. The keywords or terms we used included: (“GSTM1” OR “GSTT1” OR “GST*” OR “GSTP1” OR “Glutathione S-transferase*”) AND (“melanoma” OR “skin cancer” OR “skin carcinoma” OR “Skin neoplasms”) AND (“polymorphism*” OR “variant*” OR “gene*” OR “genotype*” OR “allele*”). To ensure we did not overlook any study, we also searched “Google Scholar” and citations related to articles, reviews, and meta-analyses on the topic. This entire process was carried out by a single author.
Eligibility criteria
Criteria for including studies:
Studies of any type that report on melanoma cases and controls.
Studies in any language.
Cases where melanoma has been diagnosed either clinically or pathologically.
Studies that report on the prevalence of GST polymorphisms (GSTM1, GSTT1, and/or GSTP1).
Criteria for excluding studies: Studies will be excluded if they are animal studies, lack a control group, are reviews or meta-analyses, are book chapters or conference papers, or do not provide the necessary data for calculating odds ratios (OR) and 95% confidence interval (CI).
Data extraction
One author retrieved any data related to each study entered into the analysis including publication year, country, ethnicity, number of cases and controls, control source, control matching, quality score, and the prevalence of genotypes and alleles of GST polymorphisms.
Quality evaluation
The quality scoring of the study was conducted by one author using the Newcastle-Ottawa Scale (NOS) tool [18]. This tool assessed a study from three main aspects: the selection process of the study groups (4 points), the comparability of the groups (2 points), and the determination of the exposure of interest for case-control studies (3 points). The highest score achievable was nine, with a score of seven or more indicating high quality. The scores were then reviewed by another author. Any disagreements between the authors were settled through a brief discussion.
Statistical analysis
The Review Manager 5.3 software (RevMan 5.3; the Cochrane Collaboration, the Nordic Cochrane Centre, Copenhagen, Denmark) was utilized to calculate the effect sizes, displaying the OR along with a 95% CI of the prevalence of genotypes of GST polymorphisms in melanoma patients and controls. The significance of the pooled OR was determined using the Z-test, with a two-sided p-value less than 0.05 deemed significant. In cases where Pheterogeneity was less than 0.1 (I2 greater than 50%), indicating significant heterogeneity, a random-effects model [19] was employed. If heterogeneity was not significant, a fixed-effect model [20] was used.
A subgroup analysis was conducted to ascertain if the combined effect sizes in these subgroups significantly differed from each other. A fixed-effects meta-regression analysis was also performed to establish a linear correlation between auxiliary variables in the study and effect size.
The potential for publication bias was assessed using a Begg’s funnel plot and Begg’s test, with the degree of asymmetry tested using Egger’s test. The p-values of Egger’s and Begg’s tests were extracted, with a 2-sided p-value less than 0.10 indicating potential publication bias. Sensitivity analysis was conducted using both “one-study-removed” and “cumulative” analyses to evaluate the stability/consistency of pooled ORs. Both publication bias and sensitivity analyses were performed using Comprehensive Meta-Analysis version 3.0 software (CMA 3.0; Biostat Inc., Englewood, NJ, USA).
To mitigate the risk of false-positive or negative conclusions from meta-analyses [21], TSA was carried out using TSA software (version 0.9.5.10 beta) (Copenhagen Trial Unit, Centre for Clinical Intervention Research, Rigshospitalet, Copenhagen, Denmark) [22]. TSA allowed for testing of a futility threshold to determine a result of no effect before reaching the required information size. The required information size (RIS) was calculated with an α risk of 5%, a β risk of 20%, and a two-sided boundary type. Heterogeneity was assessed for the prevalence of the genotypes of GST polymorphisms in melanoma patients and controls. If the Z-curve reached the RIS line or followed the boundary line or futility area, it indicated that sufficient cases were included in the studies and the conclusions were reliable. If not, more data would be needed as the information available was not sufficient.
Results
Study selection
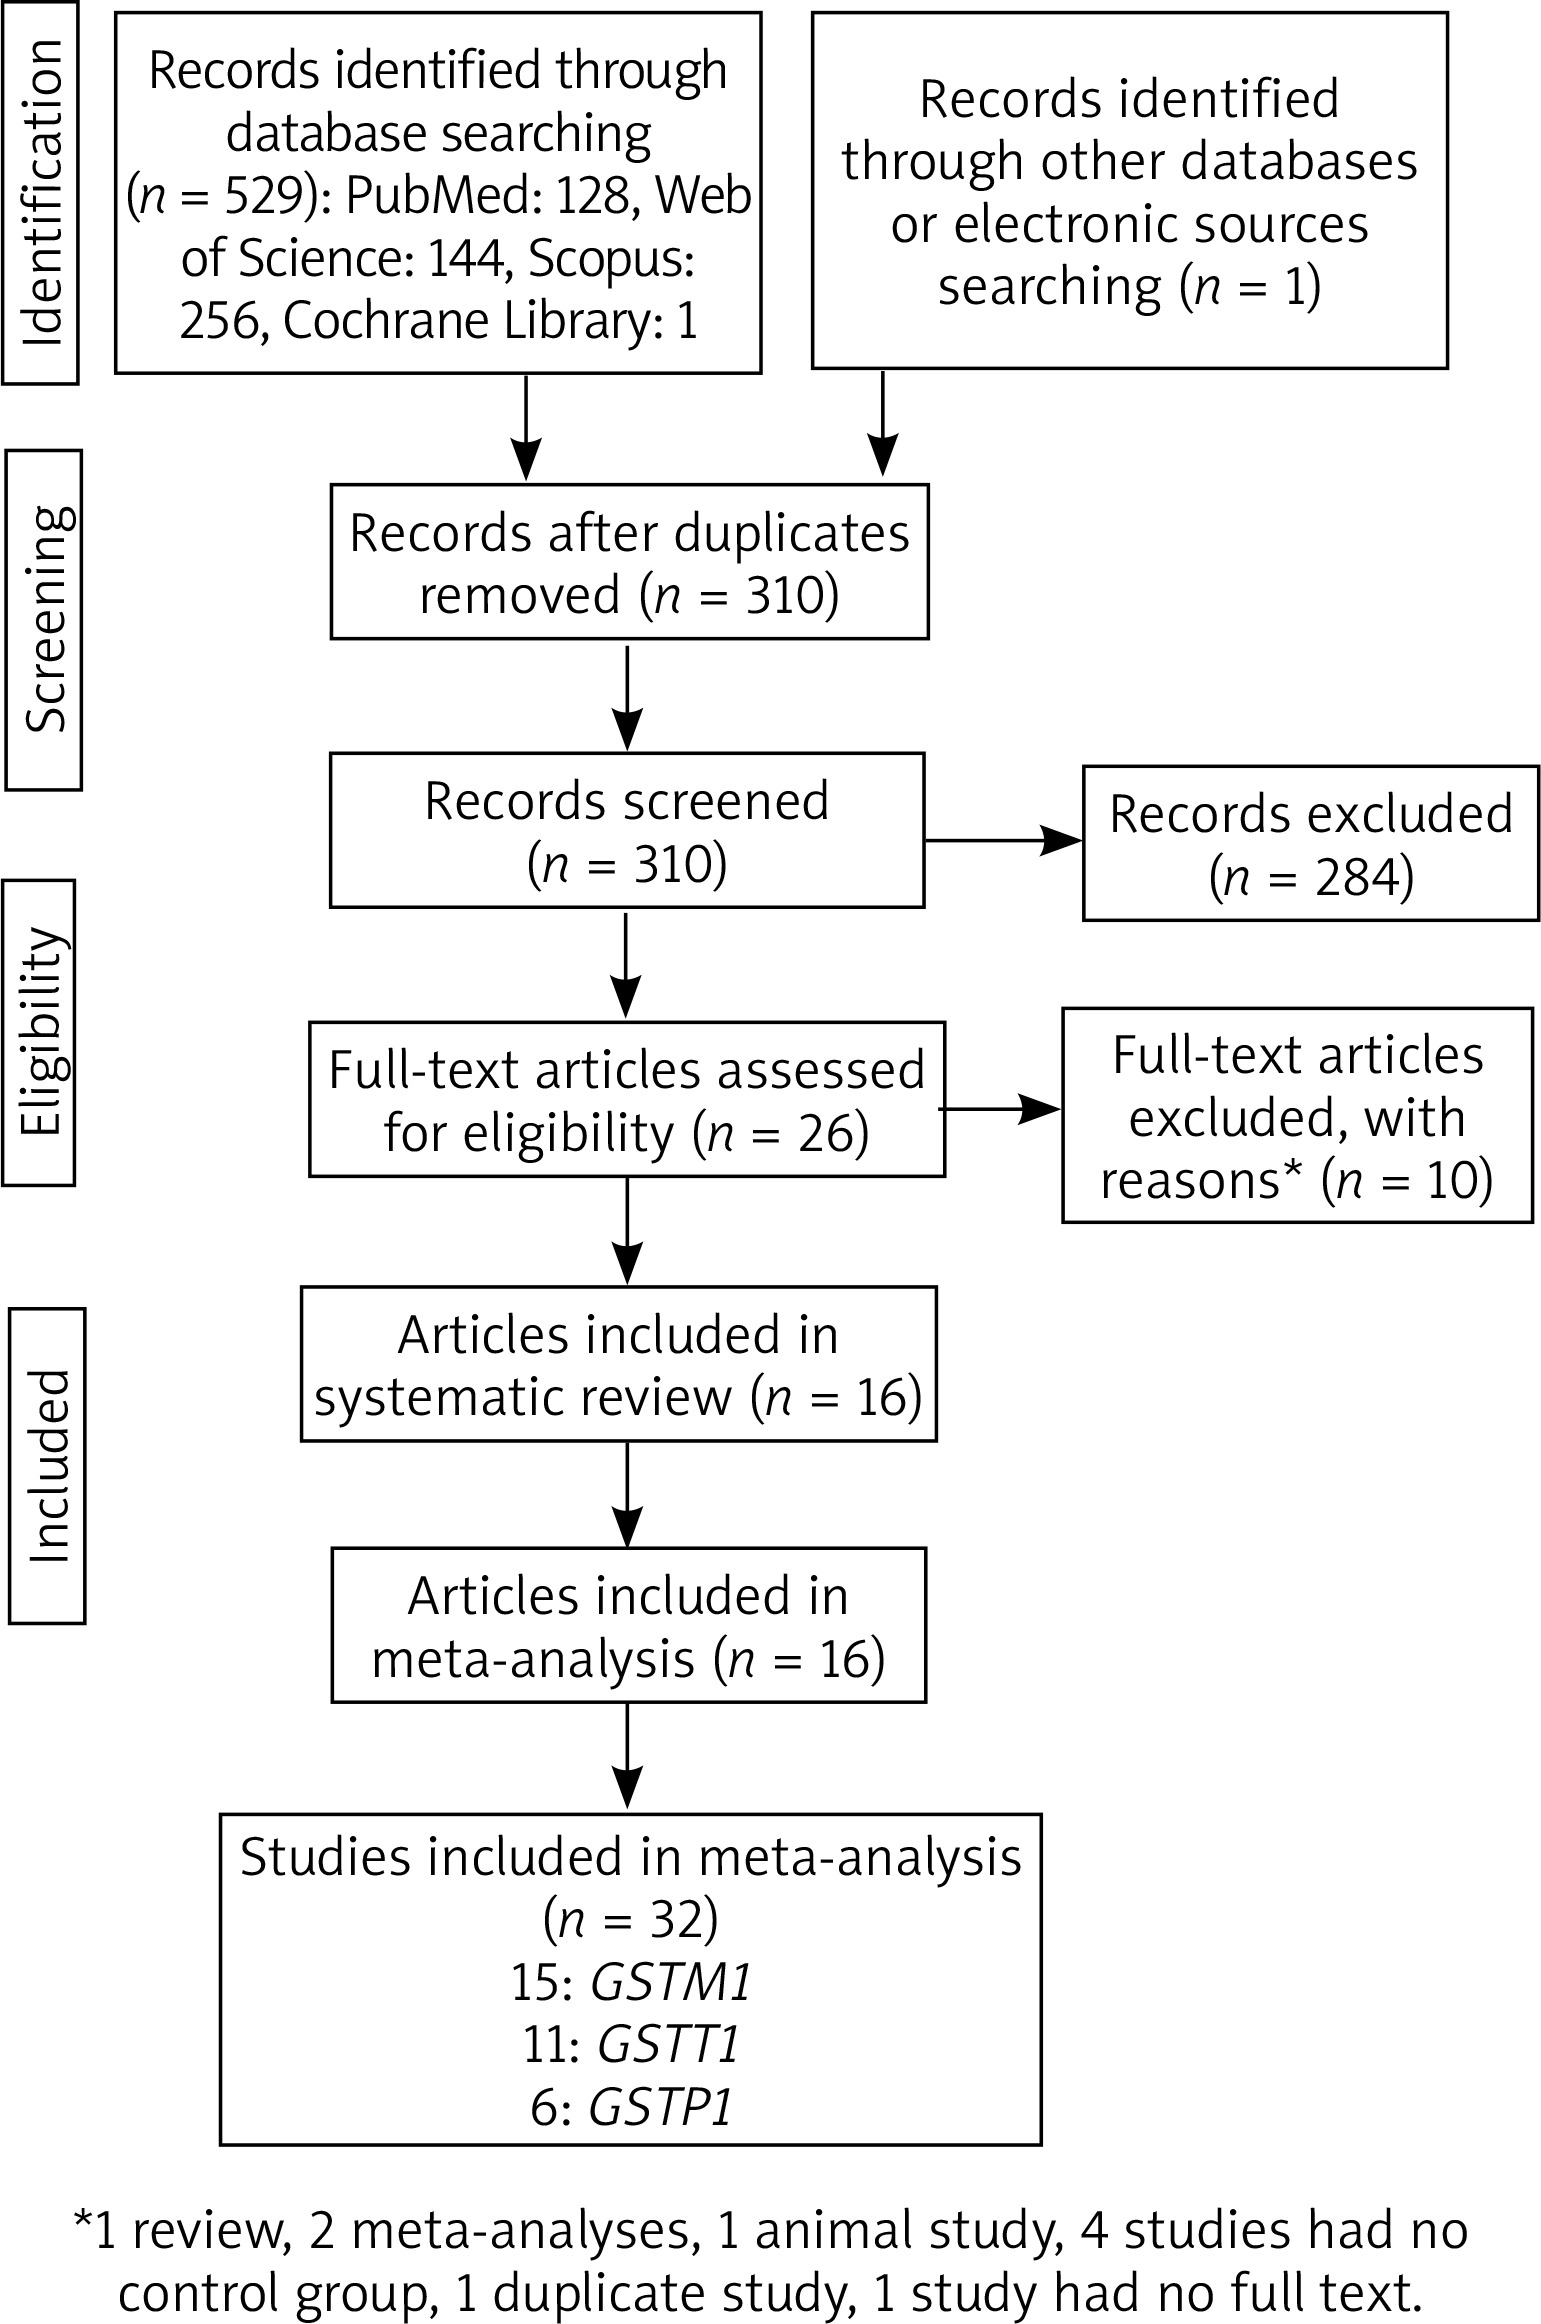
In the databases, we initially identified 530 records (Figure 1). After the removal of duplicates and irrelevant records, we were left with 26 full-text articles. Upon further review, 10 of these articles were excluded for various reasons. Consequently, we included 16 articles [23–38] in our analysis, which collectively encompassed 32 studies.
Characteristics of studies
Table 1 shows the characteristics of studies conducted in different countries, primarily focusing on Caucasian, Asian, and mixed ethnicities. The studies, which ranged from population-based to hospital-based, investigated the outcomes of GSTM1, GSTT1, and GSTP1 Ile105Val polymorphisms. The number of cases and controls varied across studies, as did the control matching for age and sex. Each study was assigned a quality score reflecting its credibility.
Table 1
Characteristics of studies
| First author, publication year | Country | Ethnicity | Control source | Number of cases/controls | Control matching (age and sex) | Outcome | Quality score |
|---|---|---|---|---|---|---|---|
| Dolzan, 2006 [23] | Slovenia | Caucasian | PB | 137/116 | None | GSTM1, GSTT1, and GSTP1 | 7 |
| Shanley, 1995 [27] | Australia | Caucasian | PB | 124/200 | None | GSTM1 | 7 |
| Heagerty, 1994 [25] | UK | Caucasian | PB | 64/153 | Both | GSTM1 | 9 |
| Fortes, 2016 [24] | USA | Caucasian | HB | 177/148 | Both | GSTM1 | 8 |
| Rinck-Junior, 2019 [26] | Brazil | Mixed | HB | 229/258 | None | GSTM1, GSTT1 | 6 |
| Leite, 2007 [28] | Brazil | Mixed | PB | 5/124 | None | GSTM1, GSTT1, and GSTP1 | 7 |
| Kanetsky, 2001 [29] | USA | Caucasian | HB | 362/271 | None | GSTM1, GSTT1 | 6 |
| Lafuente, 1995 [30] | Spain | Caucasian | HB | 183/147 | None | GSTM1 | 6 |
| Fortes, 2011 [31] | Italy | Caucasian | HB | 188/152 | Both | GSTM1, GSTT1 | 8 |
| Ibarrola-Villava, 2012 [32] | Spain | Caucasian | HB | 560/337 | None | GSTM1, GSTT1, and GSTP1 | 5 |
| Bu, 2007 [33] | Sweden | Caucasian | HB | 154/203 | None | GSTM1, GSTT1, and GSTP1 | 6 |
| Mössner, 2007 [34] | Germany | Caucasian | HB | 322/347 | None | GSTM1, GSTT1 | 6 |
| Xie, 2011 [35] | China | Asian | HB | 77/107 | None | GSTM1, GSTT1 | 5 |
| Vlaykova, 2012 [36] | Turkey | Caucasian | HB | 22/124 | None | GSTM1, GSTT1 | 6 |
| Chiyomaru, 2013 [37] | Japan | Asian | HB | 46/92 | Both | GSTM1, GSTT1, and GSTP1 | 8 |
| Oliveira, 2013 [38] | Brazil | Mixed | PB | 146/146 | Both | GSTP1 | 9 |
Figure 2 shows a forest plot analysis of 15 studies reporting the association of GSTM1 polymorphism with the risk of melanoma based on 2650 cases versus 2779 controls. The total number of events across all studies was 411 and 504 for the two groups, respectively. The overall effect size, represented as an OR, was 1.10 with a 95% CI of 0.90 to 1.35. This result was not statistically significant (p = 0.33), indicating no substantial difference between the two groups across all studies. The heterogeneity of the studies, which measures the variability among the studies’ results, was relatively low (I² = 0%), suggesting that the studies were fairly consistent in their findings.
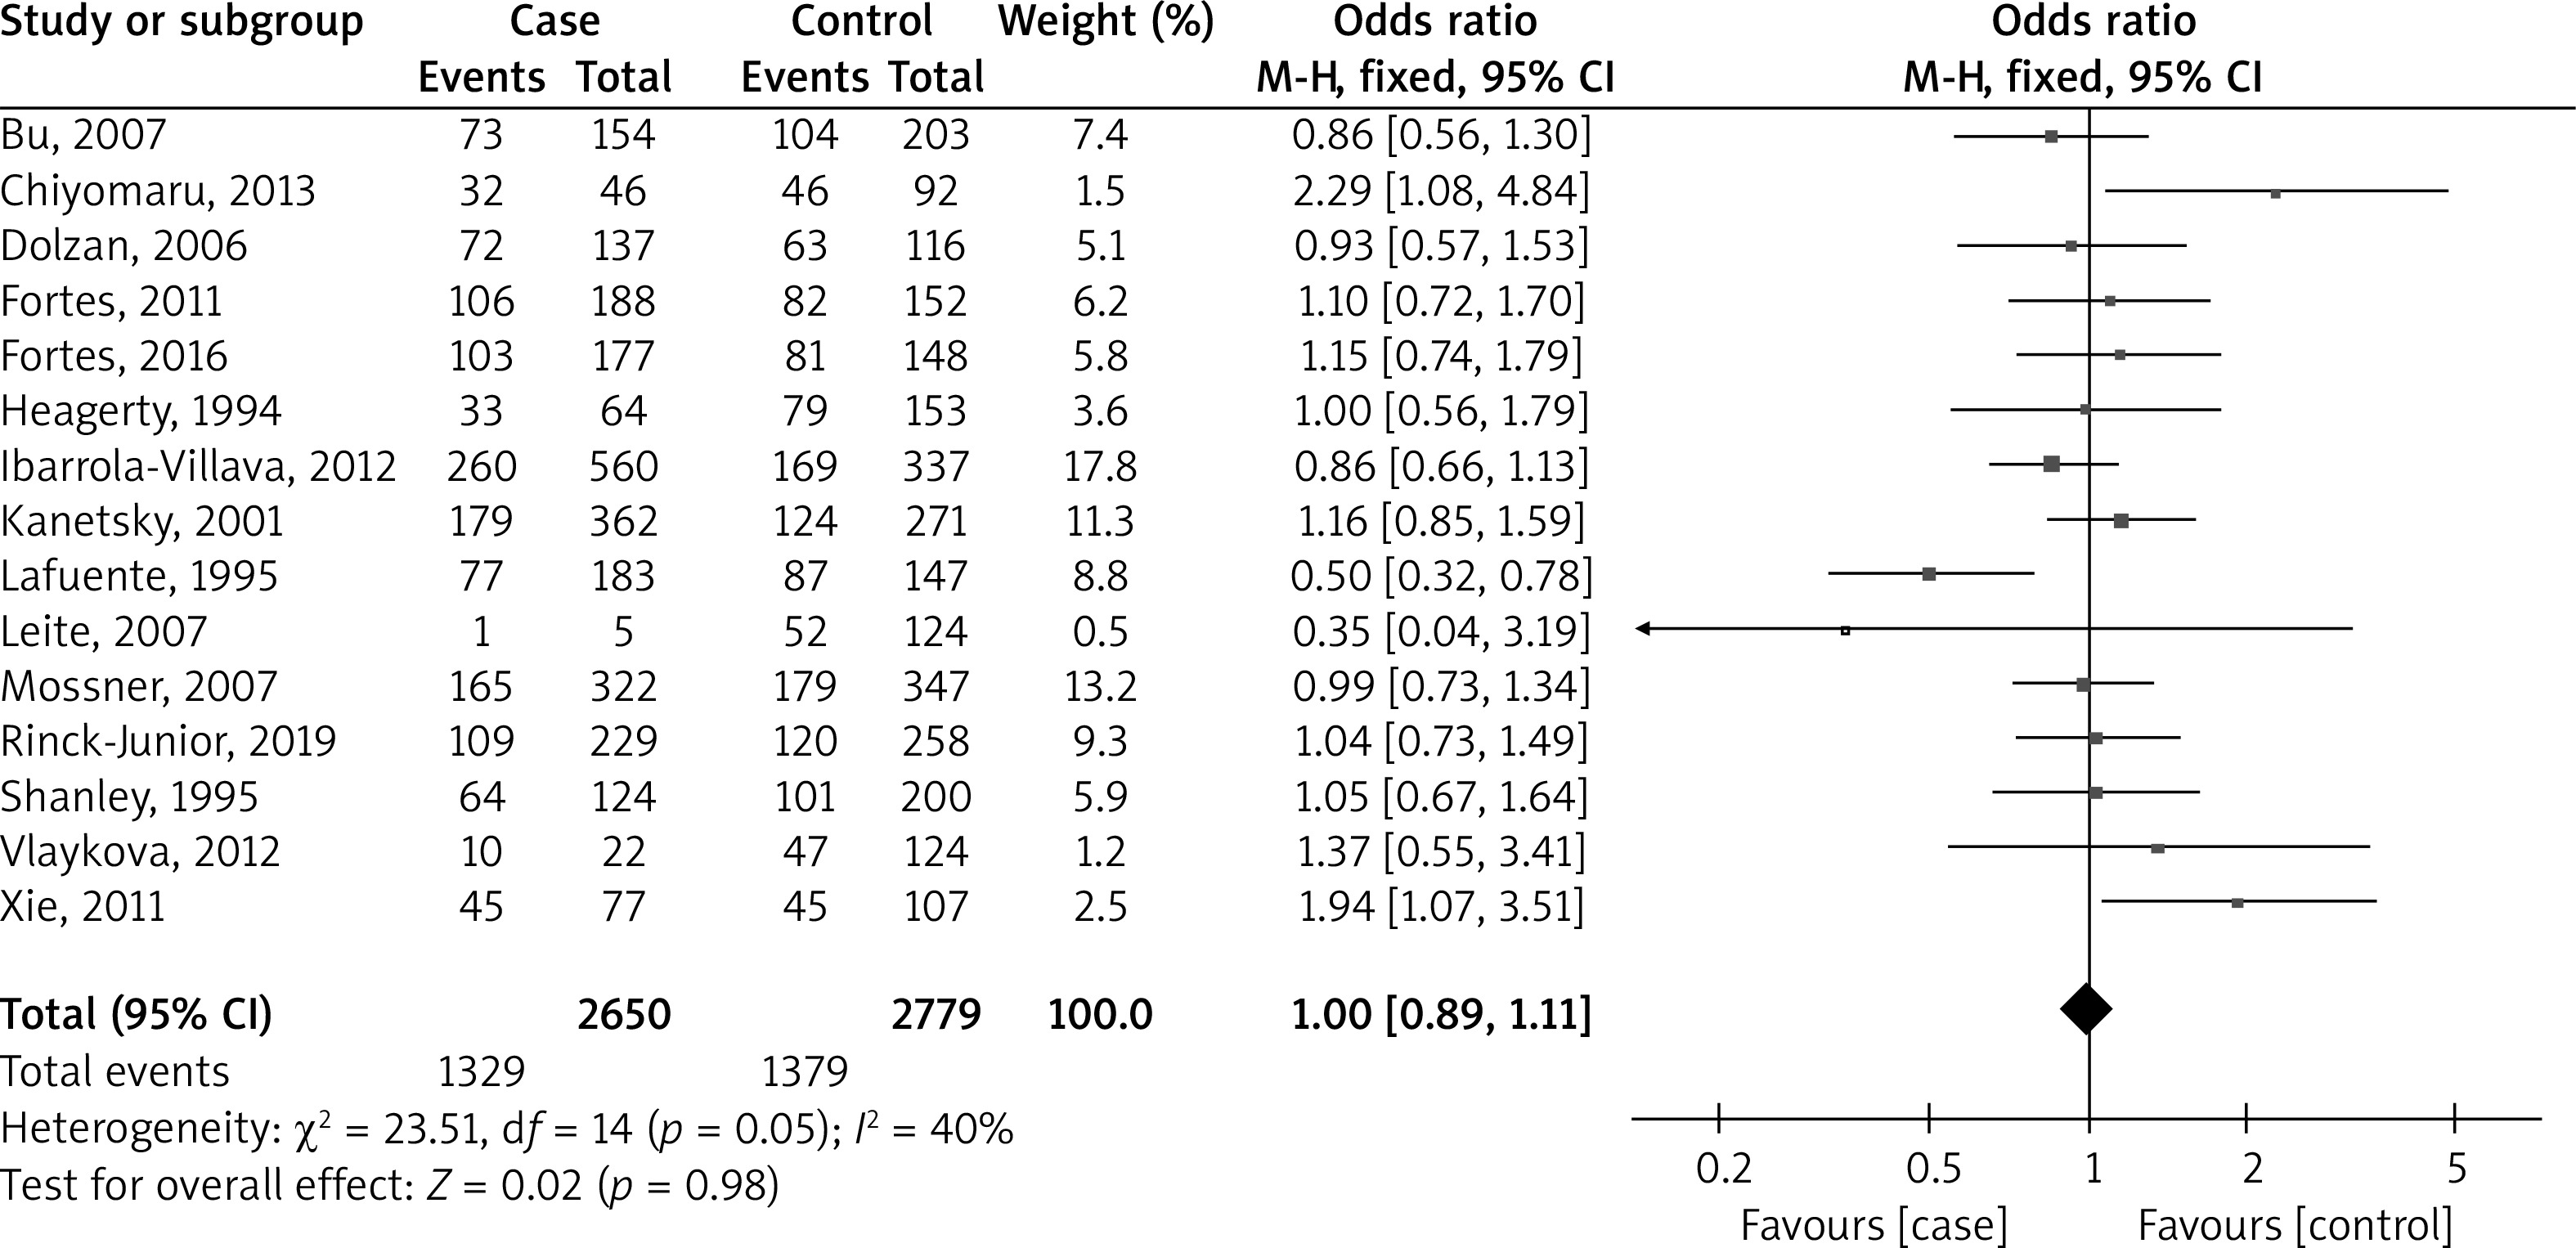
Figure 3 shows a forest plot analysis of 11 studies reporting the association of GSTT1 polymorphism with the risk of melanoma based on 2104 cases versus 2131 controls. Across all studies, there were 443 events in the case group and 453 in the control group. The overall OR was 1.07, falling within a 95% CI of 0.91 to 1.25. This outcome was not statistically significant (p = 0.41), suggesting that there was no significant difference between the two groups in all the studies. The studies’ heterogeneity was relatively low (I² = 5%), indicating that the studies were fairly consistent in their findings.
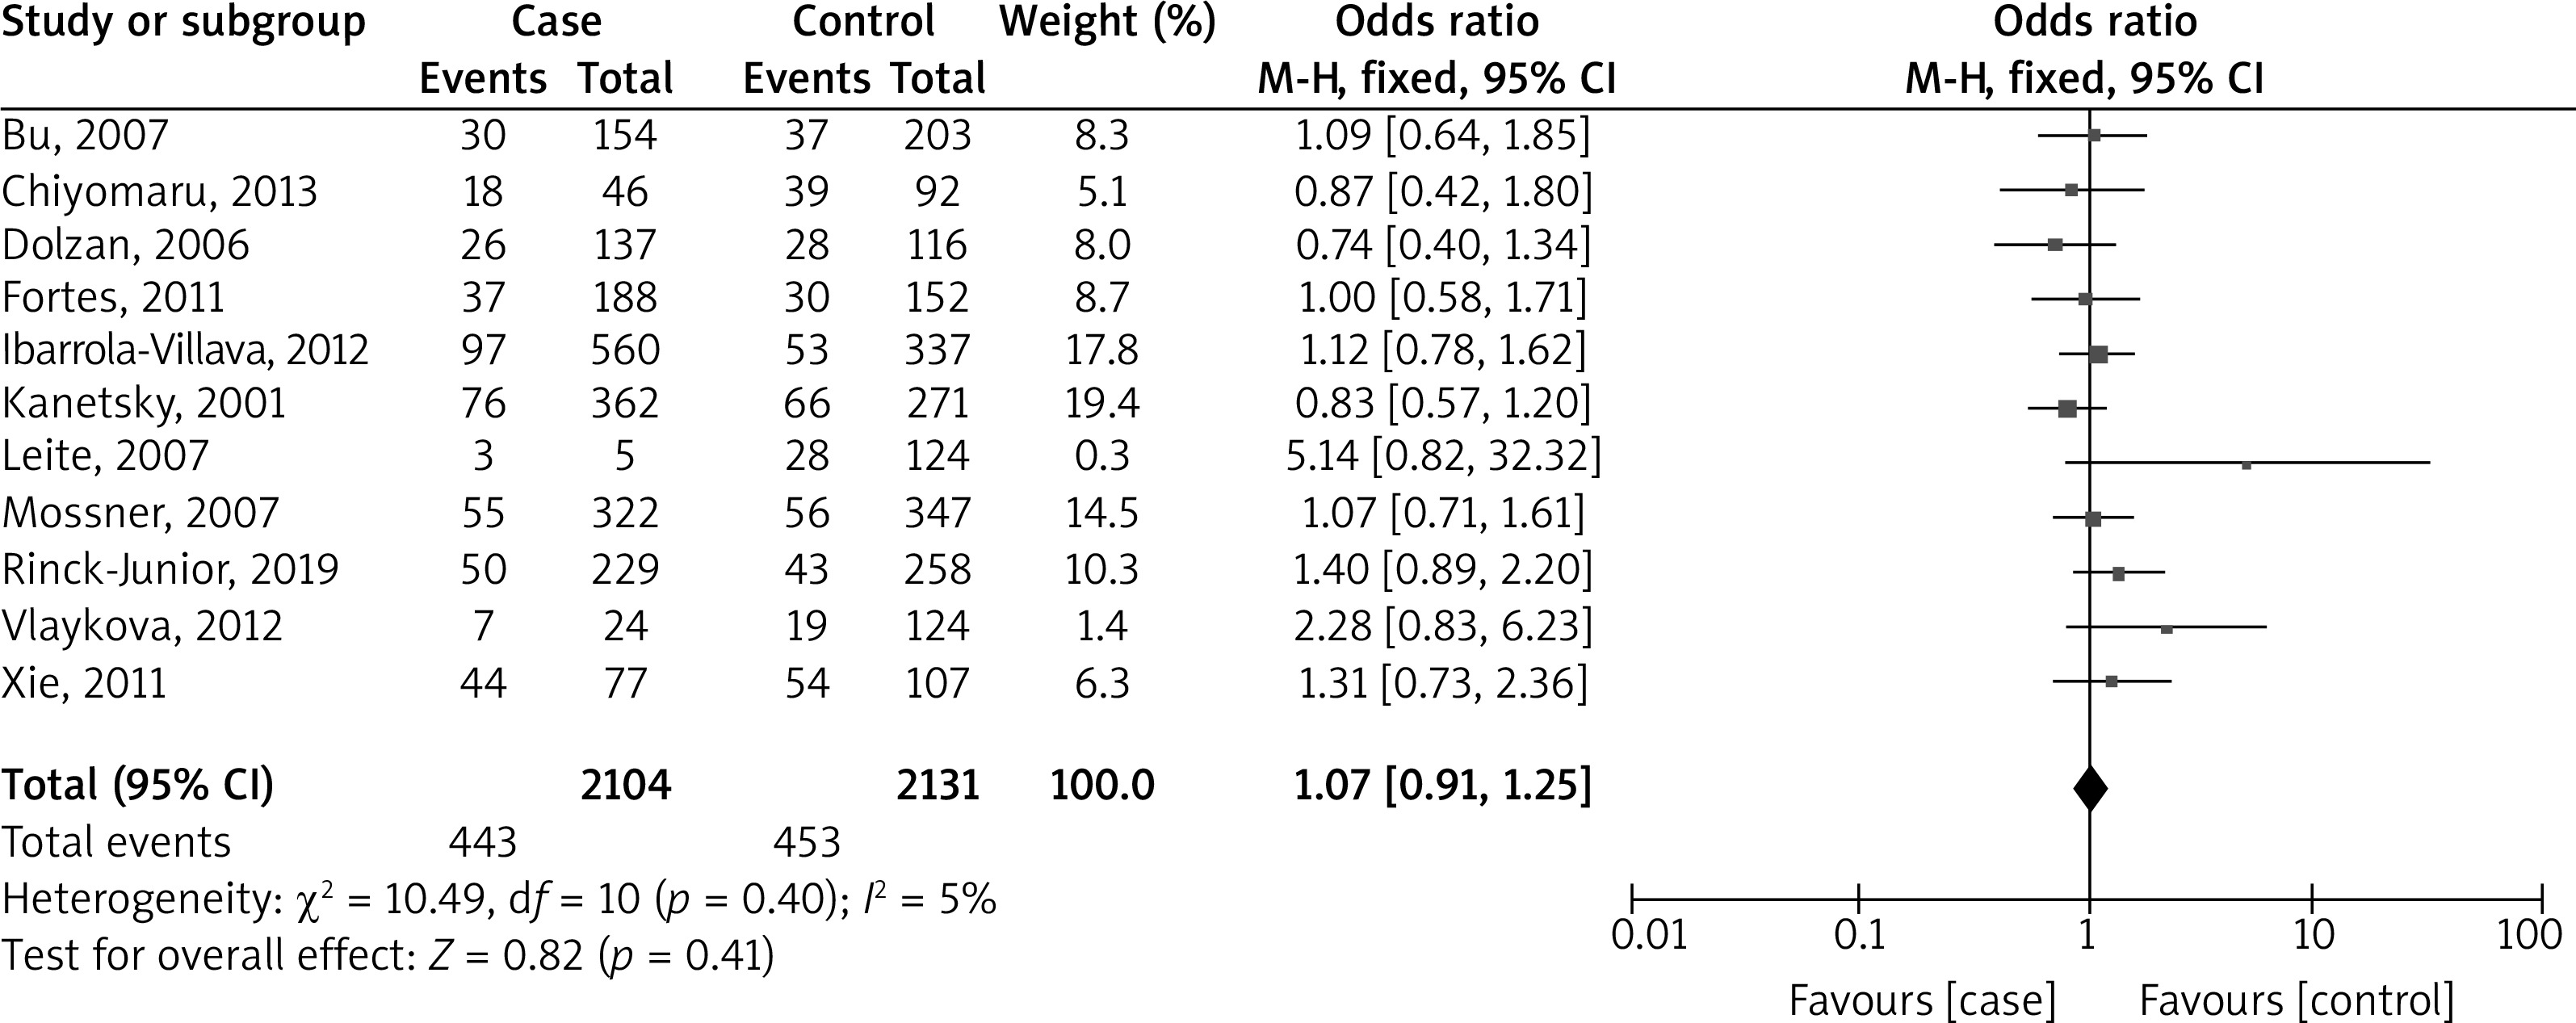
Figure 4 presents a forest plot analysis of eight studies that examine the relationship between combined GSTM1/GSTT1 polymorphisms and melanoma risk, based on 1176 cases and 1355 controls. The studies collectively reported 151 events in the case group and 143 in the control group. The overall OR was 1.25, with a 95% CI ranging from 0.97 to 1.61. This result was not statistically significant (p = 0.09), indicating no substantial difference between the two groups across all studies. The heterogeneity of the studies was low (I² = 15%), suggesting a low degree of discrepancy in the findings across different studies.
Figure 4
Forest plot analysis of the association between combined GSTM1/GSTT1 polymorphisms and the risk of melanoma
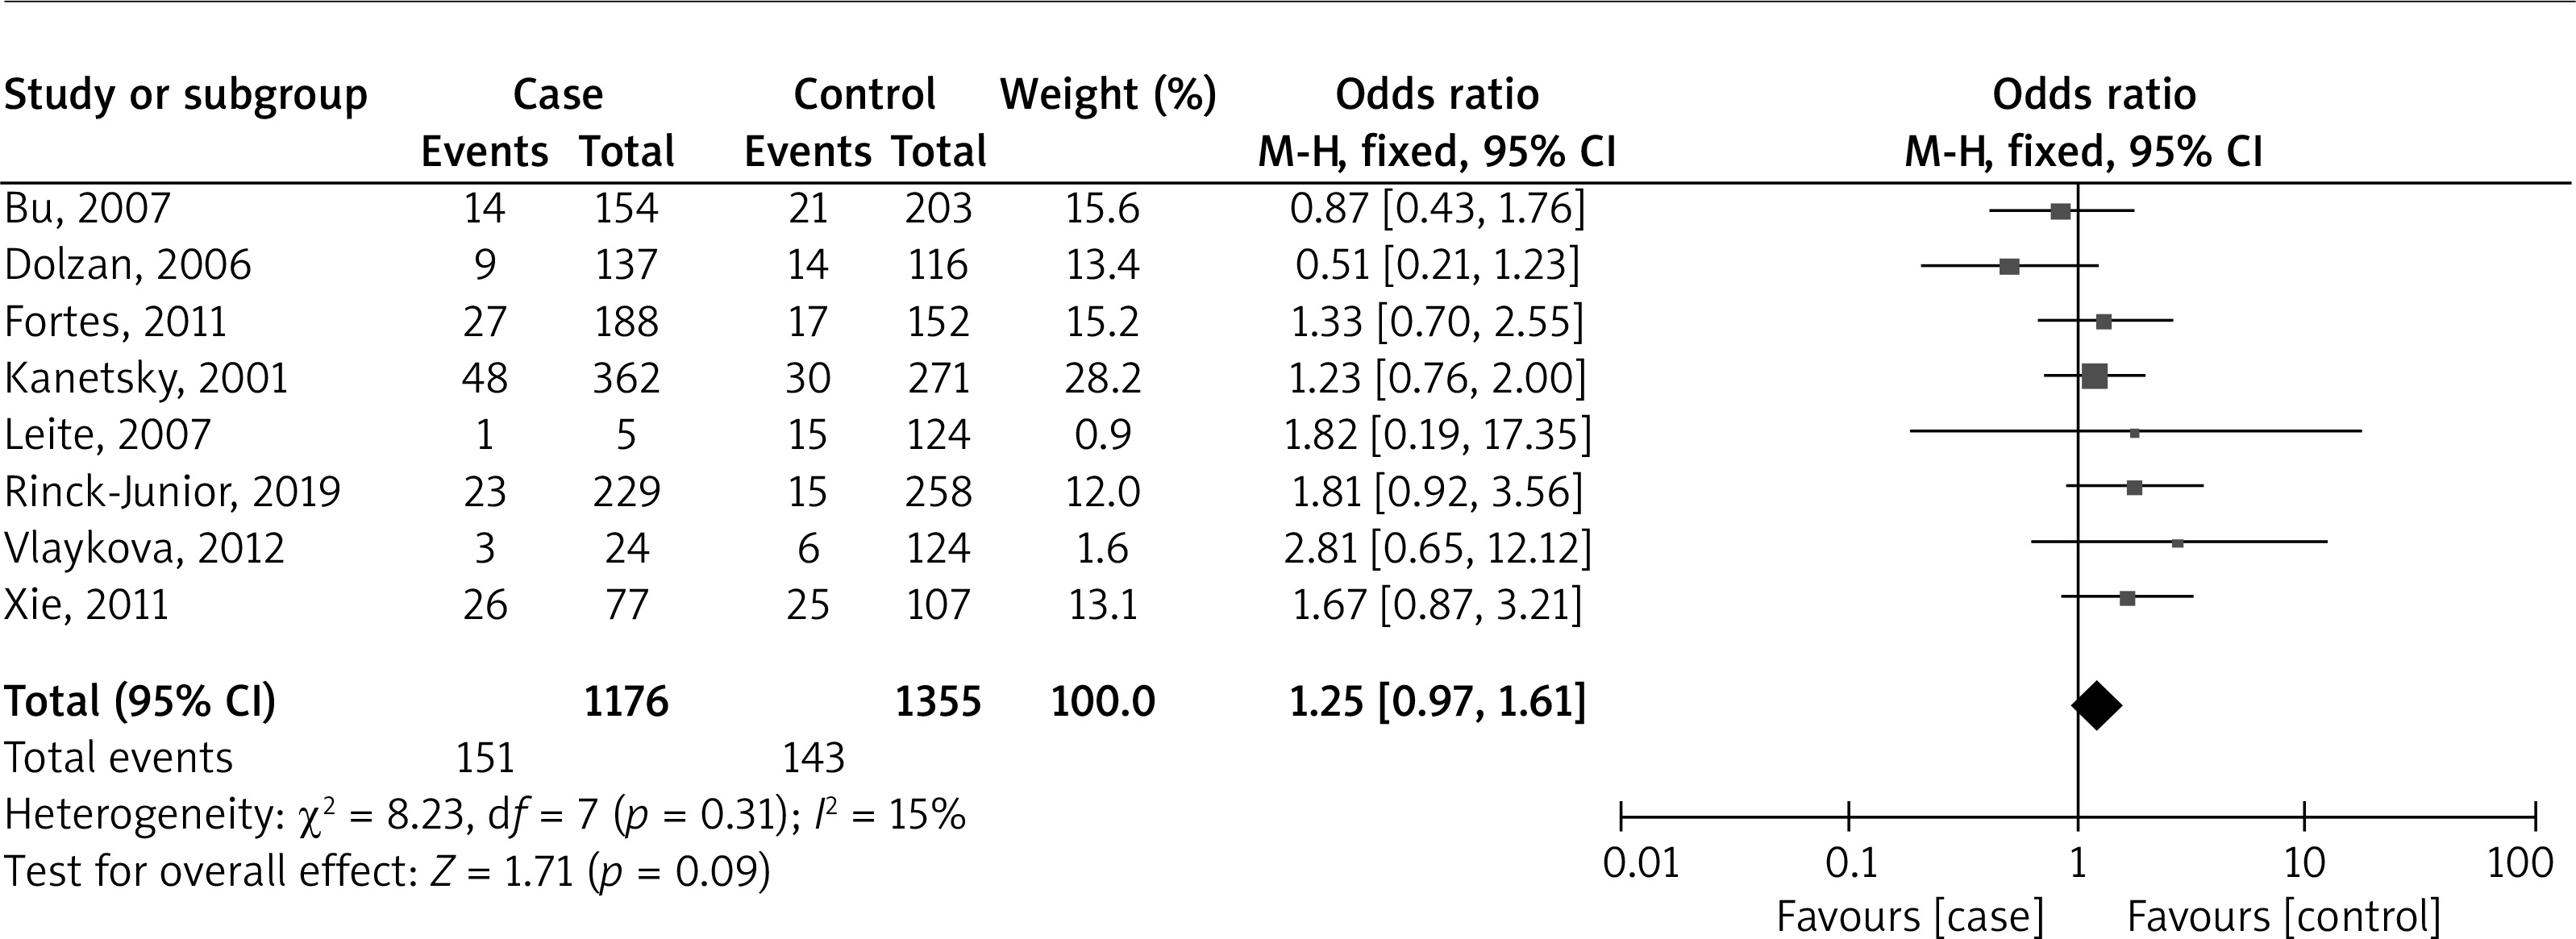
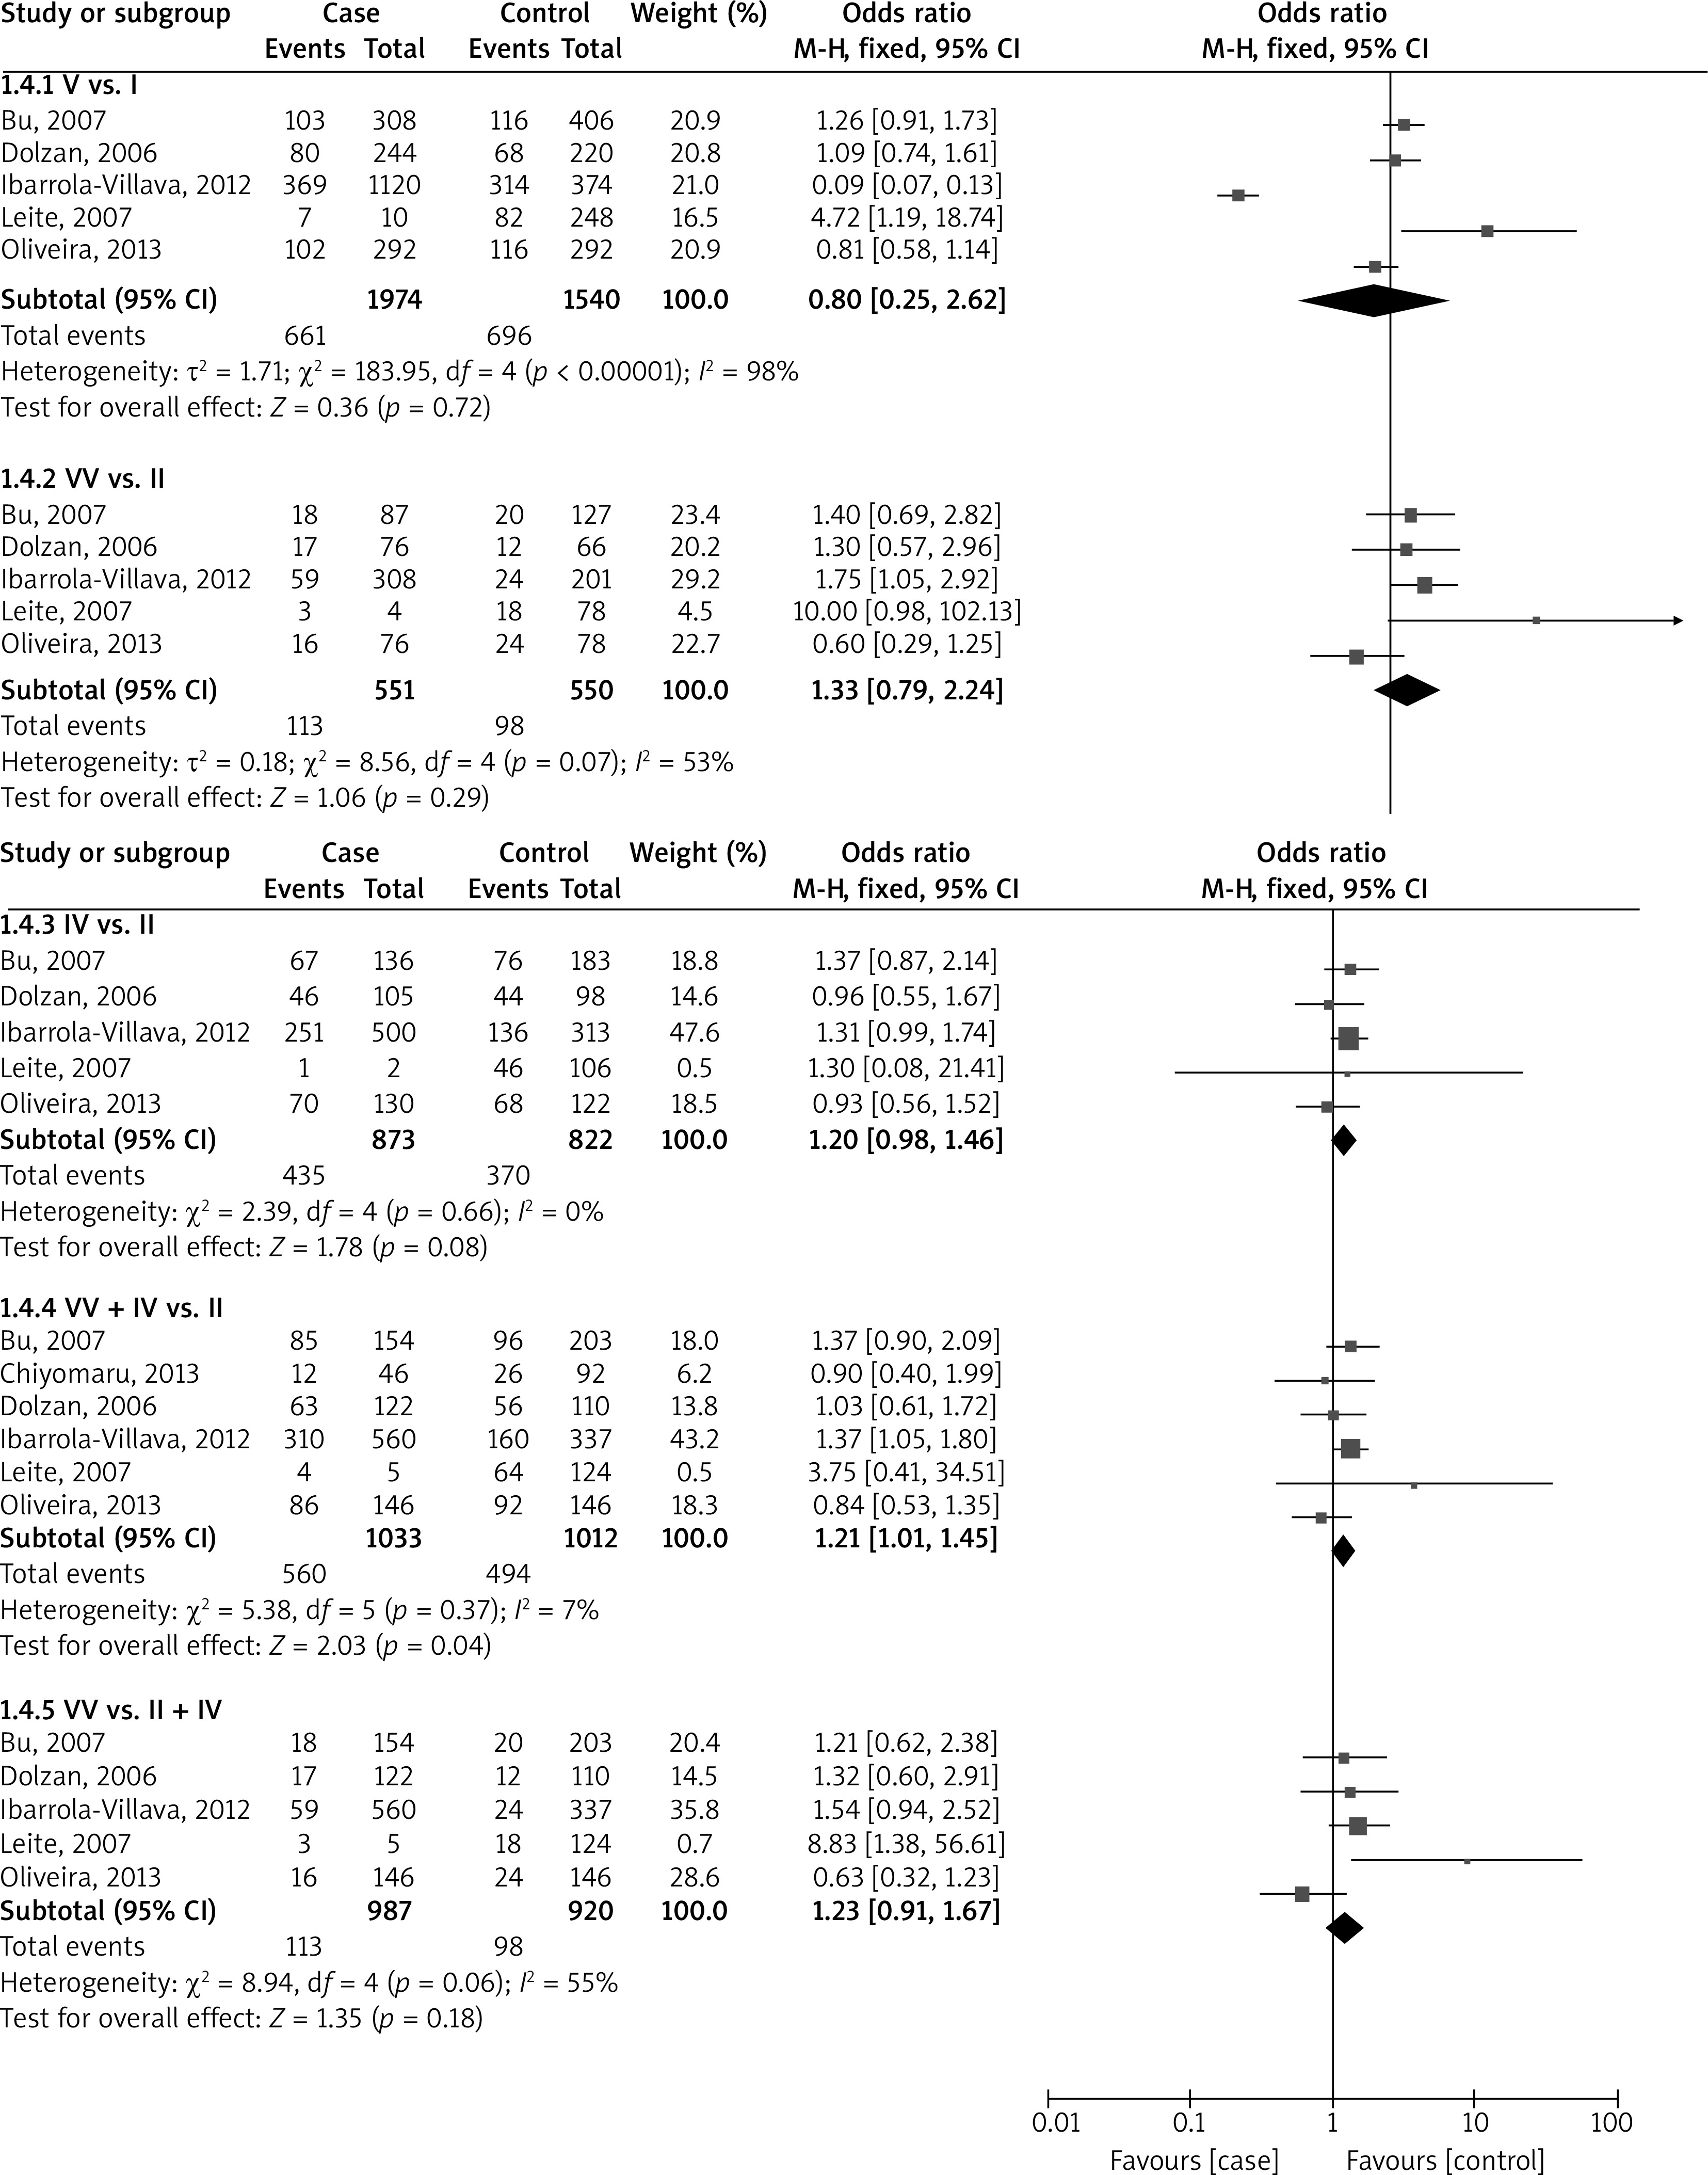
Figure 5 identifies a forest plot analysis of the association between GSTP1 Ile105Val polymorphism and the risk of melanoma based on six studies for recessive models and five for other models. The allelic model (V vs. I) and the homozygous model (VV vs. II) were analysed based on different numbers of cases and controls. In both models, the overall odds ratio (OR) and the 95% confidence intervals were calculated, but neither showed a statistically significant result (p = 0.72 and p = 0.29, respectively), indicating no significant difference between the groups in all studies. However, the level of heterogeneity, which measures the variability in results across studies, was high in the allelic model (I² = 98%) and moderate in the homozygous model (I² = 53%), suggesting varying degrees of inconsistency in the findings across different studies. In the heterozygous model (IV vs. II), the overall OR was 1.20, indicating no significant difference between the two groups (p = 0.08). The recessive model (VV + IV vs. II) showed a statistically significant OR of 1.21 (p = 0.04), suggesting a potential association between the GSTP1 polymorphism and melanoma risk. However, the dominant model (VV vs. II + IV) showed an OR of 1.23, but it was not statistically significant (p = 0.18). The heterogeneity of the studies varied from low to moderate across the models.
Subgroup analysis
Table 2 presents a detailed analysis of the association between GSTM1, GSTT1, and combined GSTM1/GSTT1 polymorphisms and the risk of melanoma. The analysis was broken down into subgroups based on ethnicity, control source, control matching, quality score, and sample size. For the GSTM1 polymorphism, in terms of ethnicity, the OR was 0.95 for Caucasians, 2.07 for Asians, and 1.01 for mixed ethnicities, with a significant association found in Asians (p = 0.002). For control sources, the OR was 0.97 for population-based and 1.04 for hospital-based studies. When considering control matching, the OR was 1.20 for age and sex matching and 0.96 for studies without matching. In terms of quality score, studies with a score of ≥ 7 had an OR of 1.10, while those with a score of < 7 had an OR of 0.97. Lastly, for sample size, studies with ≥ 200 samples had an OR of 0.95, while those with < 200 samples had an OR of 1.76, with a significant association found in the latter group (p = 0.006).
Table 2
Subgroup analysis
For the GSTT1 polymorphism, in terms of ethnicity, the OR was 1.00 for Caucasians, 1.11 for Asians, and 1.50 for mixed ethnicities, with no significant association found (p > 0.05). For control sources, the OR was 1.59 for population-based and 1.08 for hospital-based studies. When considering control matching, the OR was 0.95 for age and sex matching and 1.09 for studies without matching. In terms of quality score, studies with a score of ≥ 7 had an OR of 0.94, while those with a score of < 7 had an OR of 1.19. Lastly, for sample size, studies with ≥ 200 samples had an OR of 1.03, while those with < 200 samples had an OR of 1.33.
For the combined GSTM1/GSTT1 polymorphisms, in terms of ethnicity, the OR was 1.08 for Caucasians, 1.81 for Asians, and 1.67 for mixed ethnicities, with no significant association found (p > 0.05). For control sources, the OR was 0.59 for population-based and 1.36 for hospital-based studies, with a significant association found in hospital-based controls (p = 0.03). When considering control matching, the OR was 1.33 for age and sex matching and 1.24 for studies without matching. In terms of quality score, studies with a score of ≥ 7 had an OR of 1.25, while those with a score of < 7 had an OR of 1.25. Lastly, for sample size, studies with ≥ 200 samples had an OR of 1.15, while those with < 200 samples had an OR of 1.80, without a significant association found in the groups (p > 0.05).
Meta-regression analysis
Table 3 presents the results of a meta-regression analysis for the GSTM1, GSTT1, and combined GSTM1/GSTT1 polymorphisms. The analysis examined the relationship between the polymorphisms and various variables including publication year, sample size, and quality score. For all three polymorphisms, the coefficients for each variable were very small (less than 0.0001 to 0.0339), and none of them were statistically significant (p > 0.05). This suggested that these variables did not significantly influence the association between the polymorphisms and melanoma risk.
Table 3
Fixed meta-regression analysis
Publication bias
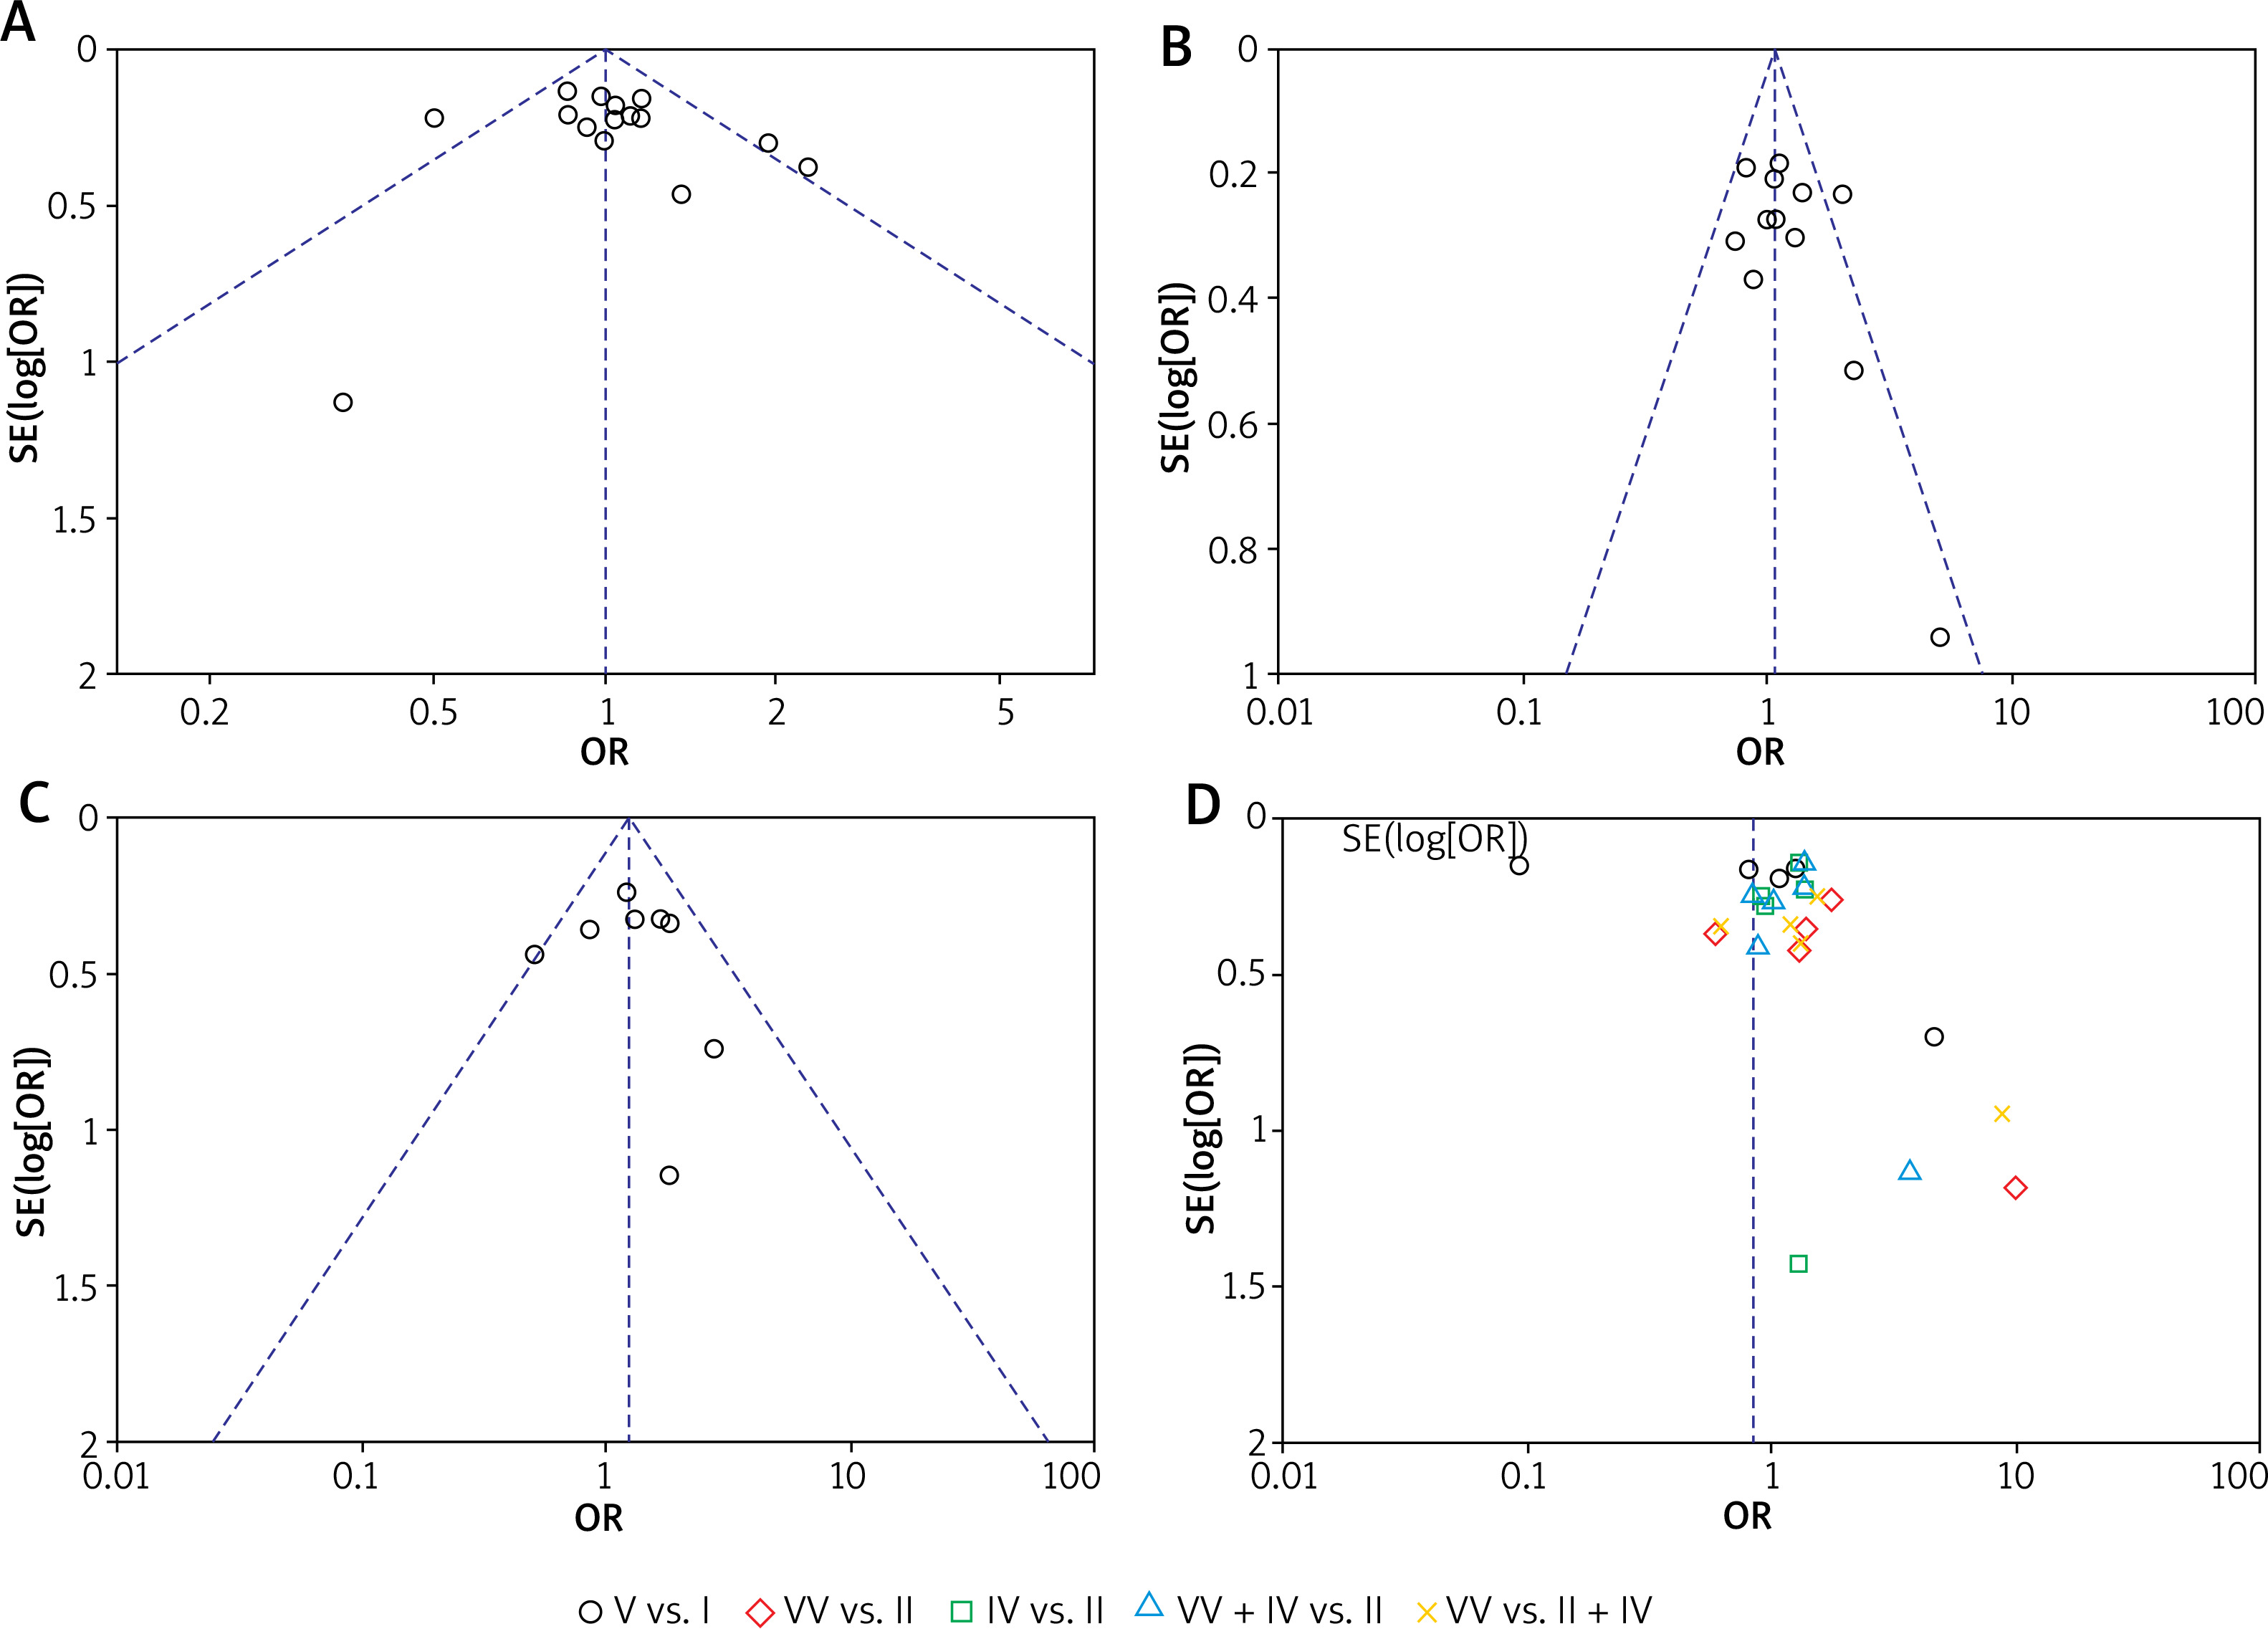
Figure 6 shows funnel plots of GSTM1, GSTT1, and combined GSTM1/GSTT1 polymorphisms. The p-values of Egger’s/Begg’s tests were 0.476/0.400, 0.094/0.311, and 0.811/0.804 for GSTM1, GSTT1, and combined GSTM1/GSTT1 polymorphisms, respectively. The p-values for both Egger’s and Begg’s tests for GSTM1 and combined GSTM1/GSTT1 polymorphisms were greater than 0.10, suggesting no significant publication bias for these polymorphisms according to these tests. However, the p-value for Egger’s test for GSTT1 was 0.094, which was less than 0.10, indicating a potential publication bias according to Egger’s test. But Begg’s test for GSTT1 gave a p-value of 0.311, which was greater than 0.10, suggesting no significant publication bias according to Begg’s test.
TSA
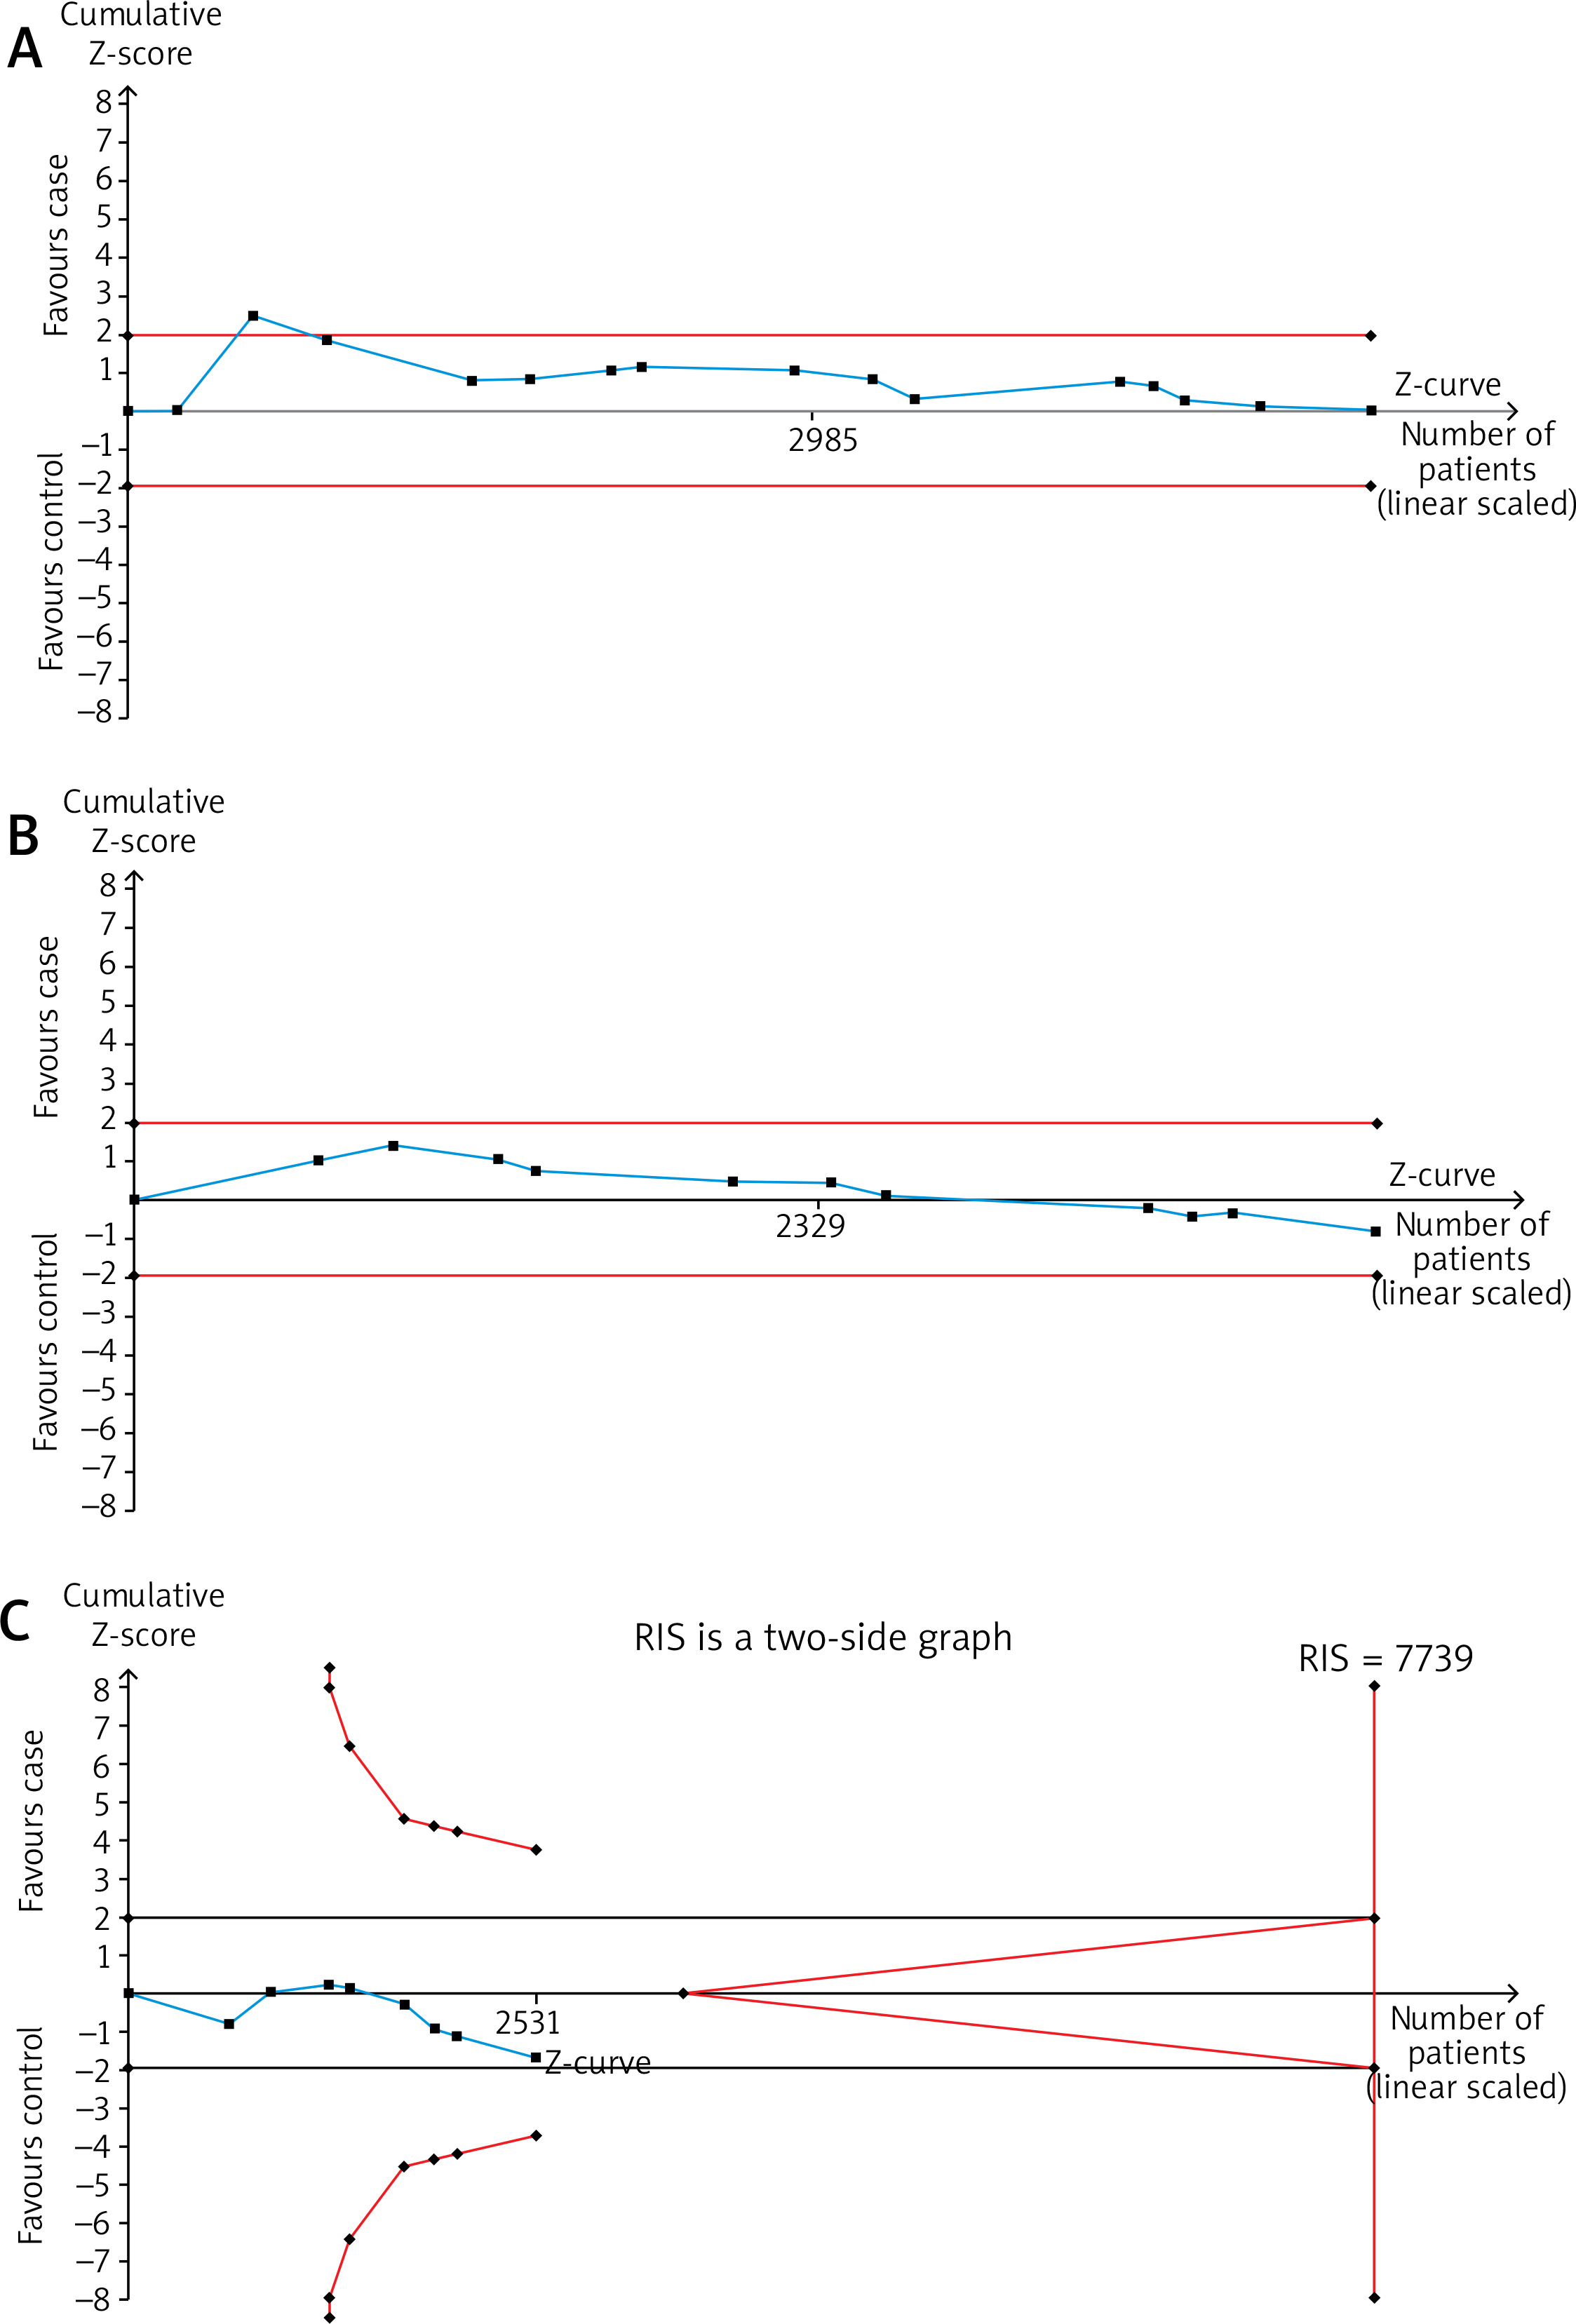
For GSTM1, GSTT1, combined GSTM1/GSTT1, and GSTP1 (not plotted TSA) polymorphism, the Z-curve did not cross the RIS line or boundary lines and did not enter the futility area, it suggested that more evidence was needed (Figure 7). The current evidence was not sufficient to confirm or reject the intervention effect, and more studies should be included in the meta-analysis. This also meant that any conclusions drawn at this point could be misleading.
Discussion
The forest plot analyses on GSTM1, GSTT1, and combined GSTM1/GSTT1 polymorphisms in relation to melanoma risk showed no statistically significant differences between the case and control groups. This was also the case for the allelic and homozygous models of GSTP1 Ile105Val polymorphism. However, the recessive model of GSTP1 Ile105Val polymorphism showed a statistically significant OR, suggesting a potential association with melanoma risk. The analysis of GSTM1, GSTT1, and combined GSTM1/GSTT1 polymorphisms in relation to melanoma risk revealed significant associations in specific subgroups. For GSTM1, a significant association was found in Asians and in studies with a sample size of less than 200. For the combined GSTM1/GSTT1 polymorphisms, a significant association was found in hospital-based controls. A meta-regression analysis showed that variables such as publication year, sample size, and quality score did not significantly influence the association between the polymorphisms and melanoma risk. Publication bias was assessed and found to be insignificant for GSTM1 and combined GSTM1/GSTT1 polymorphisms, but potential bias was indicated for GSTT1 by Egger’s test. The evidence was currently insufficient to confirm or reject the intervention effect, indicating a need for more studies.
In the human genome, GSTs are denoted by multiple genes. These genes are situated in class-specific clusters on various chromosomes and exhibit unique expression patterns in each organ [39, 40]. The primary GST genes identified as polymorphic are the ones that encode for GSTM1, GSTT1, and GSTP1 [9]. Specifically, the null genotypes of GSTT1 and GSTM1, as well as the variants of GSTP1, have been studied and found to have a positive correlation with the risk of cancer [9, 41–44]. Several studies reported a positive correlation of GST polymorphisms with the risk of melanoma [28, 35, 37] and in contrast, some studies [30, 32] reported a protective role of GST polymorphisms in melanoma patients.
The reasons for different results of association between GST polymorphisms and the risk of cancer can be due to differences in ethnicity, lifestyle factors such as smoking, study design (control selection and matching criteria), sample size, gene-gene and gene environmental interactions, pathological features of cancer [45–48]. For confirmation of this result, the present meta-analysis showed that sample size and ethnicity could have an effect on the association between GSTM1 polymorphism and the melanoma risk and control source on combined GSTM1/GSTT1 polymorphisms.
GST proteins are involved in tumour-related processes such as promoting cell survival, encouraging cell proliferation, and contributing to drug resistance [49]. Elevated levels of GST are linked to a resistance to apoptosis, which can be triggered by various substances, including chemotherapy drugs [50]. This suggests that GST may play a role in preventing MAPK signalling [50]. While GST levels decrease in metastases originating from skin or lymph nodes, they increase with the overall progression of the tumour. GST is directly implicated in the invasion of melanoma and the development of drug resistance, with GSTP1 being the most expressed isoform [51, 52]. The absence of GSTT and GSTM isozymes in a large portion of the population could potentially influence the development of melanoma by reducing oxidative stress [29]. This suggests a complex relationship between GST levels and different stages of cancer development, as well as GST polymorphisms. Therefore, more research is needed to fully understand these complex relationships and their implications for cancer treatment and prevention.
The study has several strengths. It was conducted as a comprehensive search of four databases without any restrictions, which increases the likelihood of including all relevant studies. The analysis included 32 studies, enhancing the reliability and generalizability of the findings. The study also performed a subgroup analysis based on ethnicity, control source, control matching, quality score, and sample size, allowing for a more nuanced understanding of the data. A meta-regression analysis was conducted to examine the influence of various variables on the association between the polymorphisms and melanoma risk.
However, there are also some limitations. Many of the findings were not statistically significant, indicating no substantial difference between the groups across all studies. The study also suggested potential publication bias for some polymorphisms. The evidence is currently insufficient to confirm or reject the intervention effect, indicating a need for more studies. Although the heterogeneity of the studies was relatively low, it varied from low to moderate across the models, suggesting some degree of discrepancy in the findings across different studies.
Conclusions
This comprehensive analysis of GST polymorphisms and their association with melanoma risk provides valuable insights but also highlights the need for further research. While significant associations were found in specific subgroups, many of the findings were not statistically significant, indicating no substantial difference between the groups across all studies. These findings have important clinical implications as they enhance our understanding of the genetic factors influencing melanoma risk and could potentially guide the development of personalized treatment strategies. Looking ahead, it would be beneficial to conduct more studies to confirm these findings and explore the potential therapeutic implications of GST polymorphisms. Furthermore, future research should also consider gene-gene and gene-environment interactions, which could offer a more comprehensive understanding of the complex biology of melanoma.