Introduction
There has been significant research dedicated to examining deaths that occur within the emergency department (ED) and shortly after admission, aiming to determine the incidence and better understand the contributing factors. As the frequency of advanced diseases becomes more common, there is a corresponding rise in ED visits for individuals with chronic illnesses. For example, in the period 2016–2019 in Korea, only 10% of deaths that occurred in the ED were attributed to injuries, while a staggering 90% of the deaths were linked to various diseases, and more than half of elderly patients who passed away in the ED had significant chronic illnesses [1]. Drawing from yet another extensive cohort of over a hundred million ED patients, the study’s authors reached the conclusion that there is a need to identify patients for whom end-of-life care is either necessary or preferred, and to ensure they are equipped to receive this care at an excellent standard (highlighting older patients who are more likely to be White, male, not Hispanic, and possess a higher Charlson Comorbidity Index) [2].
It seems that selecting patient groups at higher risk of fatal events in the ED and shortly after admission, as well as their prevention, may not require gathering such an enormous amount of statistical data. Greater precision in identification and the adaptation of appropriate preventive measures can certainly be achieved on a smaller research scale. Based on the analysis of routinely conducted blood tests in ED patients, in the present epidemiological study, we identify the basic clinical warning signs of early death of deteriorating patients in most common non-traumatic and non-infectious diseases.
Material and methods
We carried out a retrospective single-centre study spanning 2016–2019 using medical electronic records from the ED at the public Multi-Specialistic Hospital in Gorzów Wielkopolski, Poland. This 1000-bed hospital records approximately 1200 admissions to the ED each month, following the International Statistical Classification of Diseases and Related Health Problems 10th Revision (ICD10) codes.
We aimed to investigate the top (most frequent) diagnoses according to the ICD10 and 1- and 31-day mortality rates of patients after an ED contact. Because the causes of traumatic events are generally known (and their effects are visible) and pathogens of infectious diseases in the ED are usually recognizable (and there is no need to search for the causes of poor health in the blood), in this study, we undertook an epidemiological analysis of chronic diseases. In the statistical analysis, only the history of unique patients after their initial ED visit during follow-up was taken into account.
The study included subjects aged 18 years and older. This exclusion was made due to the inherent differences between pediatric and adult presentations and outcomes, as well as the low probability of younger patients developing chronic diseases. Traditionally, we decided to determine a chronic disease that appears after long lasting conditions with persistent effects.
During the study period of 2016–2019, a total of 10,257 unique patients presented to the mentioned ED, with the largest 4 groups being patients with circulatory (7264 = 49%, with 702 deaths during the first month of observation), respiratory (1286 = 9%, 120 deaths), neoplasm (1069 = 7%, 150 deaths), and endocrine (638 = 4%, 44 deaths) conditions. Because in the group of patients with respiratory system complaints, a total of 964 (= 75%) acute cases were recorded, diagnosed as acute upper respiratory infections, influenza and pneumonia, or other acute lower respiratory infections (J00–J22), we excluded the entire chapter of respiratory diseases from further statistical analysis and aimed to include (10,257 – 1286 = 8971) unique patients developing chronic diseases with well- documented, unequivocal clinical diagnoses.
In turn, the mortality day was defined as death since admission in the ED. Death registration was available only by date and not by time of day, and the cause of death was obtained from a nation-wide registry by record linkage from electronic administrative databases.
This study was carried out in accordance with the Declaration of Helsinki and was approved by the Bioethical Committee (BC) of the District Medical Council in Zielona Góra, Poland (ref. 25/107/2018). Because the current study was retrospective and the subjects were de-identified, the BC waived the need for written consent.
Two-way analysis of variance (ANOVA) was employed to concurrently assess the impact of 2 distinct grouping variables (alive or deceased patients) on a continuous outcome variable, which included age and 37 blood tests: white blood cells, red blood cells, haemoglobin, haematocrit, mean corpuscular volume, mean corpuscular haemoglobin, mean corpuscular haemoglobin concentration, red cell distribution width-coefficient of variation, red cell distribution width-standard deviation, platelet count, mean platelet volume, neutrophils, lymphocytes, monocytes, eosinophils, basophils, percentage of lymphocytes, percentage of eosinophils, percentage of basophils, immature granulocytes, percentage of immature granulocytes, c-reactive protein, procalcitonin, activated partial thromboplastin time, prothrombin time ratio, fibrinogen, international normalized ratio, prothrombin time, creatine kinase-mb, d-dimers, brain natriuretic peptide, troponin I, alanine aminotransferase, aspartate aminotransferase, total bilirubin, lactate dehydrogenase, and total protein, across 3 independent groups of ED (cardiological, oncological, and endocrine) patients.
Generally, in the concept of ANOVA, comparing the 2 variance estimates (within-group variance, also known as residual variance, and between-group variance) allows the assessment of the significance of the differences between group means (the method is referred to as ‘analysis of variance’, even though its primary objective is to compare group means). It is crucial to emphasize that a lower ratio (F-statistic < 1) indicates that there are no significant differences between the means of the compared samples. On the other hand, a higher ratio (F > 1) implies that the variation among group means is significantly larger than the variation among individual observations within each group.
The blood markers identified in the ANOVA test, which most effectively stratified ED patients in terms of survival and mortality, as well as the analysed chronic disease ICD10 chapters, were subsequently used to construct their early dying clinical profiles adopting cluster analysis, specifically the so-called Wrocław taxonomy by Marczewski-Steinhaus (MS) [3].
We employed a taxonomic MS method instead of a general linear modelling approach to identify regression coefficients. This straightforward approach suggests a symmetric metric between objects, where the taxonomic distance (D) between objects (A, B) is defined as follows: D = |A–B|/max(A, B), where the numerator is the absolute difference between A and B, and the denominator is the maximum of A and B. In its most general form, this statistical method aims to determine relatively heterogeneous clusters of patients among themselves and ensure homogeneity within these clusters. This involves maximizing between-group variance while minimizing within-group variability. Due to the sensitivity of the taxonomic metric to outliers and data scaling considerations (minimum-maximum feature scaling), selected risk factors were logarithmically transformed beforehand to stabilize variance.
To establish clinical profiles for early deceased patients based on the identified risk factors, a diagrammatic dendrogram was employed to visually represent the hierarchical clustering. This dendrogram illustrates the arrangement of clusters of deceased patients, generated by the taxonomic distances between them.
We conducted patient segregation using complete linkage, and we determined the threshold value for distance, which was used to trim clusters, based on the screen plot (not required to present) [4]. In our case, the dendrogram was built in the ‘cluster’ package [5] of the R statistical platform [6].
From the taxonomic dendrograms based on selected risk factors, we established clinical profiles of patients and provided their statistical descriptions. We ran between-group comparisons using one-way ANOVA.
Results
Through statistical analysis (two-way ANOVA), we determined that among all the 37 blood tests analysed, the best segregating biomarkers for early death in ED patients suffering from cardiovascular, endocrine, and oncological diseases were haemoglobin (Hb), haematocrit (Hct), and C-reactive protein (CRP), see Table 1 for details (due to a strong linear correlation between Hb and Hct, which stands at r = 0.97, and their strong morphological associations, we have excluded Hct from further clinical considerations in this study).
Table 1
Two-way ANOVA comparing haemoglobin and C-reactive protein means in status and diagnosis of patients as well as their statistical effects
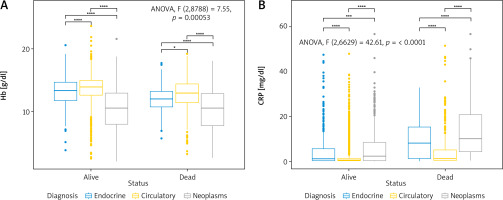
Based on the ANOVA results reported above in Table 1, it is evident that there was a statistically significant difference (F > 1 and p < 0.05) between surviving and deceased patients, chronic diseases, as well as the interaction between status and diagnosis. Interpreting these results in the simplest terms, we can say that the analysed groups non-randomly differentiate patients in terms of the tested blood measurements, namely Hb and CRP. Such a clear effect of the examined groups on concentration was not observed in the case of the other 34 blood tests (excluding Hct). For the analysed grouped data, graphical presentations of the conducted ANOVA are shown in boxplots with significance bars (using a Bonferroni adjustment) in Figures 1 A, B.
Fig. 1
Boxplots with significance bars of the two-way ANOVA comparing haemoglobin (A) and C-reactive protein (B) concentration means in status and diagnosis of patients with interaction statistics

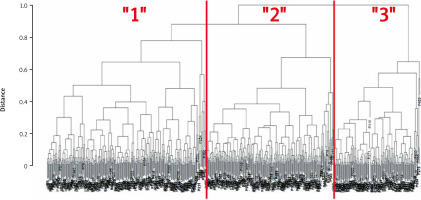
A classification dendrogram of taxonomical distances based on the logarithmically transformed and scaled variables, i.e., time to death, Hb and CRP between the fully depicted 705 deceased ED patients, is presented in Figure 2.
Fig. 2
Classification dendrogram of taxonomical distances based on the logarithmically transformed and scaled variables, i.e. time to death, haemoglobin, and C-reactive protein between the deceased emergency department patients (N = 705)

The dendrogram depicted in Figure 2 can be described as follows: individual patients (indicated by “P” numbers) from top to bottom are hierarchically grouped into separate branches, each represented by distinct leaves on the dendrogram. Consequently, the created classification tree identifies 3 primary clusters labelled as “1”, “2”, and “3” for deceased ED patients. Descriptive statistics for the established clusters of patients were conducted using one-way non-parametric and parametric ANOVA (Table 2).
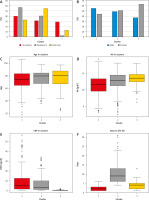
From the results collected in Table 2, one can observe statistical differences (p < 0.05) in the numbers and means of all the analysed clinical characteristics. In the first cluster (“1”), a relatively large number of patients had oncological diseases – nearly 3 out of 5 (< 60%) with an oncological diagnosis. Additionally, 1 in 3 endocrine patients “joined” this group (= 33%), and those with cardiovascular diagnoses represented this cluster as 2 out of 5 patients (40%). In this group, predominantly, men passed away shortly after their ED admission, but they were the youngest on average (73 years), had the most advanced anaemia (at a Hb level of 11.4 g/dl), elevated CRP levels (9.24 mg/dl), and most importantly, among all deceased ED patients, they had the shortest survival time – on average just 2 days from admission. The interpretation of the remaining results from the taxonomic analysis reported in Table 2 is analogous, and a more comprehensive visualization of them is presented in bar and boxplots, arranged in a combined layout in Figures 3 A–F.
Table 2
One-way ANOVA comparing the numbers of non-survivors, their sex, means of age, haemoglobin, C-reactive protein, and days until death between taxonomical clusters with the p-values of a statistical effect
Discussion
While reviewing the latest literature, one gets the impression that advanced statistics, considering the subject undertaken in this study, is making significant strides in medical research. This can be attributed to the wide range of computational methods available, enabling modern exploration of clinical and epidemiological cause-and-effect relationships. This viewpoint is supported, for example, by the Shapley additive explanation, which models the most important features for sepsis in children during ED triage [7], as well as by the multi-test evaluation of differences in the National Early Warning Score used in the ED and multi-stage combinations of logistic regression models, linear regression, and survival analysis to predict disease severity and 3-month survival in acutely dyspnoeic patients [8], or the pooled relative risk estimated by random effects of generalized least square regression models and the dose- response relationship (between CRP and risk of all cause and cause-specific mortality) modelled using restricted cubic splines in the meta-analysis of 22 screened articles (with advanced Begg’s funnel plots) [9]. Therefore, the data exploration conducted in our study using a package of less conventional statistical methods should not come as a surprise.
Based on the combination of statistical methods used (ANOVA and taxonomy), we determined that Hb (excluding Hct from the statistical analysis due to its high correlation with Hb) and CRP, among many other tests performed in the ED, are statistically significant predictors (p < 0.05) of early patient deaths in 3 major chapters of chronic diseases (according to ICD10). Furthermore, we have shown that both of these blood tests classify neoplastic patients as the most early non-survivors in the ED (Fig. 3 F, Table 2). In the next paragraph, we will discuss why the statistical analysis led us to these clinical and epidemiological results.
Given that anaemia is a frequent and potentially harmful complication in cancer patients, which adversely affects life expectancy [10–12], our results are in line with most reports on the concentration of Hb in the cluster “1” with a predominance of cancer patients (Figs. 3 A, D, F, Table 2). Together with Hb, interestingly, the joint effect of CRP was observed in cancer-related early mortality (Fig. 3 E, Table 2). Association between inflammatory biomarkers such as CRP and cancer- related mortality are reported by many authors [13–15]. From our results, it can be concluded that among non-survivors, cancer patients are predominantly the least promising in terms of prognosis, meaning they are the most likely to die (on average, within 24 hours of admission to the emergency department). This raises the question of whether they should be provided with appropriate palliative care earlier, rather than being admitted in such a critical condition to the ED. One of the more interesting observations, made using the applied statistical methodology, is the youngest age of oncology patients who are dying in the ED and a slight predominance in the male population (Figs. 3 B, C, Table 2). This confirms the suggestion of the advanced stage of their disease and the need for earlier palliative medical care. Nevertheless, among the 37 routinely tested ED biomarkers (listed in Material and methods), from a clinical perspective, Hb and CRP are the most suitable for indicating the oncological group and potential early mortality in these patients. Furthermore, they provide age, population, and most importantly, time to death divisions. All these results can serve as a source of ‘operational’ knowledge about cancer patients in the context of early, appropriate therapeutic intervention. Due to the established purpose of our study, we do not discuss the results related to endocrine and circulatory diseases (predominantly represented by the patients grouped in clusters “2” and “3”, respectively, which can be interpreted analogously to cluster “1” [mainly cancer] patients).
Conclusions
Among routinely tested ED biomarkers, Hb and CRP levels are efficient at identifying neoplasms as the most common early mortality of chronic diseases in ED patients. Among non-survivors, cancer patients are the most likely to die, on average, within 24 hours after ED admission. There are valid reasons to assume that there is a lack of proper early therapy (including palliative care) for oncology patients admitted to the emergency department.


