


Introduction
Hepatocellular carcinoma (HCC) is the fifth most common cancer and the second leading cause of cancer-related death worldwide [1–3]. The risk factors associated with the initiation and progression of HCC include viral infection [4–7], alcohol abuse [8], aflatoxin-contaminated foods [9], and immune system imbalances [10]. The overall 5-year survival rate for patients with HCC is less than 10% [11]. To improve patient outcomes, typical combination treatments, such as surgery, radiotherapy, transarterial chemoembolization, targeted therapy, and immunotherapy, have been investigated. Currently, surgical resection can only be performed in patients with early- stage HCC. The comprehensive treatment modality is rapidly becoming a standard treatment for liver cancer, which has been effective, but results remain unsatisfactory. Understanding the mechanisms and prognostic biomarkers of effective antitumour responses is essential for developing novel immunotherapeutic and targeted agents.
Kinetochore-localized astrin/sperm-associated antigen 5 binding protein (KNSTRN/SPAG5), a basic component of cell progression, plays an important role in cell division [12, 13]. Although most studies have focused on the association between KNSTRN and mitosis [14, 15], there are also some reports on the relationship between KNSTRN and tumourigenesis; however, it remains rarely studied [16, 17]. The oncogene, KNSTRN, appears to be mutated upon exposure to ultraviolet light [17]. Mutations of KNSTRN can interfere with chromatid cohesion, increase aneuploidy in tumours, and enhance tumourigenesis [17, 18]. Because few studies have been conducted on KNSTRN in cancer, we performed comprehensive and integrated bioinformatics analysis to determine its biological functions and potential mechanisms in HCC. Tumour immunotherapy, DNA methylation, and nuclear-activating miRNA (NamiRNA) regulatory networks are new directions in tumour gene therapy and are widely used to study the mechanism of liver hepatocellular carcinoma (LIHC). A recent study showed that KNSTRN expression was correlated with diverse immune infiltration levels in lung adenocarcinoma (LUAD) [19]. Therefore, it is possible that aberrant KNSTRN expression is related to immune escape and cancer development. In particular, the concept of NamiRNAs has been proposed in recent years, with encouraging results [20–22]. However, the NamiRNA-enhancer-target gene activation network requires further attention.
Therefore, we comprehensively evaluated the association between KNSTRN expression and the prognosis of patients with LIHC using The Cancer Genome Atlas (TCGA) database. We investigated the correlation between KNSTRN expression and immune cell infiltration, immune cell biomarkers, and immune checkpoints in HCC. Finally, the NamiRNA-associated regulation of KNSTRN was explored, which would undoubtedly facilitate the identification of the underlying mechanisms and the development of new therapeutic methods for HCC. Collectively, our findings reveal the potential role of KNSTRN in patients with HCC and provide a clear understanding of the mechanisms underlying the association between KNSTRN and tumour immunity.
Material and methods
Data source
Messenger RNA (mRNA) expression data (including 374 HCC and 50 adjacent non-tumour tissues) and clinical information were downloaded from the TCGA database (http://cancergenome.nih.gov). Samples with RNA-seq data or missing related clinical data were excluded from the analysis.
Survival analysis
To investigate the prognostic relevance of differential gene and NamiRNA expression, overall survival (OS) and progression-free interval (PFI) analyses were performed. We used the “survival” (v3.2–10) R package for statistical analysis of survival data and the “survminer” (v0.4.9) R package for visualization to conduct survival analysis. Forest plots were generated using the “ggplot2” (v3.3.3) R package. Meanwhile, we also used the “ggplot2” (v3.3.3) (visualization) and the “pROC” (v1.17.0.1) (statistical analysis) R packages to investigate the predictive value of KNSTRN expression levels in HCC diagnosis. Statistical significance was set at a p-value < 0.05 for the log-rank test.
Analysis of the DNA methylation status of the CpG islands of KNSTRN
MethSurv (https://biit.cs.ut.ee/methsurv/) is a website that performs survival analyses based on DNA methylation biomarkers using the TCGA data. KNSTRN DNA methylation at CpG sites and the prognostic value of these CpG sites in HCC were analysed using MethSurv.
Functional enrichment and protein-protein interaction network analysis
The LinkedOmics database (http://www.linkedomics.org/login.php) is a web-based platform that provides comprehensive multi-omics data analysis tools for the TCGA database [23]. The Pearson correlation coefficient was calculated, and a volcano map of KNSTRN-related genes was plotted using the LinkedOmics website.
Hepatocellular carcinoma C patients from the TCGA dataset were divided into 2 groups (KNSTRNlow and KNSTRNhigh) according to the median values of KNSTRN mRNA expression from the RNAseq data. The “DESeq2” (v1.36.0) and “edgeR” (v3.38.2) packages in R 4.2.1 were used to screen differentially expressed genes (DEGs) between the KNSTRNlow and KNSTRNhigh groups of patients with HCC and plot a volcano map. The “ggplot2” (v3.3.6) and “VennDiagram” (v1.7.3) packages in R 4.2.1 were applied to draw Venn diagrams to determine the overlapping genes between DEGs and KNSTRN-related genes for further enrichment analysis. The “ClusterProfiler” (v3.14.3) R package was employed to analyse the gene ontology (GO) functions and Kyoto Encyclopedia of Genes and Genomes (KEGG) pathway enrichment of the overlapping genes. Immediately afterward, the “ggplot2” (v3.3.3) R package was used to visualize the above analysis data.
Protein-protein interaction (PPI) network analysis was performed using the STRING database. STRING (www.string-db.org) is an online analysis platform that includes all the publicly available PPI data [24].
Analysis of immune characteristics
Single-sample Gene Set Enrichment Analysis (ssGSEA) was performed using the “GSVA” (v1.34.0) R package [25, 26] to analyse infiltration by 24 immune cells, including neutrophils, cytotoxic cells, dendritic cells (DCs), CD8+ T-cells, plasmacytoid DC (pDC), natural killer (NK) cells, mast cells, T-γ δ (Tgd), type 17 Th (Th17) cells, immature DCs (iDCs), eosinophils, NK CD56dim cells, regulatory T-cells (Tregs), T-effector memory, T-cells, T-central memory, B-cells, type 1 Th (Th1) cells, macrophages, NK CD56 bright cells, activated DC, T-follicular helper (TFH), T-helper cells, and type 2 Th (Th2) cells. In addition, we used the “ggplot2” (v3.3.3) R package to analyse the correlation between KNSTRN expression and T-cell exhaustion markers (including PDCD1, CD274, CTLA4, HAVCR2, LAG3, and TOX). Pearson rank correlation analysis was applied to evaluate partial correlations and p-values. Correlations with p < 0.05 were considered significant.
We also used the TIMER2.0 (http://timer.cistrome.org/) server to analyse the correlation between KNSTRN expression and cancer-associated fibroblasts (CAFs) and tumour infiltration of 3 immunosuppressive cell types [27], including myeloid-derived suppressor cells (MDSCs), the M2 subtype of tumour-associated macrophages (M2-TAMs), and Tregs.
NamiRNA-enhancer-KNSTRN activation network construction
The LinkedOmics (http://www.linkedomics.org/login.php) website was used to obtain KNSTRN-associated miRNAs. Additionally, the TCGA data were analysed using the “DSEeq2”(v1.36.0) and “edgeR” (v3.38.2) packages in R to obtain the differentially expressed miRNAs. Additionally, if the miRNA transcriptional locus overlapped with the enhancer regions, the miRNA was chosen as the NamiRNA candidate, as described previously [20]. Overlapping miRNAs, as shown in the Venn diagram, among the KNSTRN-associated miRNAs, differentially expressed miRNAs, and enhancer-associated miRNAs were regarded as potential NamiRNAs. Comprehensive analysis of positively correlated NamiRNA-mRNA expression levels was performed to establish a key NamiRNA-enhancer-KNSTRN network for LIHC.
Statistical analysis
R software version 4.2.1 (https://cran.r-project.org/) was the main tool used to conduct the statistical analysis, and p < 0.05 was considered statistically significant. Additionally, other statistical analyses were automatically performed using the online databases mentioned above.
Results
Expression levels of KNSTRN in normal and cancerous human tissues
KNSTRN expression was analysed in 33 cancer datasets from the TCGA database. KNSTRN expression was significantly upregulated in 26 of the 33 cancer types (Fig. 1 A). As shown in Figure 1 A, KNSTRN expression was significantly downregulated in testicular germ cell tumours and thyroid carcinoma. No KNSTRN expression was detected in the adjacent normal tissues of mesothelioma (MESO) and uveal melanoma. KNSTRN expression was significantly higher in HCC tissues than in normal liver tissues (p < 0.001) (Fig. 1 B). In addition, receiver operating characteristic (ROC) curves were used to analyse the diagnostic value of KNSTRN expression. The area under the curve (AUC) for KNSTRN was 0.935, suggesting that KNSTRN is a potential diagnostic biomarker (Fig. 1 C).
Fig. 1
KNSTRN expression significantly up-regulated in multiple cancers, including liver hepatocellular carcinoma. The Cancer Genome Atlas (TCGA) database analysis shows the KNSTRN expression levels in 33 types of cancer tissues and their corresponding adjacent normal liver tissues. ns, p ≥ 0.05; **, p < 0.01; ***, p < 0.001 (A), KNSTRN expression levels were significantly higher in the hepatocellular carcinoma tissues compared to the normal liver tissues in the TCGA liver hepatocellular carcinoma (LIHC) datasets (B), diagnostic value of KNSTRN expression in LIHC (C)

Correlation analysis between KNSTRN expression and prognosis and clinicopathological characteristics
To better understand the role of KNSTRN expression in cancer, we used clinical data and TCGA RNAseq data (downloaded from UCSC Xena) to examine the prognosis of all TCGA cancer types to determine whether high KNSTRN expression influences the prognosis of patients with cancer. Two prognostic parameters, OS and PFI, were included. For OS, high expression of KNSTRN in pancreatic adenocarcinoma (PAAD), lung adenocarcinoma (LUAD), Adrenocortical carcinoma (ACC), bladder urothelial carcinoma (BLCA), Cervical squamous cell carcinoma and endocervical adenocarcinoma (CESC), kidney renal papillary cell carcinoma (KIRP), Lower Grade Glioma (LGG), Mesothelioma (MESO), Uterine Corpus Endometrial Carcinoma (UCEC), Glioma (GBM/LGG), oral squamous cell carcinoma (OSCC), and Liver Hepatocellular Carcinoma (LIHC) had unfavorable prognosis, but patients with thymoma (THYM) and Esophageal Squamous Cell Carcinoma (ESCC) with higher expression of KNSTRN displayed better prognosis (Fig. 2 A). For PFI, increased expression of KNSTRN indicated a poor prognosis in all affected tumours (Fig. 2 B). By combining the OS and PFI, KNSTRN may be utilized as a prognostic biomarker for unfavourable outcomes in patients with HCC. Detailed correlation analysis results revealed that elevated expression of KNSTRN was considerably associated with poor OS (HR = 1.48, 95% CI: 1.05–2.09, p = 0.027) and PFI (HR = 1.41, 95% CI: 1.05–1.89, p = 0.021) in HCC, as shown in Figures 3 A, B.
Fig. 2
Correlation analysis between KNSTRN expression and the prognostic value. The link between the expression of KNSTRN and prognosis in patients (overall survival and progression-free interval) of various cancers in The Cancer Genome Atlas database (A, B)

Additionally, ROC curves were used to determine the predictive value of KNSTRN mRNA levels. The area under the ROC curve was evaluated to predict the 1-, 2-, and 5-year OS risks in patients with HCC (1-year, AUC = 0.687; 2-year, AUC = 0.621; 5-year, AUC = 0.634) (Fig. 3 C). For PFI, KNSTRN expression also predicted the risk of HCC (1-year, AUC = 0.655; 2-year, AUC = 0.638; 5-year, AUC = 0.659) (Fig. 3 D).
Fig. 3
Correlation Analysis between KNSTRN expression and the prognostic value and clinicopathological characteristics. Survival curves with statistical significance in The Cancer Genome Atlas for overall survival (OS) (A) and progression-free interval (PFI) (B), the predictive value of KNSTRN mRNA levels for OS (C), PFI (D), relationship of KNSTRN expression with AFP (E), histological grade (F), pathologic stage (G), T stage (H), and TP53 mutation (I)
* p < 0.05
** p < 0.01
*** p < 0.001

We further assessed the expression of KNSTRN in various clinical phases of HCC and found that KNSTRN expression levels were significantly related to AFP, histological grade, pathologic stage, and T stage, as shown in Figu- res 3 E–H. KNSTRN was more highly expressed in the TP53-mutant group than in the TP53-nonmutant group (p < 0.001) (Fig. 3 I). Therefore, KNSTRN may promote HCC progression.
KNSTRN methylation status and its prognostic value
DNA methylation of KNSTRN and the prognostic value of CpG islands in KNSTRN were evaluated using the MetSurv tool. Ten CpG islands, including cg08036289 and cg25710630, exhibited elevated levels of DNA methylation (Fig. 4 A). Correlation analysis indicated that KNSTRN expression was significantly negatively correlated with methylation status (cg08036289) (Fig. 4 B). Furthermore, the methylation levels of 4 CpG islands, cg01301233 (HR = 0.639), cg08036289 (HR = 0.693), cg17805752 (HR = 1.662), and cg25947121 (HR = 1.979), were associated with prognosis (p < 0.05) (Table 1). Elevated levels of KNSTRN methylation in these 4 CpG islands, particularly cg08036289, were associated with better OS in patients with HCC than that in those with low levels of KNSTRN CpG methylation.
Fig. 4
DNA methylation levels in the KNSTRN gene are associated with the prognosis of hepatocellular carcinoma patients. The heat map of DNA methylation at CpG sites in the KNSTRN gene by the MethSurv database (A), correlation analysis of KNSTRN mRNA expression with KNSTRN methylation status by The Cancer Genome Atlas liver hepatocellular carcinoma database (B)
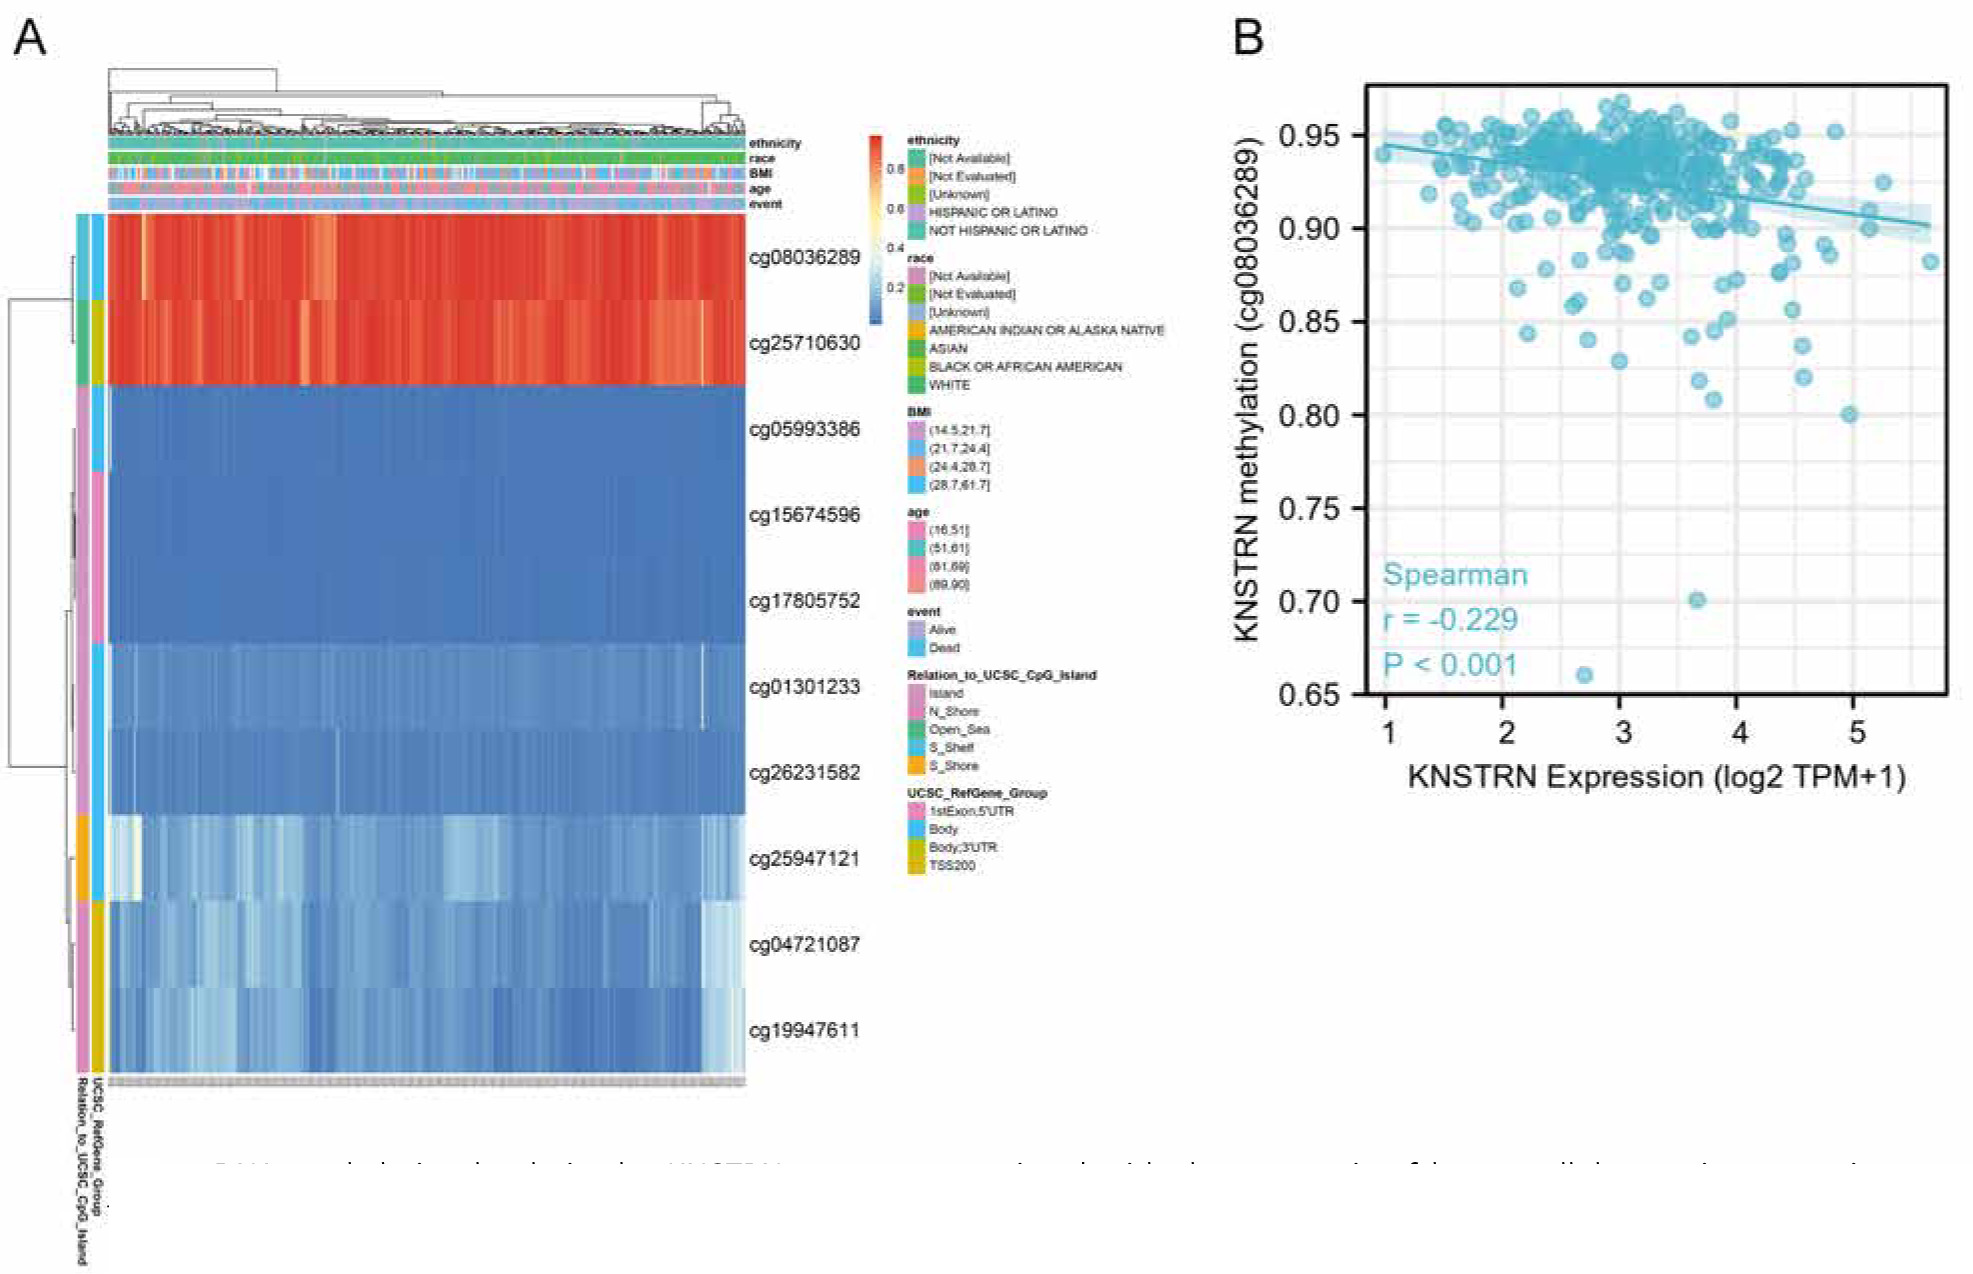
Table 1
Effects of methylation levels in the CpG sites of the KNSTRN gene on the prognosis of hepatocellular carcinoma patients
KNSTRN functional clustering and interaction network analysis of KNSTRN-related genes
To further determine the biological significance of KNSTRN in HCC, the LinkedOmics database was used to determine the co-expression pattern of KNSTRN in the TCGA-LIHC cohort. As shown in Figure 5 A, 5655 genes were positively correlated with KNSTRN, and 2661 genes were significantly negatively correlated with KNSTRN (false discovery rate, FDR < 0.05). Data from TCGA were analysed using the DSEeq2 package in R (|logFC| > 1.5, adjusted p-value < 0.05), and 1120 DEGs were identified between the groups with high and low KNSTRN expression, including 870 upregulated and 250 downregulated genes (Fig. 5 B). Detailed descriptions of the related genes and DEGs are provided in Supplementary 1, 2. The overlapping KNSTRN-related genes and DEGs are shown in Figure 5 C.
Fig. 5
Kinetochore-localized astrin/SPAG5-binding protein (KNSTRN) functional clustering and interaction network analysis of KNSTRN-related genes. Volcano map of KNSTRN-related genes in hepatocellular carcinoma (HCC) by the LinkedOmics database (A), volcano plot of differentially expressed genes (DEGs) between the high and low KNSTRN expression groups (B), Venn diagram of the KNSTRN-related genes and DEGs in HCC (C), gene ontology enrichment (D), and Kyoto Encyclopedia of Genes and Genomes pathway analysis (E) by the overlapping genes of the KNSTRN-related genes and DEGs, network of co-expressed genes of KNSTRN (F)
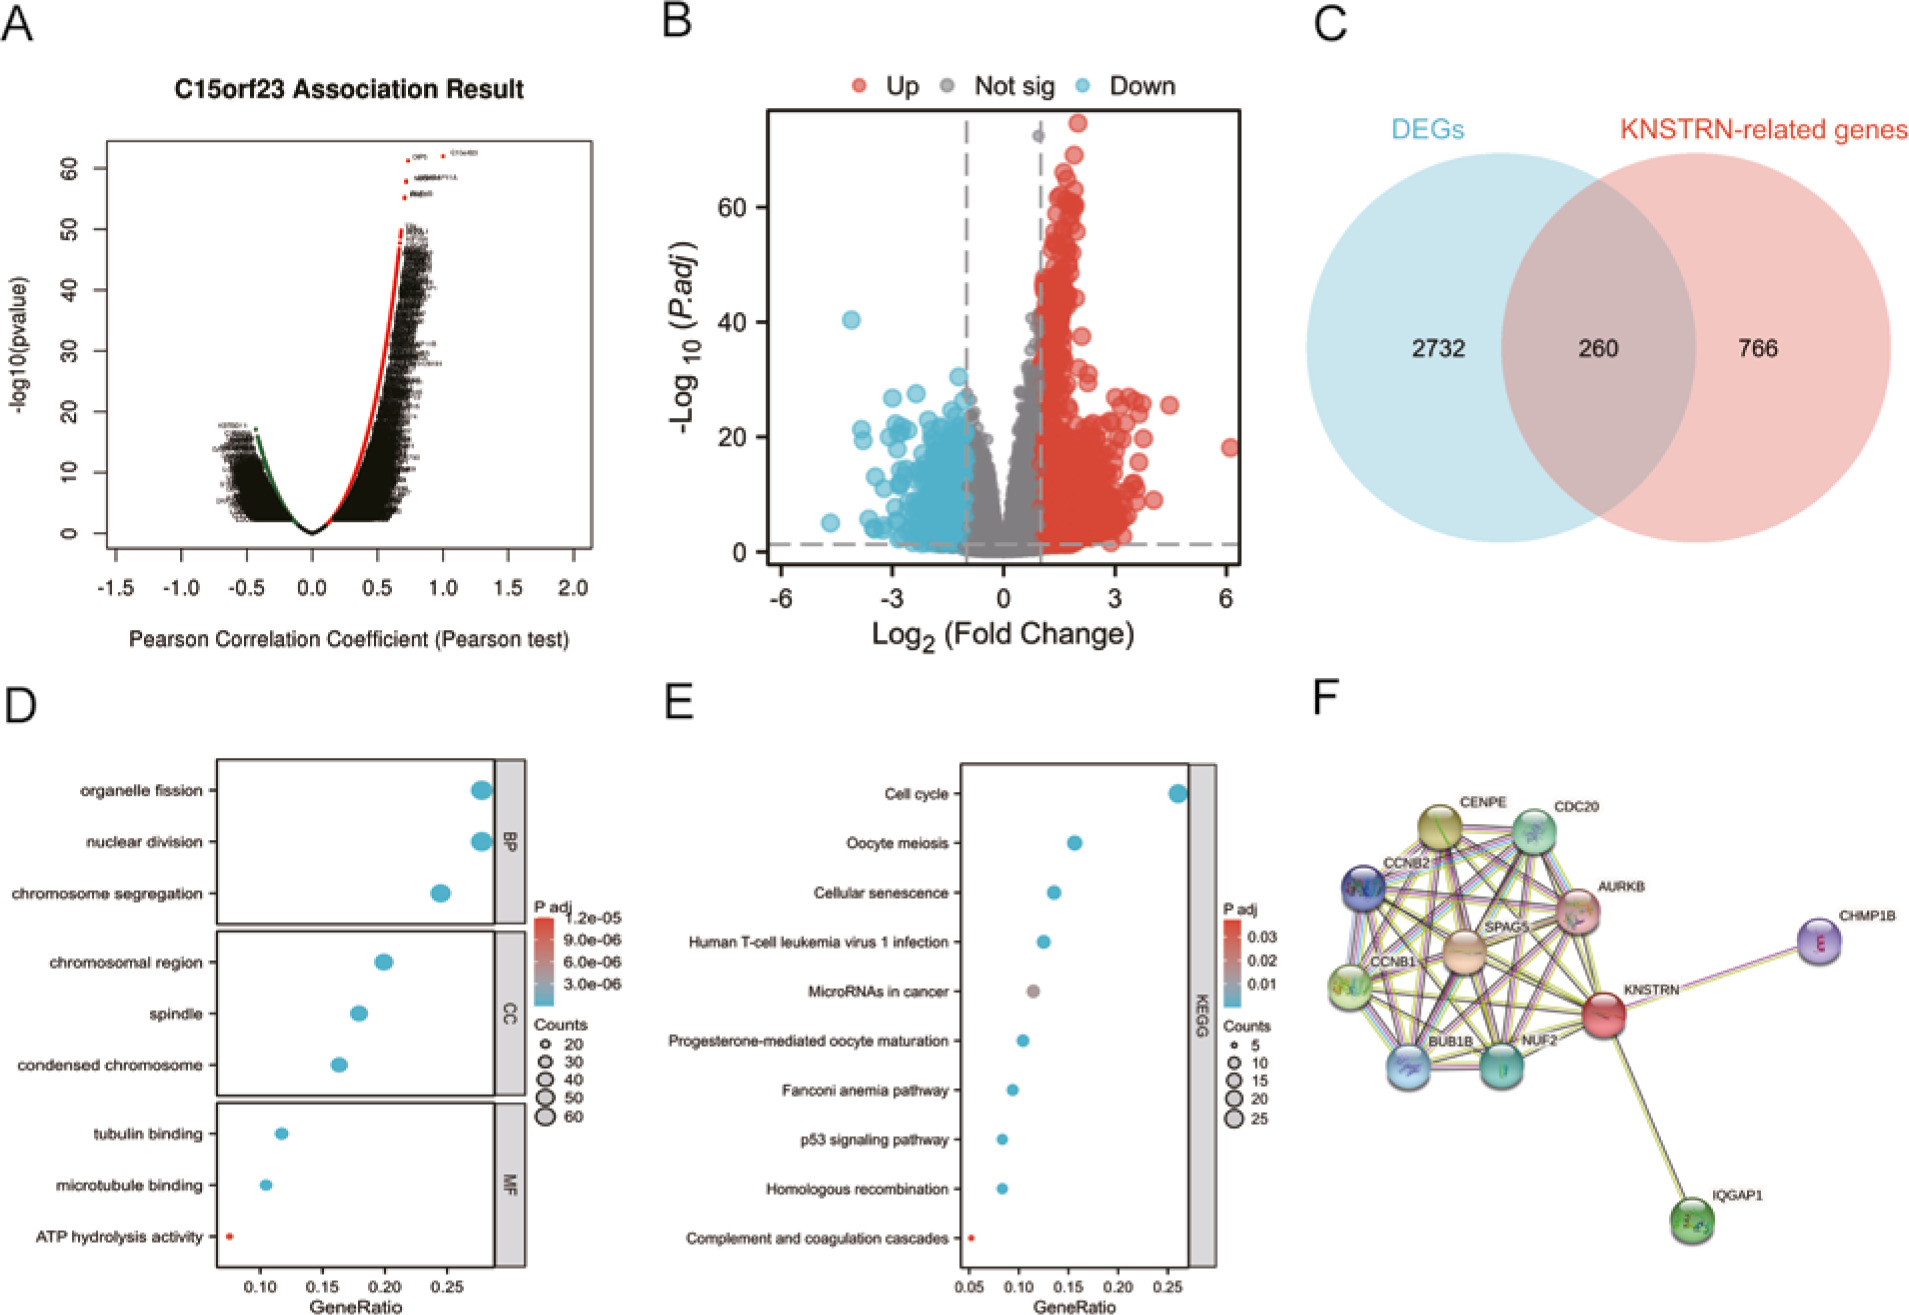
We used the R software package to perform GO and KEGG enrichment analyses of the overlapping genes (Suppl. 3) among the KNSTRN-related genes and DEGs. With adjusted p < 0.1, 298 biological processes, 59 cellular components (CC), 23 molecular functions, and 10 KEGG genes were identified. The bubble chart shows the first 3 GO items and all of the KEGG results. Gene ontology functional annotation showed that the overlapping genes were mainly involved in organelle fission, chromosomal regions, and tubulin binding (Fig. 5 D). Kyoto Encyclopedia of Genes and Genomes pathway analysis showed that the overlapping genes were mainly involved in the cell cycle, oocyte meiosis, and cellular senescence signalling pathways (Fig. 5 E). Supplementary 4 summarizes the GO and KEGG enrichment analysis results of the overlapping genes. To further understand the internal mechanism of KNSTRN, the STRING database was used to construct the KNSTRN PPI network. The analysis showed that KNSTRN was associated with SPAG5. Centromere protein E (CENPE), cyclin B1 (CCNB1), IQ motif containing GTPase-activating protein 1 (IQGAP1), cell division cycle 20 (CDC20), component of NDC80 kinetochore complex (NUF2), mitotic checkpoint serine/threonine kinase, cyclin B2 (CCNB2), charged multivesicular body protein 1B (CHMP1B), and aurora kinase B were 0.97, 0.922, 0.844, 0.838, 0.834, 0.833, 0.825, 0.802, 0.775, and 0.774, respectively (Fig. 5 F, Suppl. 5). In general, these related genes are highly expressed in several human cancers, and they promote tumourigenesis.
KNSTRN expression is associated with immune signatures in liver hepatocellular carcinoma
The infiltration status of 24 immune cell types in HCC tissues was evaluated using ssGSEA. As shown in Figure 6 A, KNSTRN expression showed a negative correlation with the levels of CD8+ T-cells (r = –0.199, p < 0.001), cytotoxic cells (r = –0.254, p < 0.001), dendritic cells (DCs) (r = –0.288, p < 0.001), mast cells (r = –0.155, p < 0.001), neutrophils (r = –0.288, p < 0.001), pDCs (r = –0.233, p < 0.001), γ δ T-cells (Tgd) (r = –0.183, p = 0.007), natural killer cells (NK) (r = –0.130, p = 0.012), and iDC (r = –0.119, p = 0.022). In contrast, KNSTRN expression was positively correlated with the infiltration levels of Th2-cells (r = 0.585, p < 0.001), T-helper cells (r = 0.287, p < 0.001), and TFH (r = 0.128, p = 0.013).
In addition, we divided the 374 tumour samples into 2 groups based on KNSTRN expression, with 187 samples in the high-expression group and 187 samples in the low-expression group. We used the TIMER database to analyse immune infiltration in LIHC with different KNSTRN expression levels (Figs. 6 B, C). The results showed that the infiltration levels of CD8+ T-cells, cytotoxic cells, DCs, iDC, mast cells, neutrophils, and pDCs were significantly lower in patients with LIHC with high KNSTRN expression than in those with low KNSTRN expression. In contrast, compared with that in the low expression group, infiltration of T-helper cells, TFH, and Th2-cells increased in the high KNSTRN expression group (p < 0.05).
Fig. 6
Correlation investigation of KNSTRN expression, immune infiltration, gene markers in exhausted T-cells in The Cancer Genome Atlas liver hepatocellular carcinoma dataset. The correlation analysis results between the expression levels of KNSTRN and the expression levels of 24 immune cell types (A–C), regulatory T-cells, macrophages-M2, MDSC, and CAF (D). The correlation analysis results between the expression levels of KNSTRN and the expression levels of PDCD1 (E), CD274 (F), CTLA-4 (G), HAVCR2 (H), LAG3 (I), TOX (J), and TP53 (K)

The TIMER tool was used to analyse the correlation between KNSTRN expression and the markers of various immune cells in HCC. The results showed that the expression of KNSTRN was significantly correlated with the immune markers CD19, CD79A, and KRT20 in B-cells in HCC (p < 0.001) (Table 2). We also analysed the levels of various T-cells with different functions, including CD8+ T, Tfh, Th1, Th2, Th17, and Treg cells. After adjusting for tumour purity, the results showed that the expression level of KNSTRN was significantly correlated with the immune markers of most T-cells in HCC, including CD8B, CD25, CD183, CD185, CD278, CD360, IL23R, and CD196 (Table 2). This indicates that KNSTRN may be involved in the T-cell immune response in HCC.
Table 2
Correlation analysis between KNSTRN and biomarkers of immune cells in hepatocellular carcinoma
In addition, we used the TIMER database to investigate whether KNSTRN expression is related to the number of common immunosuppressive cells and CAFs in LIHC. As shown in Figure 6 D, KNSTRN expression was positively correlated with the levels of Tregs (r = 0.37, p < 0.001), macrophages-M2 (r = 0.339, p < 0.001), MDSC (r = 0.576, p < 0.001), and CAFs (r = 0.304, p < 0.001). Furthermore, positive correlations between the expression levels of KNSTRN and gene markers in exhausted T-cells, such as PDCD1 (PD-1, r = 0.282, p < 0.001), CD274(PDL-1, r = 0.207, p < 0.001), CTLA4 (r = 0.271, p < 0.001), HAVCR2 (TIM-3, r = 0.259, p < 0.001), LAG3 (r = 0.233, p < 0.001), and TOX (r = 0.161, p = 0.002) were observed in HCC (Figs. 6 E–J).
NamiRNA−enhancer−KNSTRN activation network construction in liver hepatocellular carcinoma
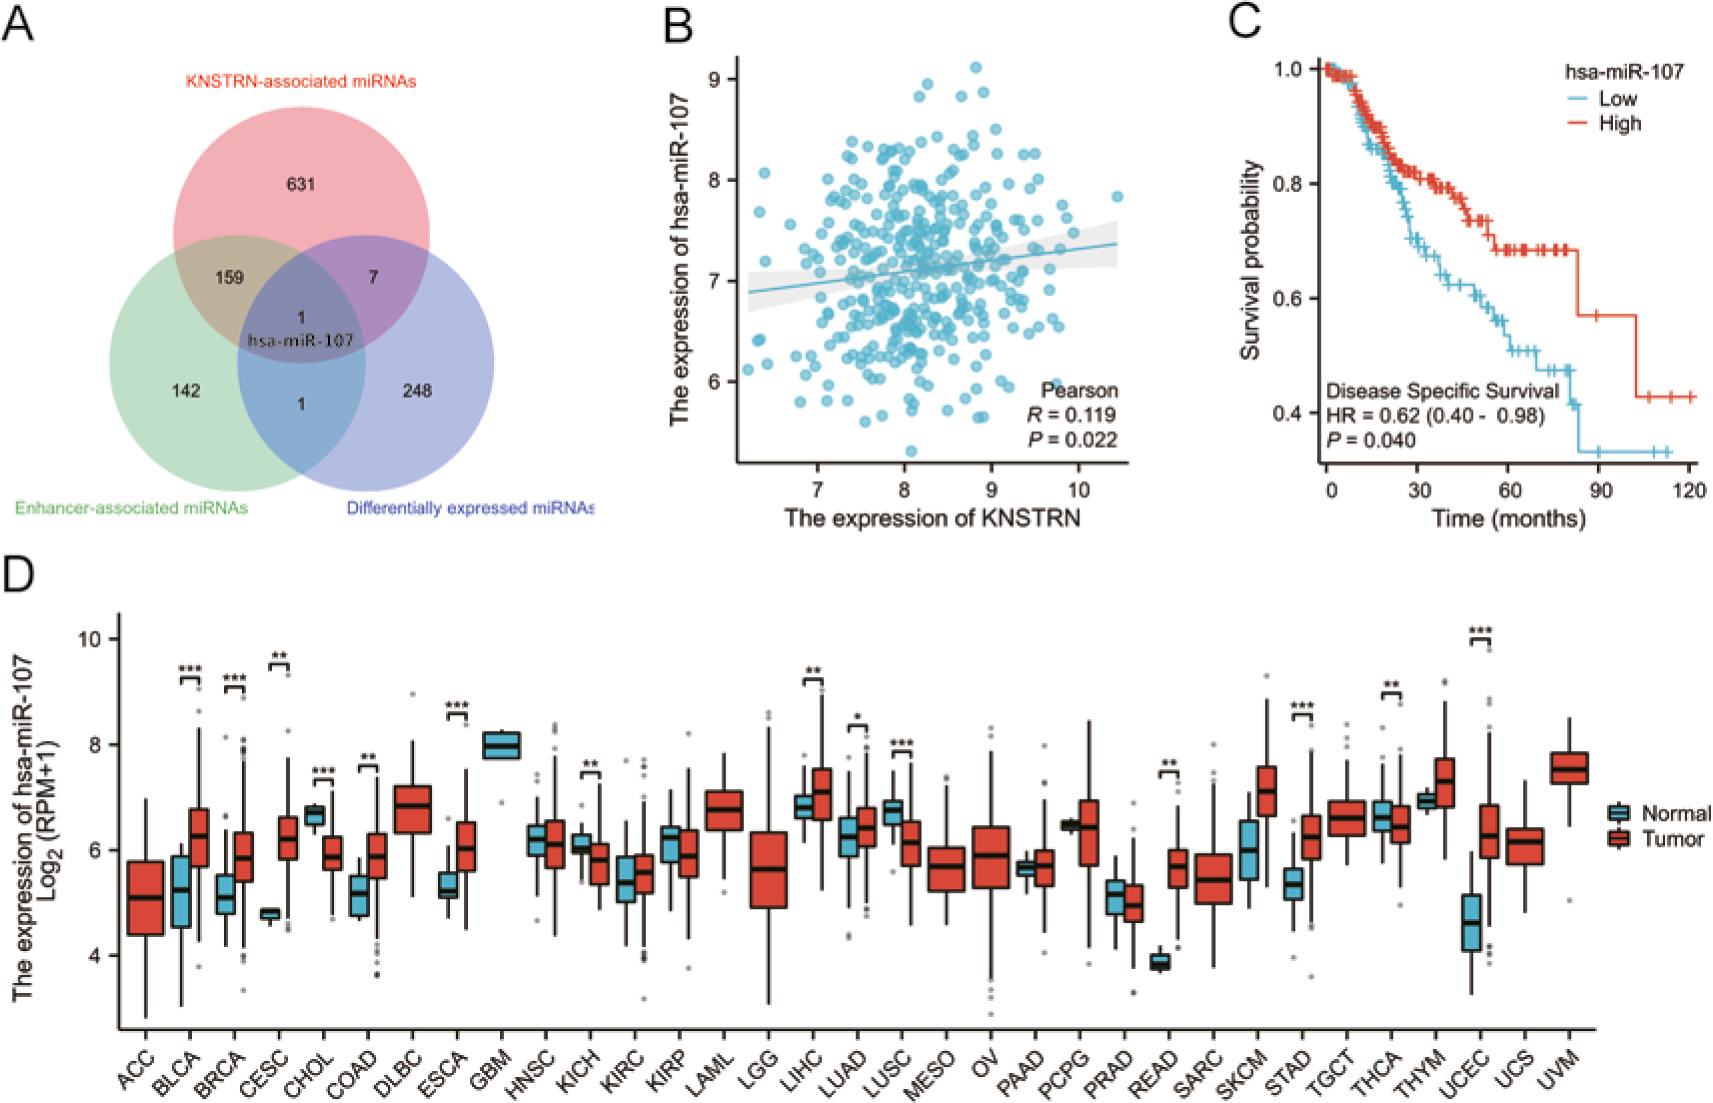
As shown in Figure 7 A, 798 KNSTRN-associated miRNAs were obtained from the LinkedOmics website. Additionally, 257 differentially expressed miRNAs were identified between the normal and tumour groups from the TCGA database, and 303 enhancer-associated miRNAs were obtained as potential NamiRNAs from a published study [20]. See Supplementary 6 for a detailed description of these miRNAs. Furthermore, correlation analysis revealed that KNSTRN was significantly and positively correlated with hsa-miR-107 (r = 0.119, p < 0.05), as shown in Figure 7 B. Next, we determined the expression and prognostic value of hsa-miR-107 in HCC cells. As presented in Figures 7 C, D, hsa-miR-107 expression was markedly upregulated in HCC, which was negatively correlated with patient prognosis (HR = 0.62, p < 0.05). These findings suggest that hsa-miR-107 may be the most potent regulatory NamiRNA of KNSTRN in HCC. Finally, a potential NamiRNA-enhancer network of hsa-miR-107 that activates KNSTRN expression in LIHC was constructed (Fig. 8).
Fig. 7
Identification of hsa-miR-107 as a potential NamiRNA of KNSTRN in liver hepatocellular carcinoma (LIHC). The overlapping miRNA of the KNSTRN-associated miRNAs, differentially expressed miRNAs, and enhancer-associated miRNAs was regarded as potential NamiRNA (A), correlation analysis of KNSTRN expression with hsa-miR-107 by The Cancer Genome Atlas (TCGA) LIHC database (B), the prognostic value of hsa-miR-107 in the TCGA-LIHC database (C), TCGA database analysis shows the hsa-miR-107 expression levels in 33 types of cancer tissues and their corresponding adjacent normal liver tissues (D)

Discussion
KNSTRN, also known as C15orf23, is a mitosis-related protein that binds directly to microtubules [17]. However, the role of KNSTRN in tumourigenesis has rarely been investigated. In recent years, studies have reported functional links between KNSTRN and endometrial cancer and LUAD [16, 19]. In this study, we sought to determine the expression and prognostic value of KNSTRN in HCC. We found that KNSTRN expression was upregulated in tumour tissues, and high KNSTRN expression was closely associated with poor OS and PFI in HCC. Furthermore, high KNSTRN expression was associated with worse histological-grade features in HCC cohorts. The area under the curve values for 1-, 3-, and 5-year predicted survival rates were all greater than 0.6. The area under the curve for diagnostic efficiency was 0.935. These findings strongly suggest that KNSTRN is an oncogenic molecule involved in tumour progression and is a potential prognostic and diagnostic biomarker for HCC.
The tumour microenvironment (TME) and tumour immune evasion correlate with cancer prognosis and therapeutic efficacy [28]. Tumour infiltration by immune cells leads to T-cell anergy or dysfunctional T-cell phenotypes [29, 30], which promote tumour escape from the host immune system, and tumour progression, invasion, metastasis, and therapeutic resistance [29]. In this study, given that KNSTRN was abnormally highly expressed in LIHC, we speculated that KNSTRN may be involved in regulating the tumour immune response. Therefore, we explored the possible correlation between the infiltration levels of various immune cells and expression of KNSTRN in LIHC (TCGA data). As shown in Figures 6 A–C, a significant positive correlation was observed between KNSTRN expression and the proportion of TFH, T-helper, and Th2-cells in HCC tissues. These results are consistent with those of previous studies showing that TFH-cells regulate tumour growth and progression via the chemokine receptor CXCR5 [26, 31]. Th2 induces M2 macrophage polarization to promote tumour progression via cytokines [32]. Moreover, Th2 plays an important role in the mechanisms of resistance against cancer immunotherapy [33].
One of the most important features of immunosuppression is T-cell exhaustion. In our study, upregulated KNSTRN expression was strongly associated with several T-cell exhaustion markers (Figs. 6 E–J), including PD-1(PDCD1), PD-L1(CD274), CTLA4, TIM-3(HAVCR2), LAG3, and TOX. PD1/PDL1 is an important immune checkpoint that regulates the function of tumour-infiltrating lymphocytes. Notably, although PD1/PDL1 checkpoint blockade therapy is widely used for various malignancies, including HCC, some studies have reported that PD-1 plays a critical role in tumour antigen tolerance, leading to poor therapeutic effects in some patients who receive PD1 therapy [34–36]. Concurrently, combinations of inhibitory receptors, such as PD-1 and TIM-3, regulate exhausted T-cells and cooperate to induce CD8+ T-cell deficiency [37]. Furthermore, the activation of TIM-3 and CTLA-4 suppresses T-cell-mediated immune responses [38]. In addition, Khan et al. reported that TOX+ cells express multiple inhibitory receptors, such as LAG3 and PDCD1, suggesting that TOX is a major regulatory molecule of differentiation of TEX at the transcriptional and epigenetic levels [39]. Additionally, T-cell exclusion is dependent on the infiltration of immunosuppressive cells, including CAFs, Tregs, M2-TAMs, and MDSCs [40, 41]. Notably, as shown in Figure 6 D, we found that KNSTRN expression levels strongly correlated with the number of immunosuppressive cells in HCC. Thus, we speculate that T-cell exclusion is the major mechanism through which KNSTRN regulates tumour escape of immune cells, thereby contributing to HCC growth and progression.
The correlations between KNSTRN and the immune markers of various immune cells in HCC are shown in Table 2. In our study, we found that the expression level of KNSTRN was significantly correlated with immune markers of M2 macrophages in HCC, such as CD163, immunoglobulin domain containing 4, and colony stimulating factor 1 receptor (p < 0.001). This shows that KNSTRN has the potential to regulate macrophage polarization in HCC. Moreover, the expression of KNSTRN was positively correlated with immune markers of neutrophils and DCs in HCC, including ITGAX, CD1C, NRP1, CCR7, ITGAM, and CD59 (p < 0.05) (Table 2). After adjusting for tumour purity, the results revealed that the expression level of KNSTRN was significantly correlated with most of the immune markers of different T-cells in HCC. In summary, these findings indicate that KNSTRN plays a different crucial role in the regulation of the TME.
However, cancer development and therapeutic limitations cannot be attributed to a single gene. Therefore, we constructed a PPI network to screen hub genes involved in KNSTRN regulation. Notably, we found significant correlations (r > 0.8) between KNSTRN expression levels and the expression levels of SPAG5, CENPE, CCNB1, IQGAP1, CDC20, NUF2, BUB1B, and CCNB2 in HCC (Fig. 5 F, Suppl. 5). SPAG5 acts as an oncogene and is a promising prognostic factor in HCC [42–45]. Human CENPE are potential biomarkers for clinical diagnosis [46]. Cyclin B1 and CCNB2 are independent risk factors for HCC [47]. Additionally, overexpression of IQGAP1 has been observed in HCC [48]. Zhao et al. and Lai et al. reported that CDC20 is a tumour promoter in HCC [49, 50]. Upregulated expression of BUB1B, CCNB1, and CDC20 in tumour tissues predicts worse OS and disease-free survival in patients with HCC [51–53]. NUF2 is highly expressed in several human cancers, and it promotes tumourigenesis [54–56]. Collectively, the expression of these related genes suggests that KNSTRN plays a key role in the progression of HCC.
DNA methylation during carcinogenesis affects gene expression and the prognosis of patients with cancer [57]. Notably, our data revealed that the methylation level of KNSTRN-cg08036289 was significantly correlated with the expression of KNSTRN. Moreover, hypermethylation of the CpG site KNSTRN-cg08036289 (p = 0.042) was associated with improved prognosis in HCC.
We performed GO and KEGG functional enrichment analyses to further clarify the underlying biological functions of KNSTRN. Cell cycle disorder is one of the most remarkable features of tumour cells. In this study, KEGG pathway analysis showed that KNSTRN was mainly involved in cell cycle, oocyte meiosis, and cellular senescence signalling pathways. Furthermore, using GO functional enrichment analysis, we found that KNSTRN co-expression was mainly involved in organelle fission, chromosomal regions, and tubulin binding. Thus, GO and KEGG analyses revealed that KNSTRN may play a role in influencing the cell cycle and regulating cellular senescence.
Most existing studies regarding miRNA are based on miRNA binding to the 3’UTR of target mRNA to degrade or repress expression of the corresponding gene [58, 59]. Notably, growing evidence has shown that miRNAs can also exhibit positive roles and promote gene expression under certain circumstances [20, 60–62]. Liang et al.[22] defined a subset of NamiRNAs with an activation function in the nucleus. Several studies have proposed a novel regulatory network for NamiRNA-enhancer gene activation [63, 64], which is crucial for cell identification throughout the transformation of cells from normal to cancerous [21]. To ascertain whether KNSTRN expression was positively modulated by NamiRNAs, we first predicted a NamiRNA that could potentially bind to KNSTRN and identified hsa-miR-107. Based on the mechanism of action of NamiRNAs in the regulation of target gene expression, a positive correlation should exist between hsa-miR-107 and KNSTRN expression. In our study, correlation analysis revealed that KNSTRN expression was significantly and positively correlated with hsa-miR-107 (r = 0.119, p < 0.05), as shown in Figure 7 B. Next, we determined the expression and prognostic value of hsa-miR-107 in HCC cells. As presented in Figures 7 C, D, hsa-miR-107 expression was markedly upregulated in HCC, and its upregulation was negatively correlated with patient prognosis (HR = 0.62, p < 0.05). These findings suggest that hsa-miR-107 may be the most potent regulatory NamiRNA of KNSTRN in HCC. Finally, a possible NamiRNA-enhancer network of hsa-miR-107 that activates KNSTRN expression in LIHC cells was determined, as shown in Figure 8. Although the NamiRNA- enhancer-KNSTRN regulatory axis was identified through bioinformatics analysis, further experiments are required to confirm our prediction.
Conclusions
In summary, the current study revealed the diagnostic and prognostic value of KNSTRN in HCC. Simultaneously, KNSTRN expression significantly correlated with a variety of tumour-infiltrating immune cells in patients with HCC. Moreover, we constructed a possible NamiRNA-enhancer network through which hsa-miR-107 activates KNSTRN expression, indicating that KNSTRN may participate in various molecular regulatory mechanisms in HCC. Collectively, KNSTRN could serve as an effective biomarker for diagnosis and prognosis and support the development of new therapeutic strategies for HCC. However, further studies are required to validate these findings.