

Introduction
Bladder cancer (BC) is the most common malignancy of the urinary system, with approximately 550,000 new cases and 200,000 deaths occurring annually worldwide, according to the 2018 global cancer statistics [1]. According to whether there is muscle layer infiltration, bladder cancer can be classified into non-muscle layer invasive bladder cancer (NMIBC) and muscle layer invasive bladder cancer (MIBC). So far, transurethral resection of blad- der tumor (TURBT) combined with intravesical instillation is still the main treatment for NMIBC. For MIBC, neoadjuvant chemotherapy combined with radical cystectomy is the gold standard of treatment at present; it can improve the survival rate of patients and reduce recurrence and meta- stasis [2]. Although NMIBC rarely metastasizes, recurrence and even progression to MIBC occur after TURBT, and MIBC is more likely to metastasize than NMIBC [3, 4]. In recent years, immune checkpoint inhibitors have shown powerful anti-tumor effects in the treatment of many kinds of tumors [5, 6]. The use of immune checkpoint inhibitors has demonstrated both good anti-tumor effects in patients with locally advanced and metastatic bladder cancer and long-term survival in some patients [7]. However, the need for prognostic and predictive biomarkers for bladder cancer has not yet been met. We need to find a new therapeutic target that can better provide new strategies for early diagnosis, treatment and prognosis of bladder cancer.
Notch signaling is an evolutionarily conserved signaling mechanism that regulates normal embryonic development, tissue homeostasis and pathophysiological processes, and affect cell proliferation, cell cycle and apoptosis [8]. A growing body of research suggests that Notch signaling plays a critical role in the development and progression of human cancers, promoting and inhibiting the tumor development process in various cancers [9]. Notch signaling can be shown to promote and inhibit cancer in different tissue cells, even at different stages of the same tumor [10]. The tumor microenvironment (TME) consists of blood vessels, immune infiltrates, fibroblasts and extracellular matrix around tumor cells; it can be classified into T lymphocyte, B lymphocyte, and monocyte cell lines, natural killer (NK) cells, cytotoxic lymphocytes, the dendritic cell immune microenvironment and the non-immune microenvironment mainly composed of endothelial cells and fibroblasts. Tumor cells and the TME complement each other. Tumor progression, metastasis, invasion and treatment resistance are all the results of the interaction between tumor cells and the TME [11]. It has been shown that Notch signaling plays a role in TME in different tumors [11]. The Notch signaling pathway was found to be involved in the activation of immature CD8 positive T cells via Notch 1 and Notch 2 [12]. Notch2 was also closely related to the anti-tumor CTL response[13]. The Notch signaling pathway has also been found to be involved in the differentiation of tumor related macrophages and tumor epithelial mesenchymal transition [14, 15]. In addition, the Notch signaling pathway also mediated the interaction between cancer related fibroblasts and tumor stem cells through Notch3 [16]. In summary, the Notch signaling pathway plays an important role in the tumor microenvironment. However, the mechanisms and correlations between Notch signaling and the immune response in BC have rarely been investigated. Based on the close relationship between Notch signaling pathway-related genes (NRGs) and tumors, molecular typing of BC based on NRG will probably obtain BC subtypes with different obvious clinical characteristics, so as to better distinguish BC.
Material and methods
Source for gene list of Notch signaling pathways and BC datasets and data processing
The gene list of Notch signaling pathways (pathway: hsa04330) was obtained from the MSigDB database (https://www.gsea-msigdb.org/gsea/msigdb). The Cancer Genome Atlas (TCGA) BC dataset was downloaded from the UCSC Xena server. Gene expression was converted to log2 (1+ counts). GSE13507 including BC samples were obtained from the GEO database for validation as an external dataset.
Principal component analysis
For principal component analysis (PCA), we used the R package stats (version 3.6.0) for analysis; specifically, we first performed the z-score on the expression spectrum and further dimensionality reduction analysis using the PRCOMP function to obtain the reduced matrix. After reducing the dimension of complex data, we first eliminated the outlier samples, and then carried out the follow-up analysis. For UMAP, we used the R package UMAP (version 0.2.7.0) for analysis; specifically, we first performed the z-score on the expression spectrum and further dimensionality reduction analysis using the UMAP function to obtain the reduced matrix.
LASSO regression
In the present study, we used the R package glmnet to integrate OS survival time, survival status, and gene expression data for regression analysis using the Lasso-Cox method. In addition, we set 10-fold cross-validation to obtain the optimal model, and we set the lambda value to 0.0501732887259597, ultimately obtaining 10 genes.
Cluster analysis
Cluster analysis was performed using ConsensusClusterPlus (Wilkerson and Hayes, 2010, ConsensusClusterPlus: a class discovery tool with confidence assessments and item tracking, DOI: 10.1093/bioinformatics/btq170), using agglomerative PAM clustering with the 1-Pearson correlation distances and resampling 80% of the samples for 10 repetitions. The optimal number of clusters was determined according to the cluster within the average consistency assessment. The number of clusters with the highest average consistency was K = 2.
Survival analysis and correlation analysis
We analyzed the prognostic differences between different groups using the survfit function of the R software package and the log-rank test was used to assess the significance of the prognostic differences between the different groups. Pearson correlation was used for correlation analysis.
Gene set enrichment analysis
For gene set enrichment analysis (GSEA), we obtained the GSEA software (version 3.0) from the GSEA website (DOI: 10.1073/pnas.0506580102, http://software.broadinstitute.org/GSEA/index.jsp), divided samples into two groups according to the Notch signaling pathway, and downloaded the c2.cp.reactome.v7.4.symbols.gmt subset from the MSigDB database (DOI: 10.1093/bioinformatics/ btr260,http://www.gseamsigdb.org/gsea/downloads.jsp), to assess the relevant pathways and molecular mechanisms. Based on gene expression profiling and phenotypic grouping, a minimum gene set of 5 and a maximum gene set of 5,000, number of permutations was 1,000; a p-value < 0.05 (as needed) and an FDR < 0.25 (as needed) were considered statistically significant.
Investigation of immune-related scores and predicted response to immunotherapy
ESTIMATE analysis was applied to estimate the proportion of immune and stromal cells. MCP-Counter analysis was applied to further estimate immune and mesenchymal cell subsets. TIDE score and predicted response to immunotherapy were analyzed via the TIDE database (http://tide.dfci.harvard.edu/).
Statistical analysis
All statistical analyses and visualizations were carried out by R version 4.0.2 (http://www.r-project.org). The Kruskal-Wallis test was used to compare more than two groups, and the Wilcoxon signed-rank test was used to estimate the differences between the two groups. Kaplan-Meier analyses and the log-rank test were applied to assess the survival differences between the two groups. P < 0.05 was regarded as statistically significant.
Results
Expression patterns of Notch signaling pathway-related genes in different clinical characteristics of bladder cancer
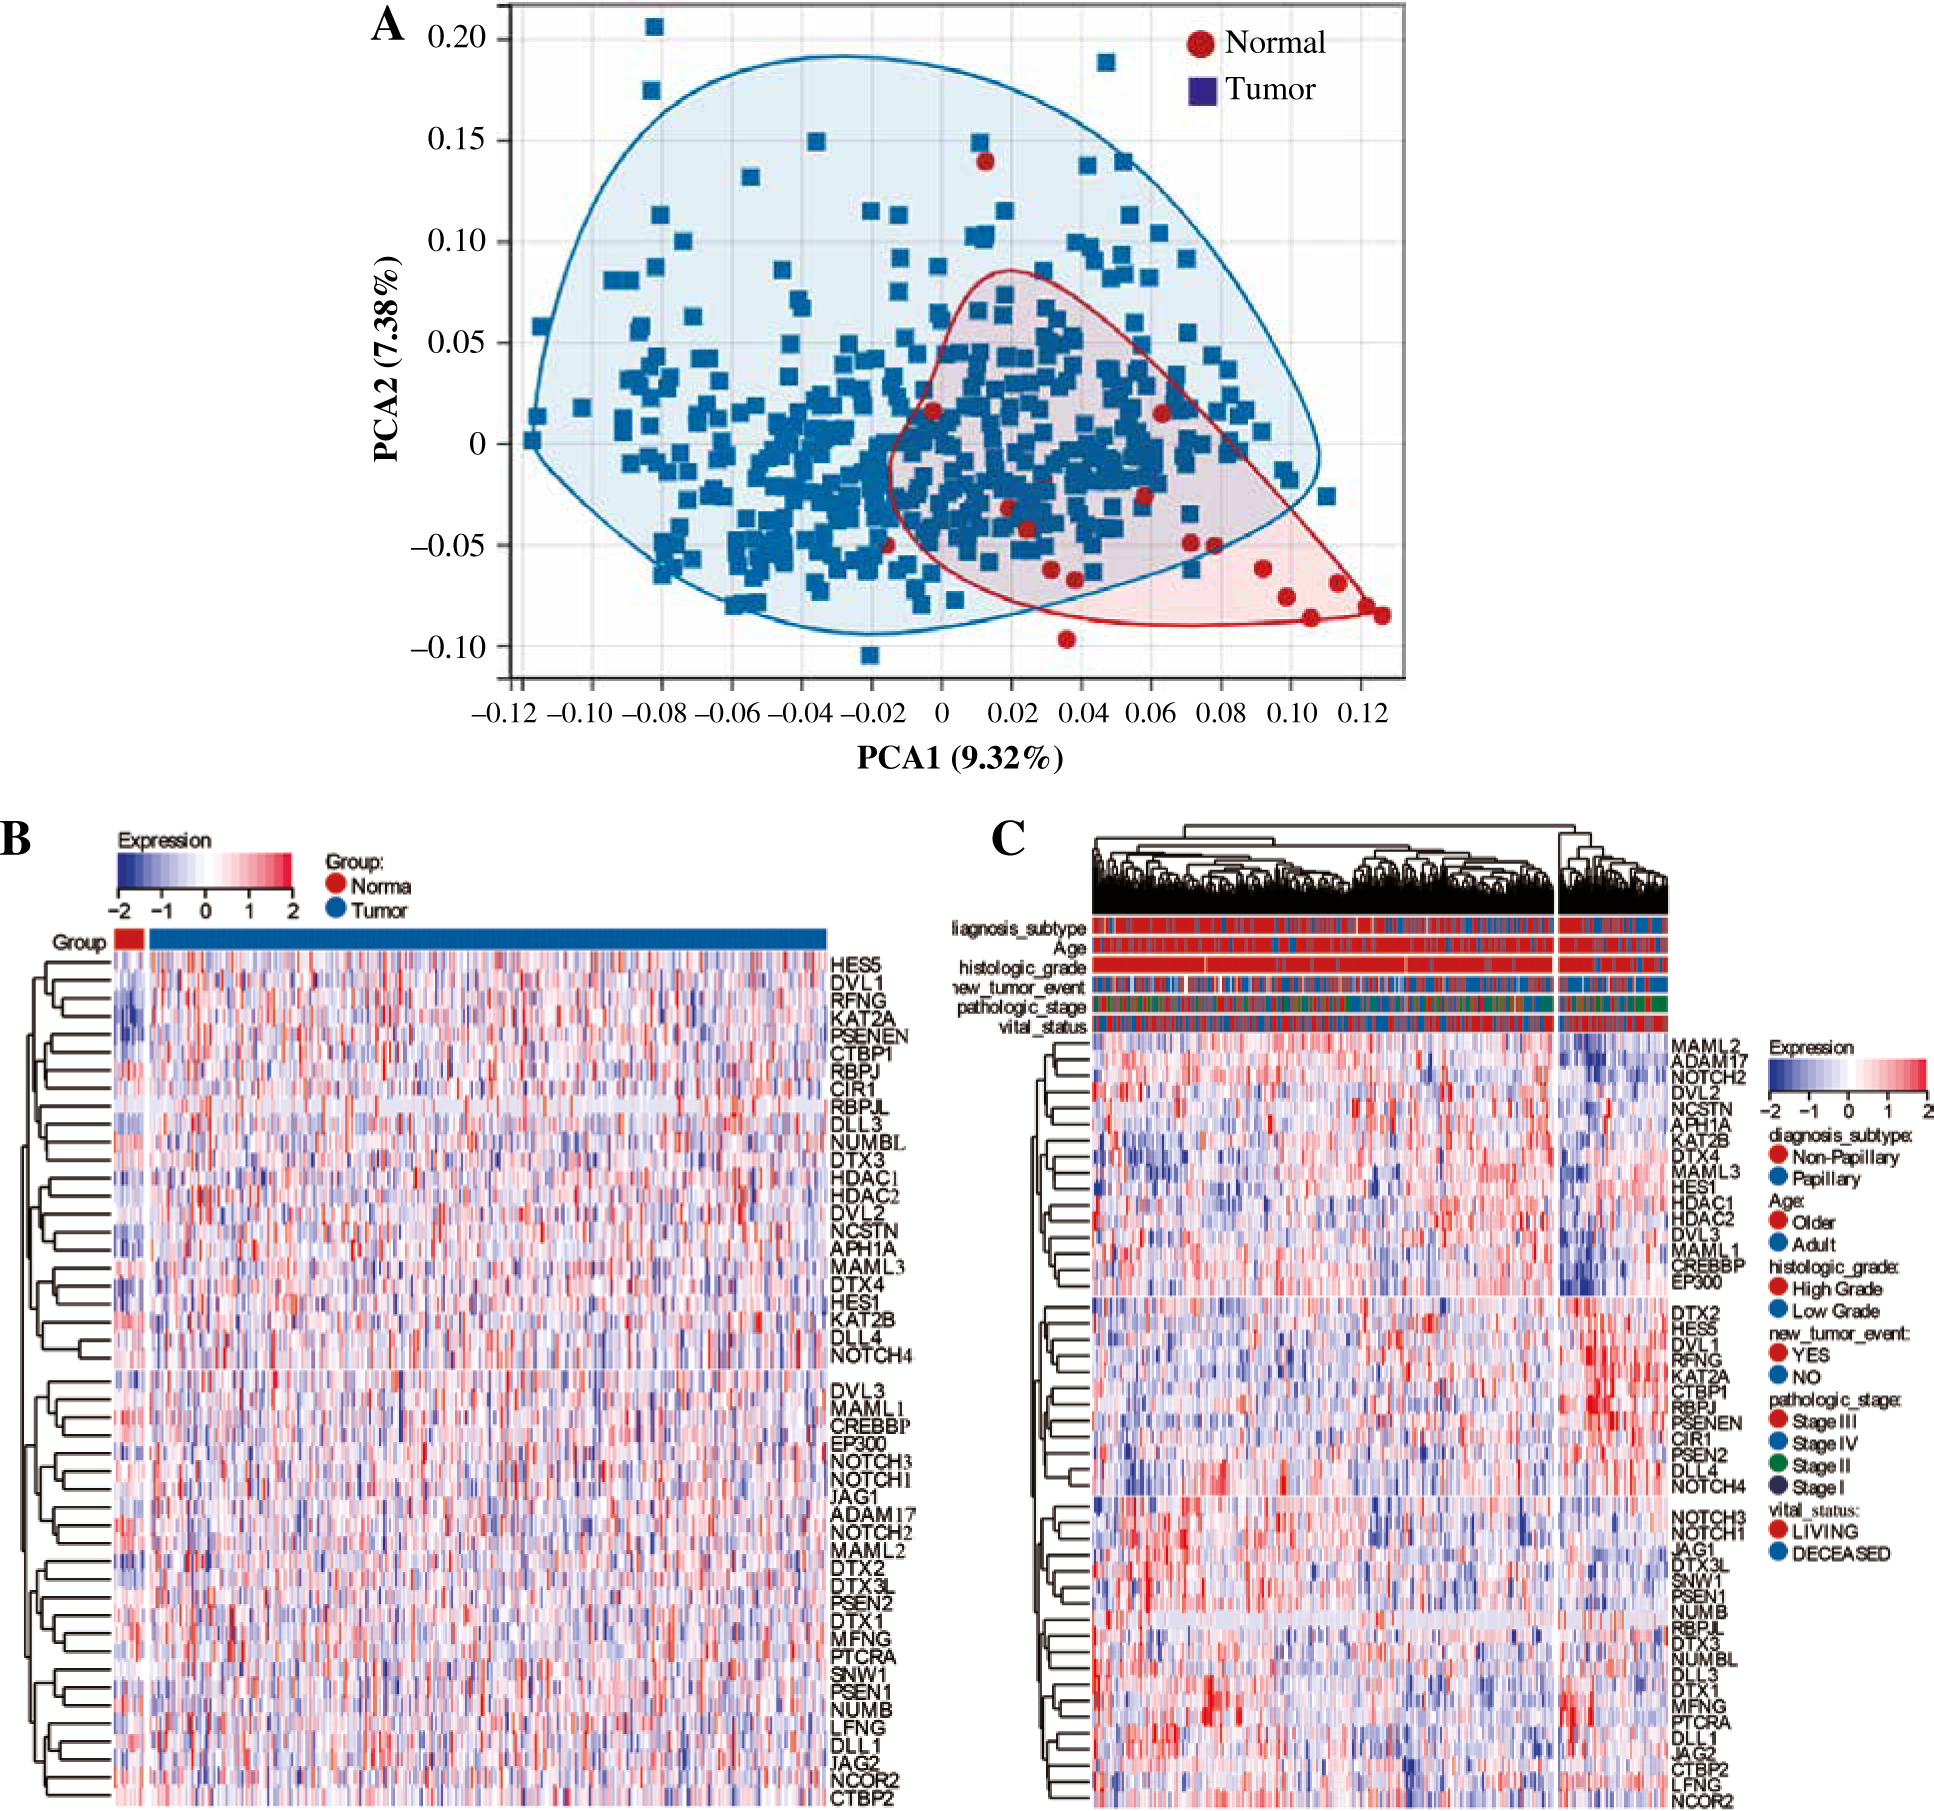
First, we performed PCA analysis for the bladder cancer dataset from TCGA. An outlier sample was rejected from the normal group (Fig. 1A) and the other samples were further analyzed. We found that the expression pattern of NRGs was different between normal samples and BC samples. RFNG, KAT2A, PSENEN, APH1A, NCSTN, DTX4, DTX2, NOTCH3 were highly expressed in BC, while MAML3, KAT2B, MAML1, CREBBP, NOTCH1, NOTCH2, MAML2, NOTCH4, DLL1, DLL4 were low expressed (Fig. 1B). Next we further analyzed the NRG expression patterns according to different clinical features, and we found that the MAML2, ADAM17, NOTCH2, DVL2, NCSTN, APH1A, KAT2B, DTX4, MAML3, HES1, HDAC1, HDAC2, DVL3, MAML1, CREBBP, EP300 genes were highly expressed in non-papillary bladder cancer, elderly patients, histologically high grade, recurrent, pathologically high grade and deceased patients; however, DTX2, HES5, DVL1, RFNG, KAT2A, CTBP1, RBPJ, PSENEN, CIR1, PSEN2, DLL4, NOTCH4 genes showed low expression, while NOTCH3, NOTCH1, JAG1, DTX3L, DTX3L, SNW1, PSEN1, NUMB, RBPJL, DTX3, NUMBL, DLL3, DTX1, MFNG, PTCRA, DLL1, JAG2, CTBP2, LFNG, NCOR2 did not differ significantly among the different clinical features (Fig. 1C).
Classification of BC based on NRG expression
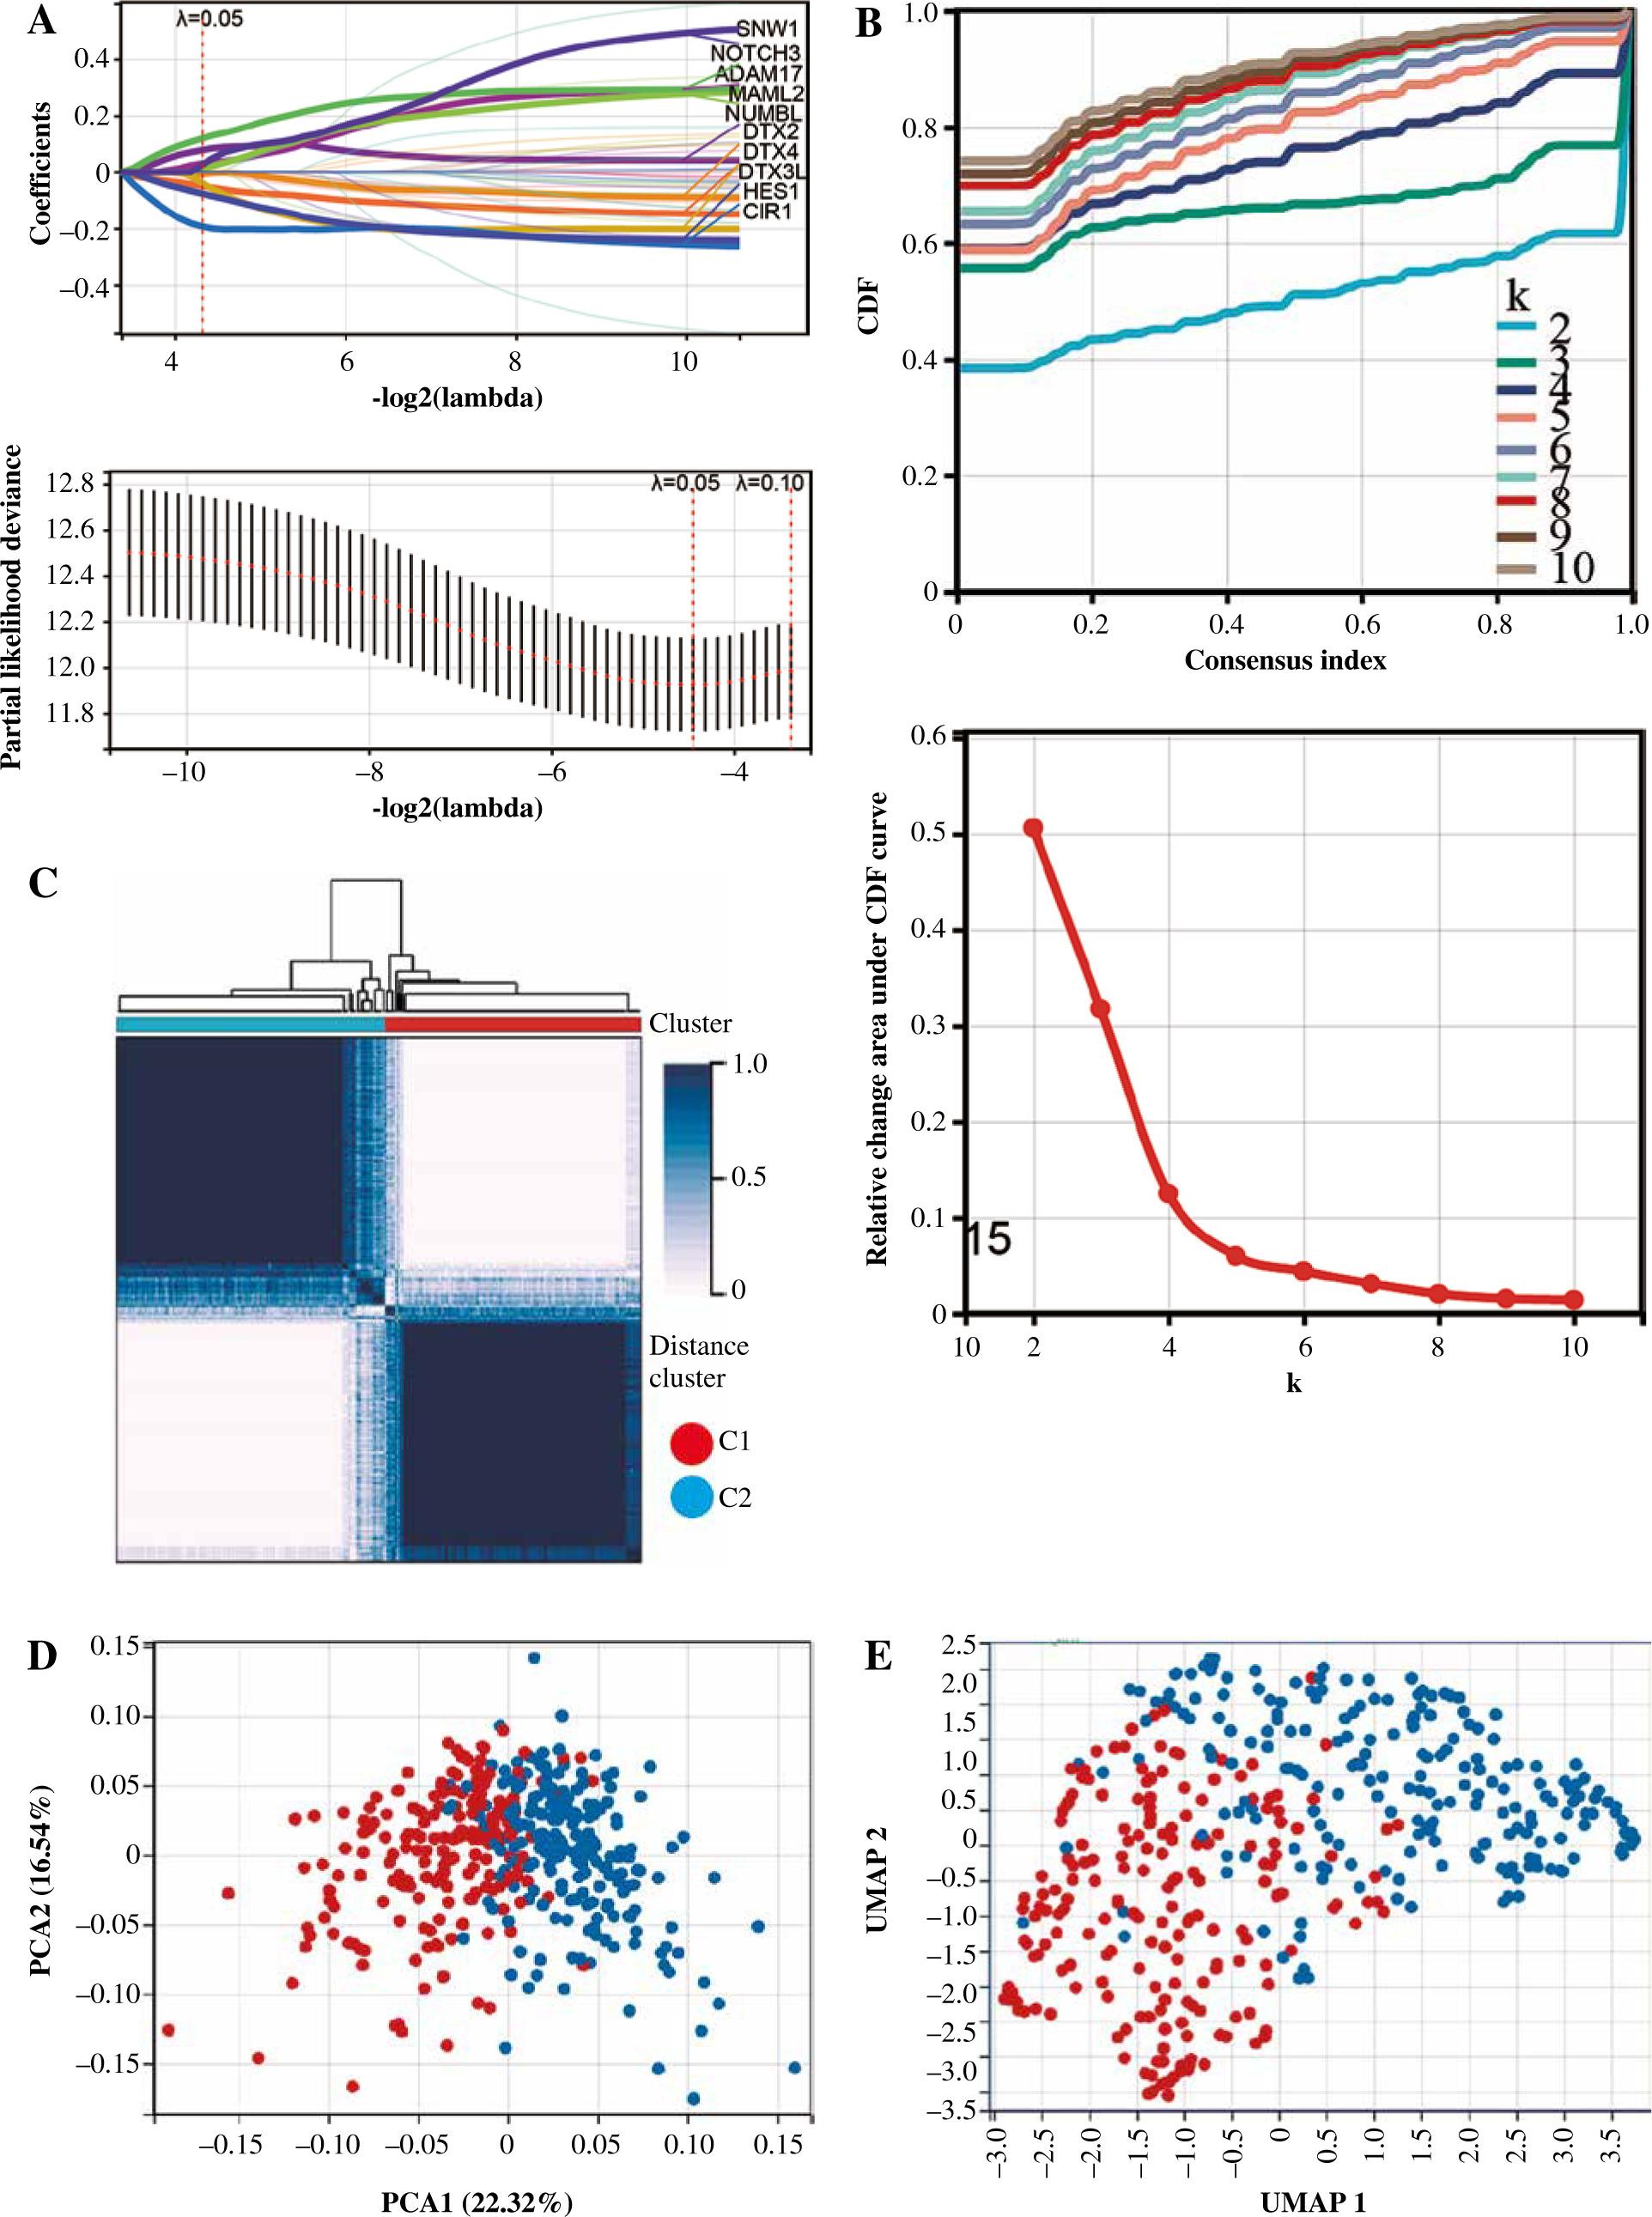
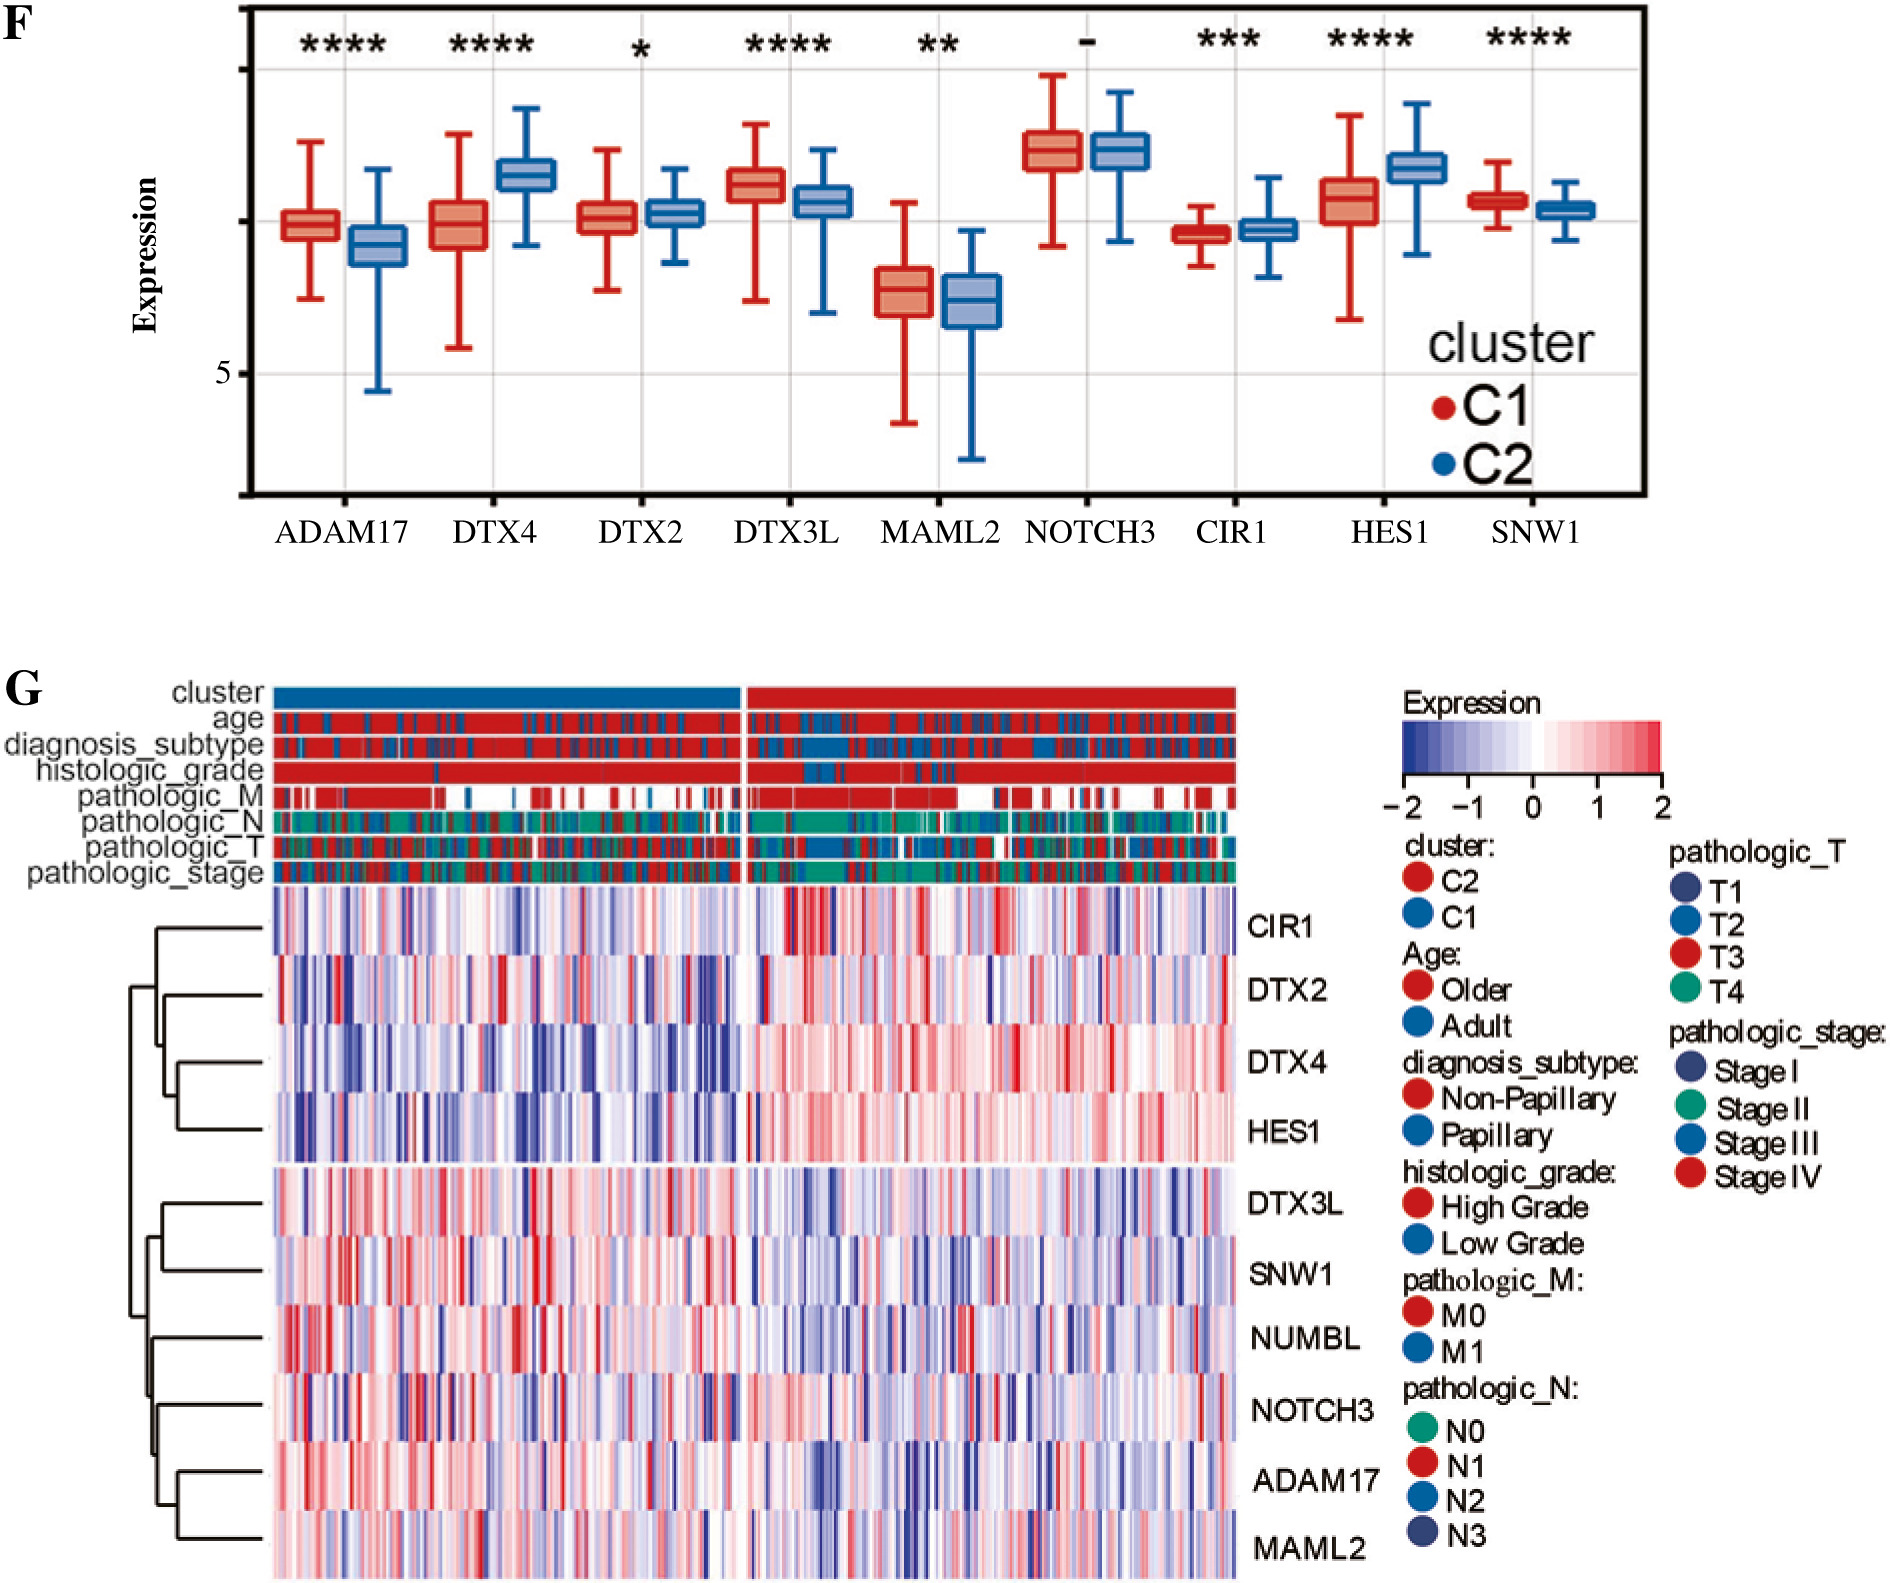
We analyzed these genes according to survival time by Lasso and set the lambda value at 0.0501732887259597. Finally, we obtained 10 genes closely related to survival time: SNW1, NOTCH3, ADAM17, MAML2, NUMBL, DTX2, DTX4, DTX3L, HES1, CIR1 (Fig. 2A). Based on the expression levels of these 10 genes, optimal clustering stability was achieved when K = 2 (Fig. 2B); all patients with bladder tumors could be divided into 2 subtypes: C1 (n = 199) and C2 (n = 208) (Fig. 2C). After UMAP analysis and PCA analysis of these two subtypes, it was found that this typing method was able to clearly distinguish the two groups of patients with bladder cancer (Fig. 2D, E). Further analysis showed differences in the expression patterns of these 10 genes in C1 and C2 (Fig. 2F, G), with six genes (ADAM17, DTX3L, MAML2, SNW1, NOTCH3, NUMBL) significantly upregulated in C1; four genes (DTX4, DTX2, CIR1, HES1) were significantly down-regulated in C1.
Fig. 2
Clustering analysis of bladder cancer based on Notch-related gene expression profiling. A) Lasso-Cox regression analysis and partial likelihood deviance for the Lasso regression. B) Consensus cumulative distribution function (CDF) plot and delta area (change in CDF area) plot of K from 2 to 5. C) Consensus clustering matrix for k = 2. D) PCA analysis confirmed the classification. E) UMAP analysis confirmed the classification.
Analysis of prognosis in different groups of patients with bladder cancer
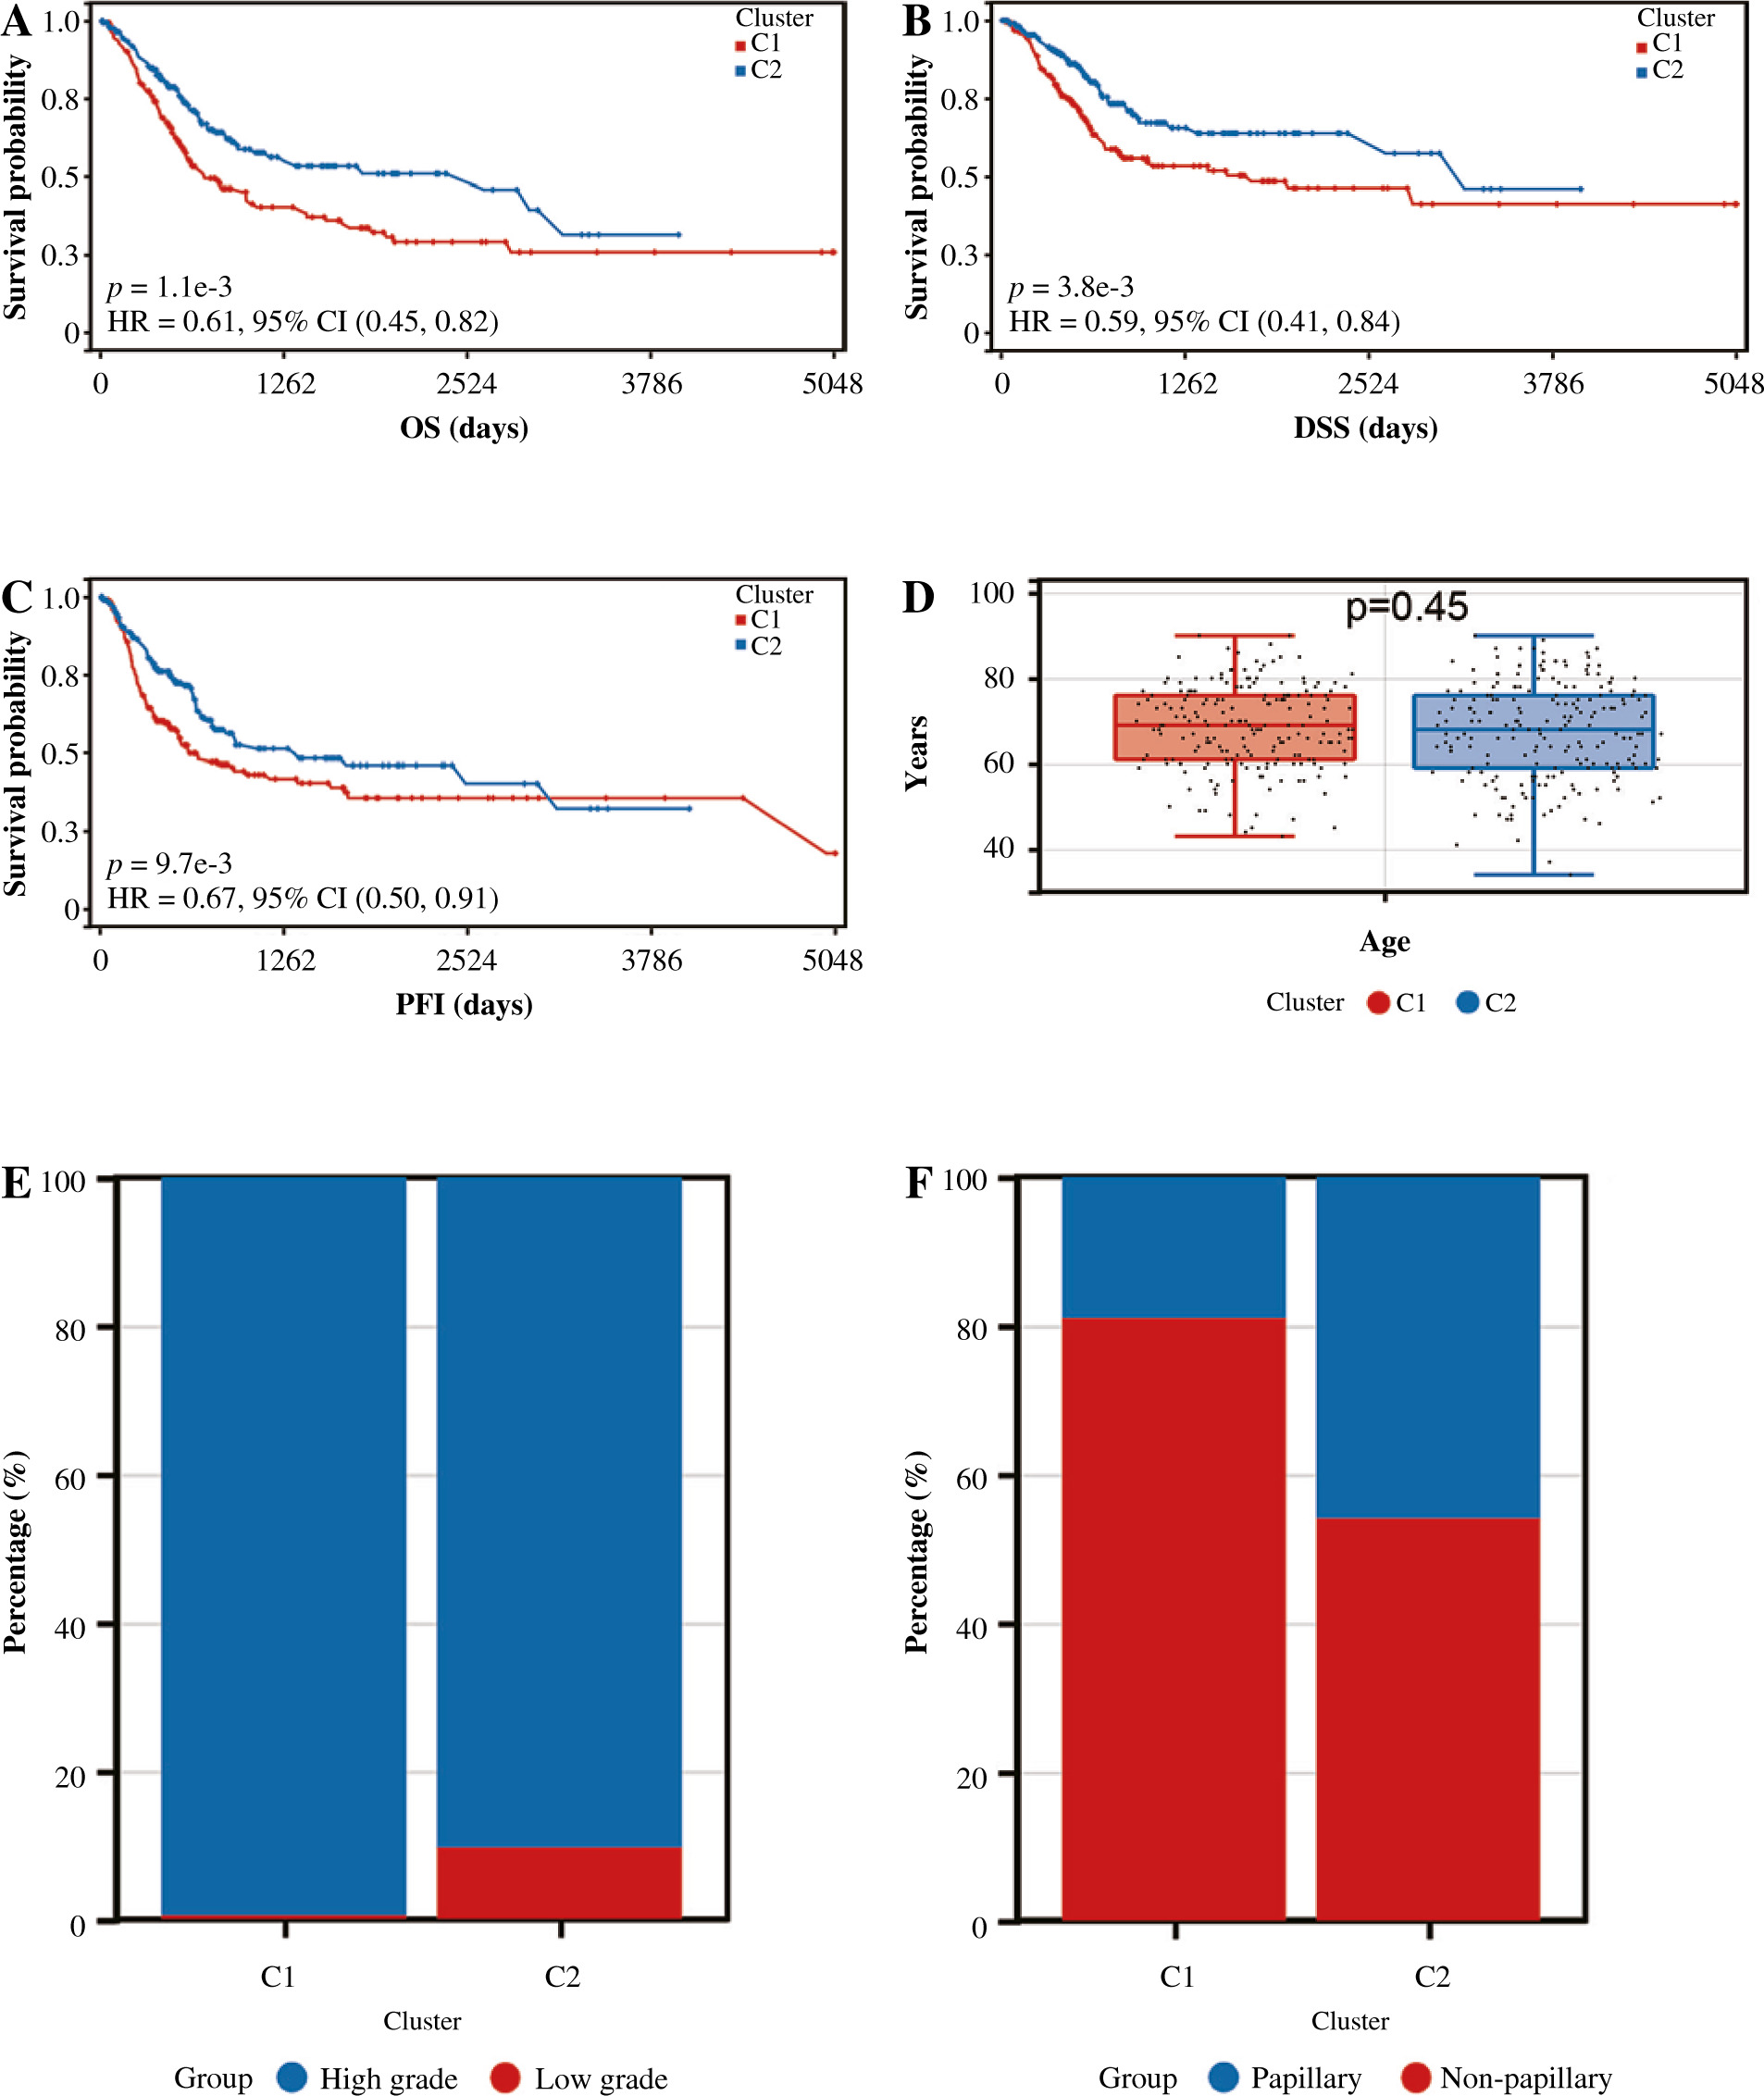
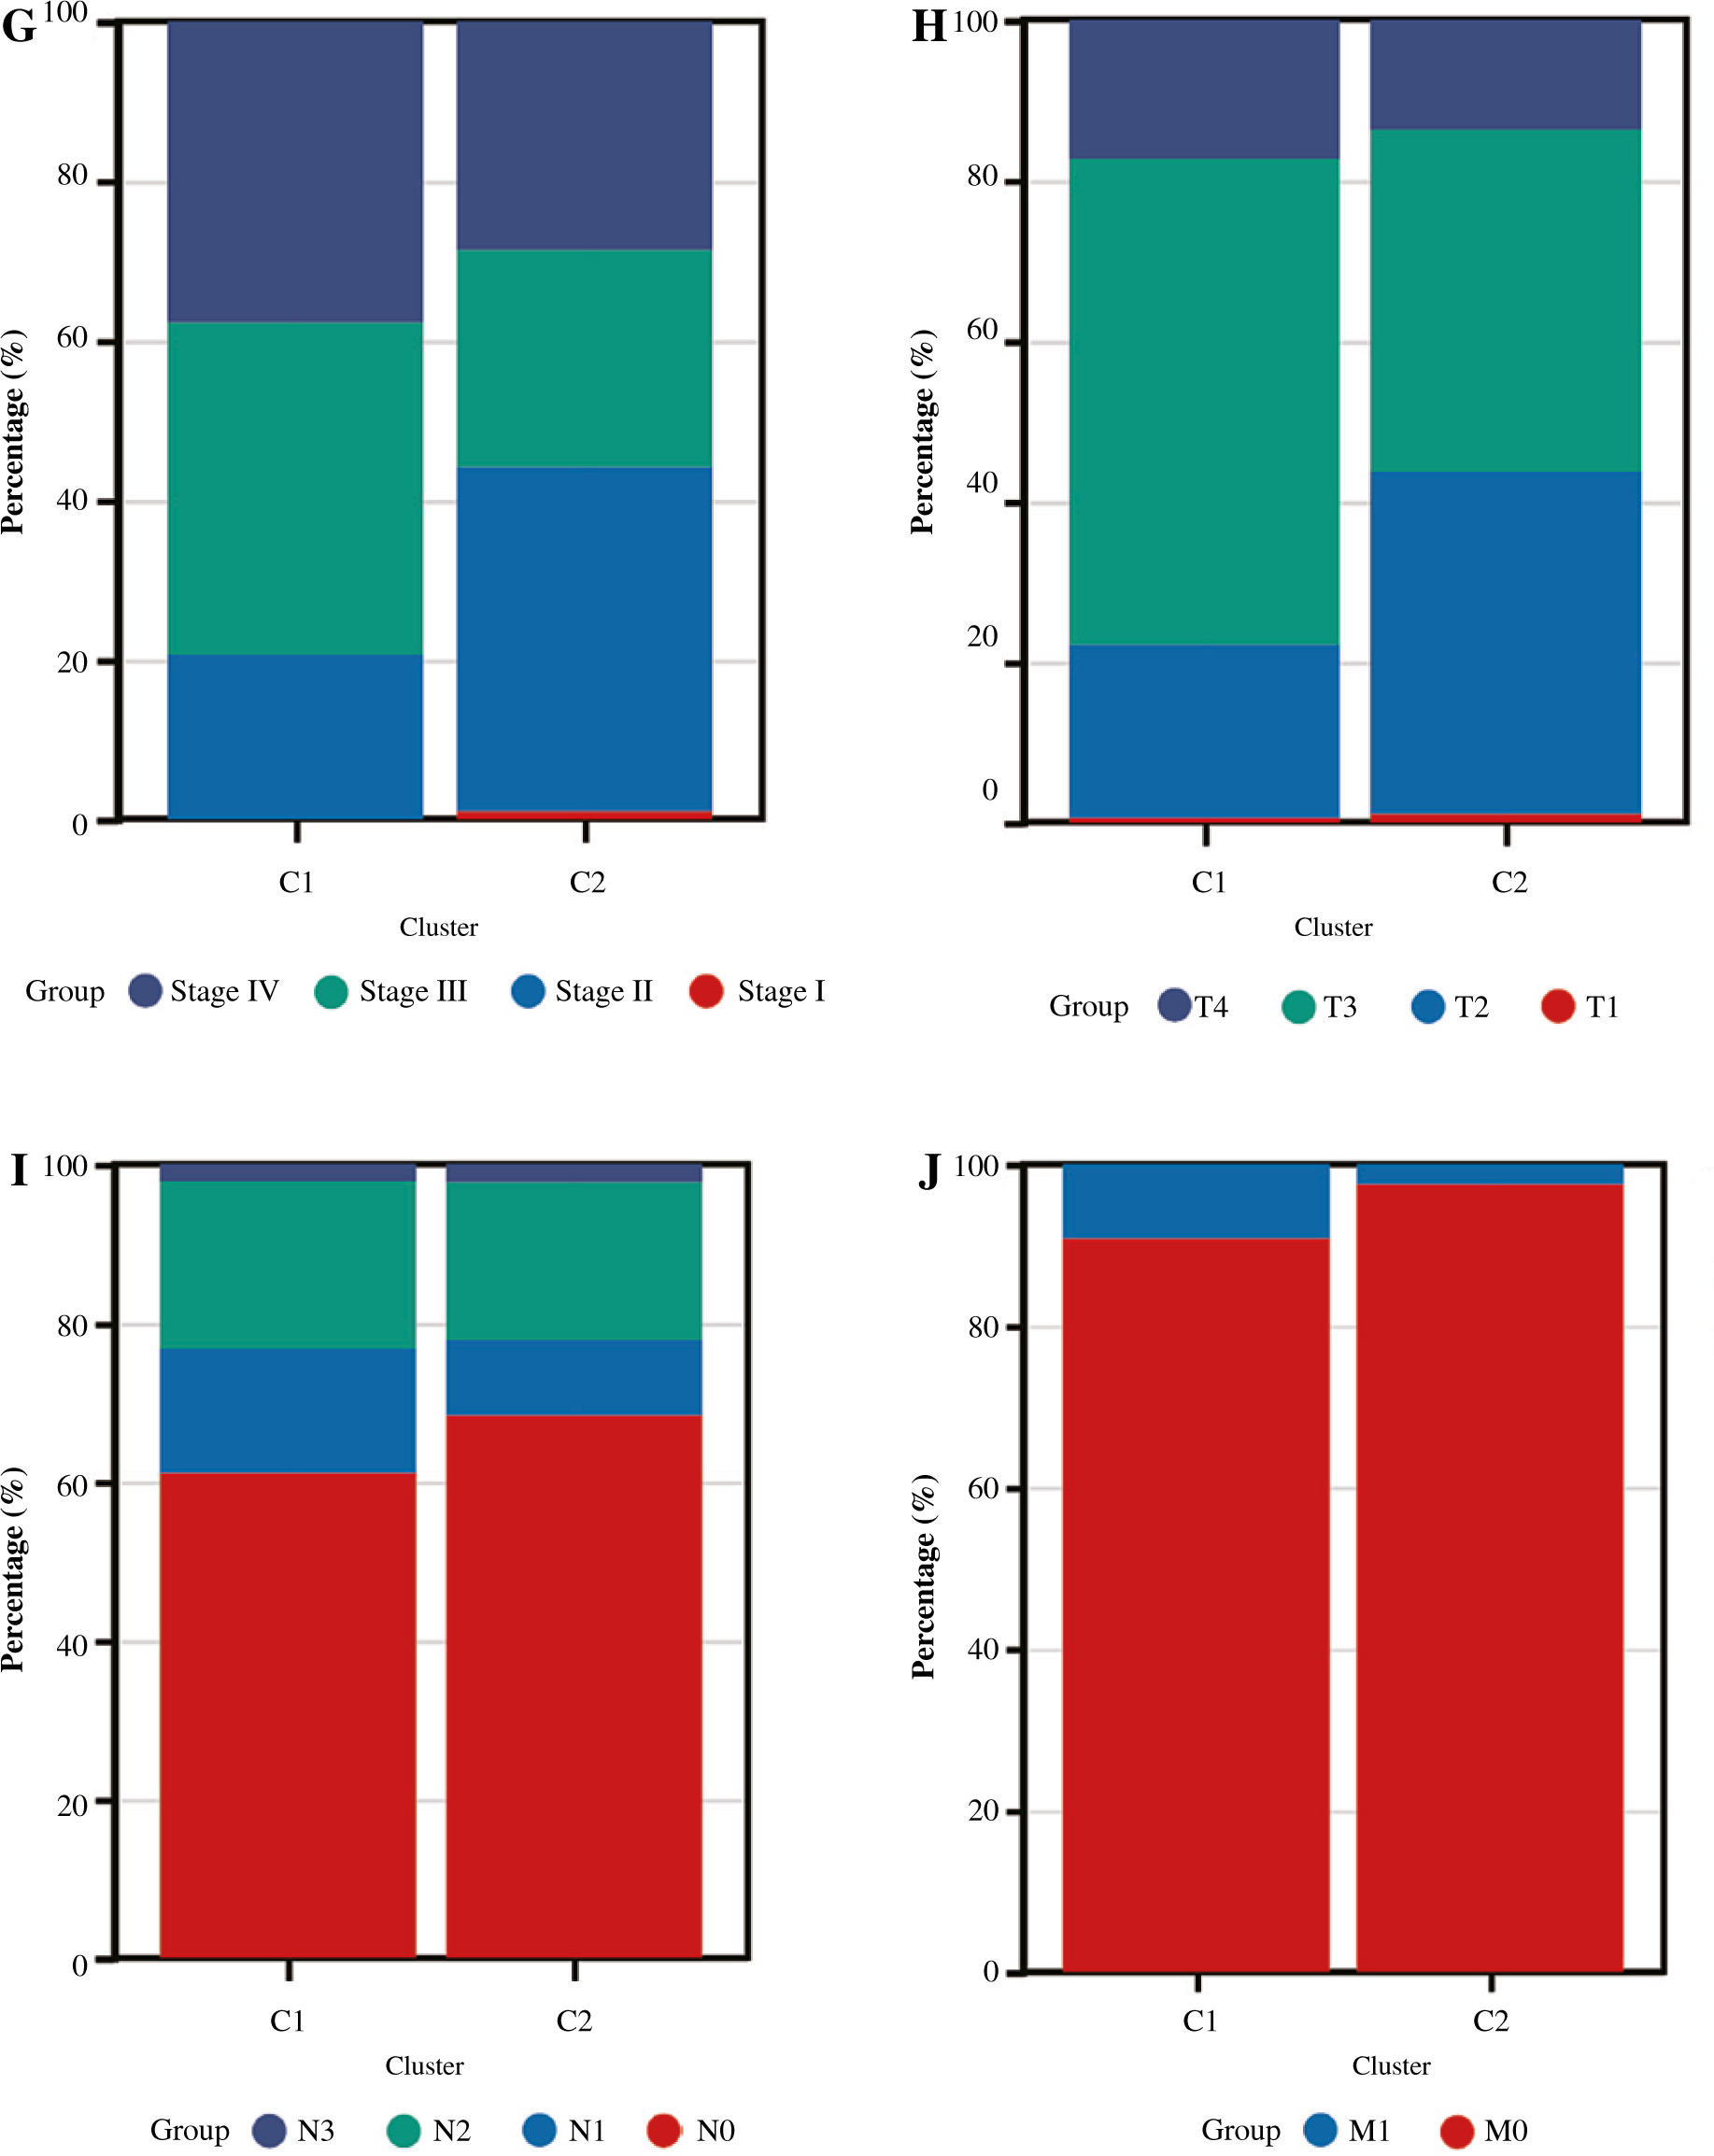
We analyzed the difference in prognosis between the C1 and C2 groups, finding that overall survival (OS), disease-specific survival (DSS) and progression-free interval (PFI) were also associated with worse survival outcomes in Group C1 than in Group C2 (Fig. 3A-C). There was no significant difference in age between Group C1 and Group C2, but the percentage of non-papillary bladder cancer and percentage of bladder cancer with a high grade in Group C1 was higher than that in Group C2; furthermore, pathological TNM staging was more severe in Group C2 than in Group C1 (Fig. 3D-J, Table 1). The differences in pathological characteristics between Group 1 and Group C2 can be seen more directly in Figure 3K, L.
Fig. 3
Prognostic analysis of bladder cancer based on Notch-related gene expression profiling. A-C) Kaplan-Meier (K-M) analyses of overall survival (OS), disease-specific survival (DSS), progression free interval (PFI) between Cluster 1 and Cluster 2. D-J) Systematic review of clinical parameters between Cluster 1 and Cluster 2
Analysis of correlation between immune prognosis and immune infiltration
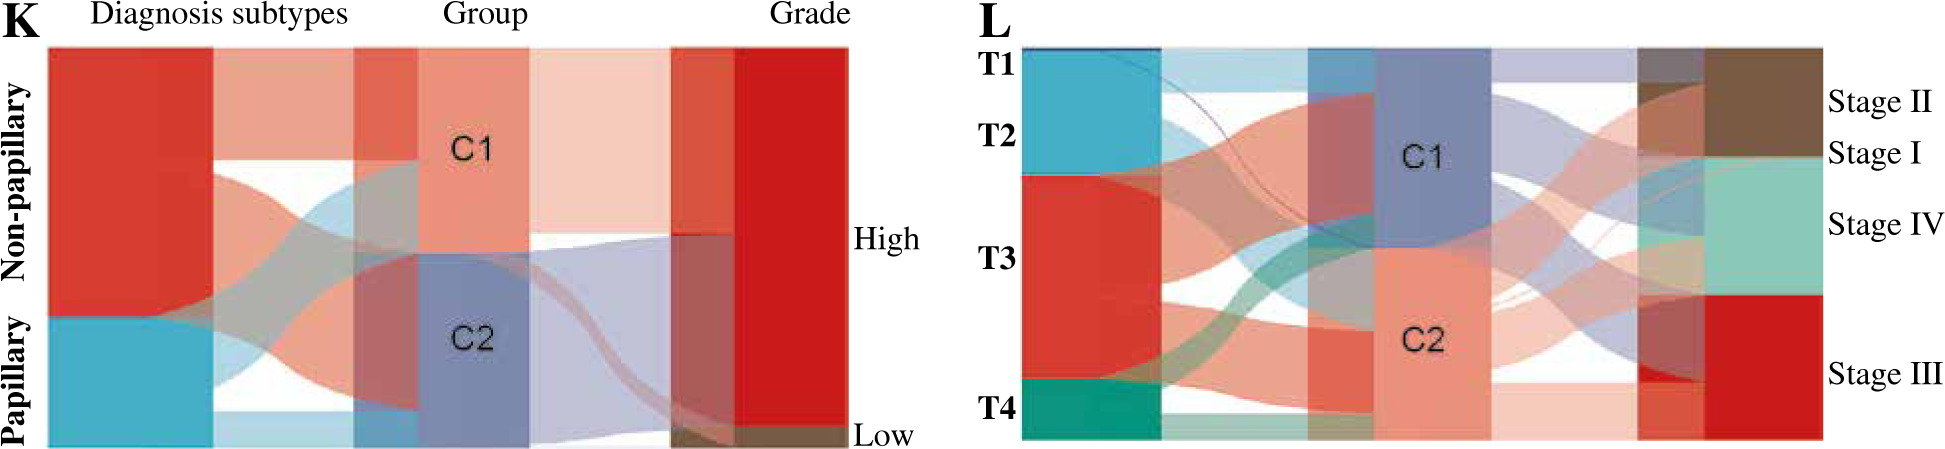
Next, we elucidated by GSEA a potential regulatory mechanism leading to a difference in prognosis between patients in group C1 and those in group C2. Adaptive immune system, innate immune system, lymphocyte and lymphocyte interactions, and cytokine signaling in the immune system are concentrated in group C1, and the expression was downregulated, whereas these signaling pathways were upregulated in Group C2 (Fig. 4A), so we suspected that the difference in prognosis between these two groups of patients may be related to immunity. In order to investigate the relationship between immune cell infiltration and C1 and C2 groups, we used the CIBERSORT method to evaluate the relative immune cell levels in the two groups of patients. Patients in Group C1 had significantly higher blood infiltration of T cells, CD8 T cells, cytotoxic lymphocytes, B lymphocytes, NK cells, monocyte lines, dendritic cells, and fibroblasts, and the infiltration of neutrophil and endothelial cells did not differ significantly from that of Group C2 (Fig. 4B, C). In addition to the individual immune cells, we also used ESTIMATE to create an immune correlation score, including the immune cell score, the stromal cell score, and the composite score; these scores were found to be higher in Group C1 than in Group C2 (Fig. 4D, E). To explore whether immunotherapy differed between Groups C1 and C2, we used tumor immunodeficiency and rejection analysis (TIDE) to assess whether patients in Group C1 had a higher TIDE score than those in Group C2; it suggested that patients in Group C1 had a stronger immune response than those in group C2 (Fig. 4F). Next, we predicted the immune response profile of patients in Groups C1 and C2 after the application of immunotherapy, and it was evident that the predicted response rate for immunotherapy was significantly lower in Group C1 than in Group C2 (Fig. 4G). All these observations indicate that the effect of immunotherapy in Group C1 may be worse than that in Group C2.
Fig. 4
Enrichment analysis and peripheral immune infiltration characteristics of Cluster 1 and Cluster 2 with distinct prognosis. A) Gene set enrichment analysis (GSEA) and landscape of tumor immune microenvironment between Cluster 1 and Cluster 2. B, C) Boxplots and heatmap showed immune cell infiltration differences between Cluster 1 and Cluster 2
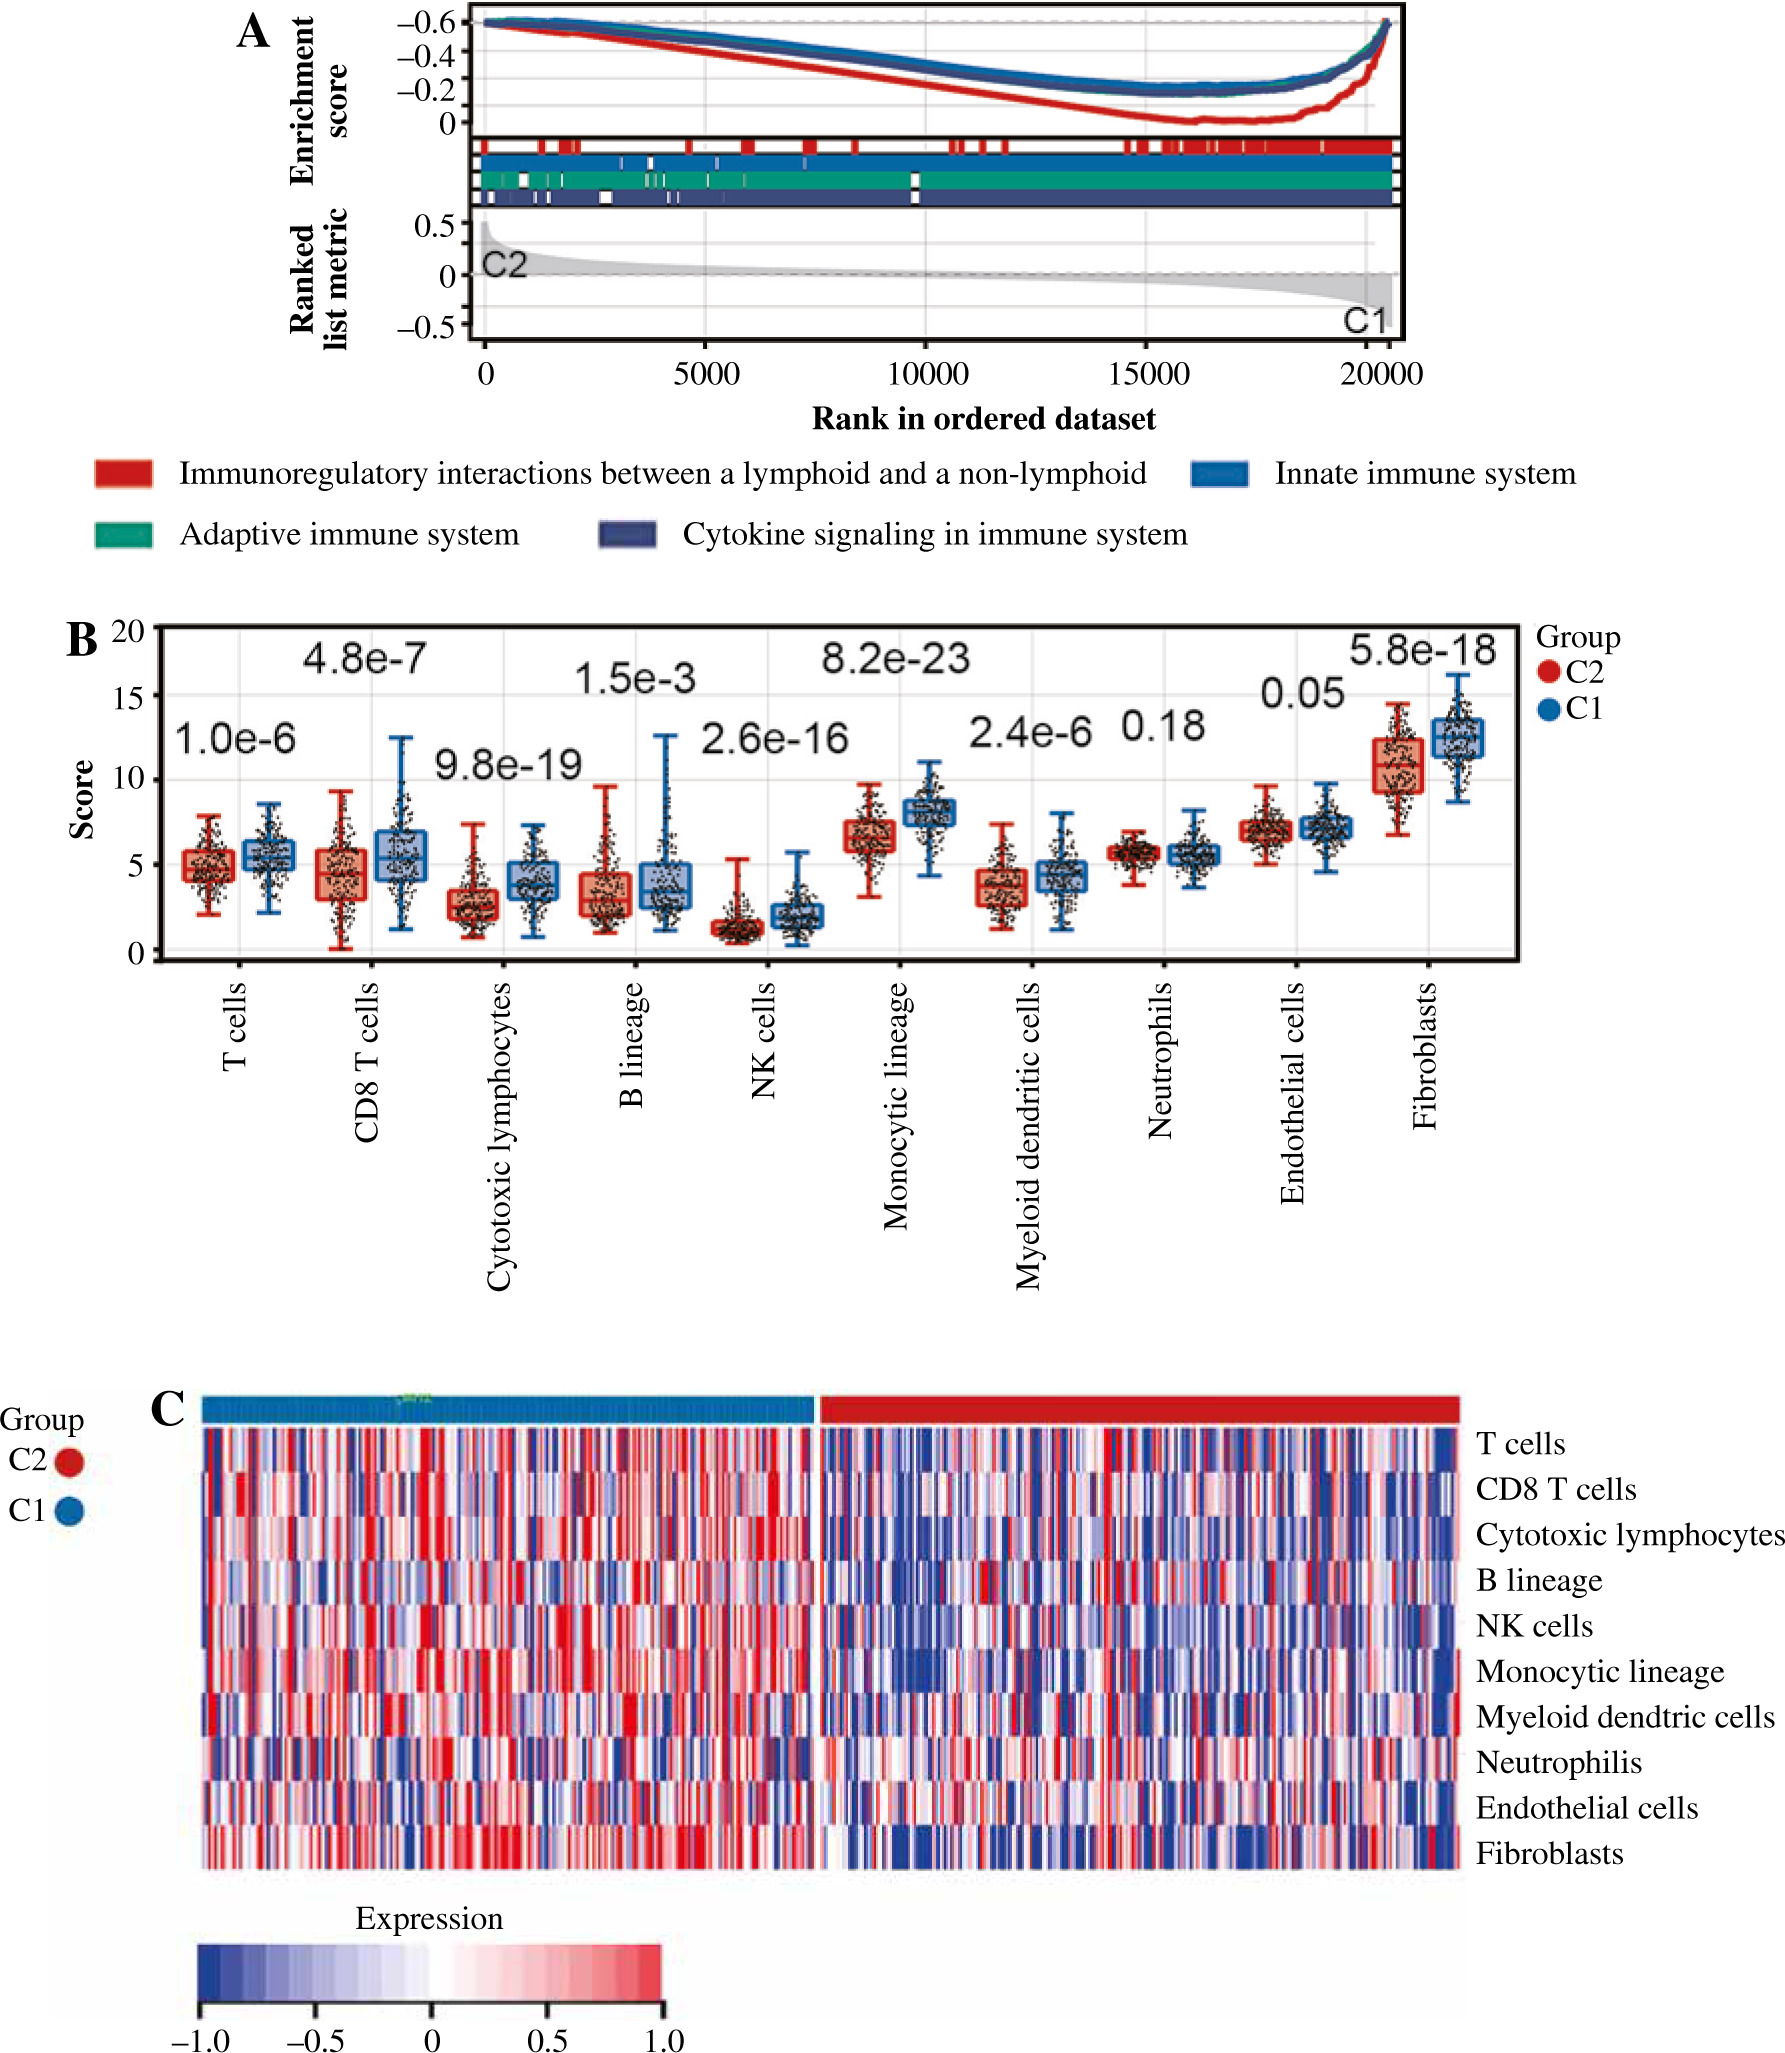
Fig. 4
Cont. D, E) Boxplots and heatmap showed immune - related score differences between Cluster 1 and Cluster 2. F) Boxplots showed TIDE score differences between Cluster 1 and Cluster 2. G) Column chart showed the response of Cluster 1 and Cluster 2 to immunotherapy
Fig. 4
Cont. H) The correlation matrix plot showed the correlation characteristics of 10 genes related to Notch signaling pathway with immune cells and immune correlation score. *p < 0.05, **p < 0.01, ***p < 0.001, and ****p < 0.0001
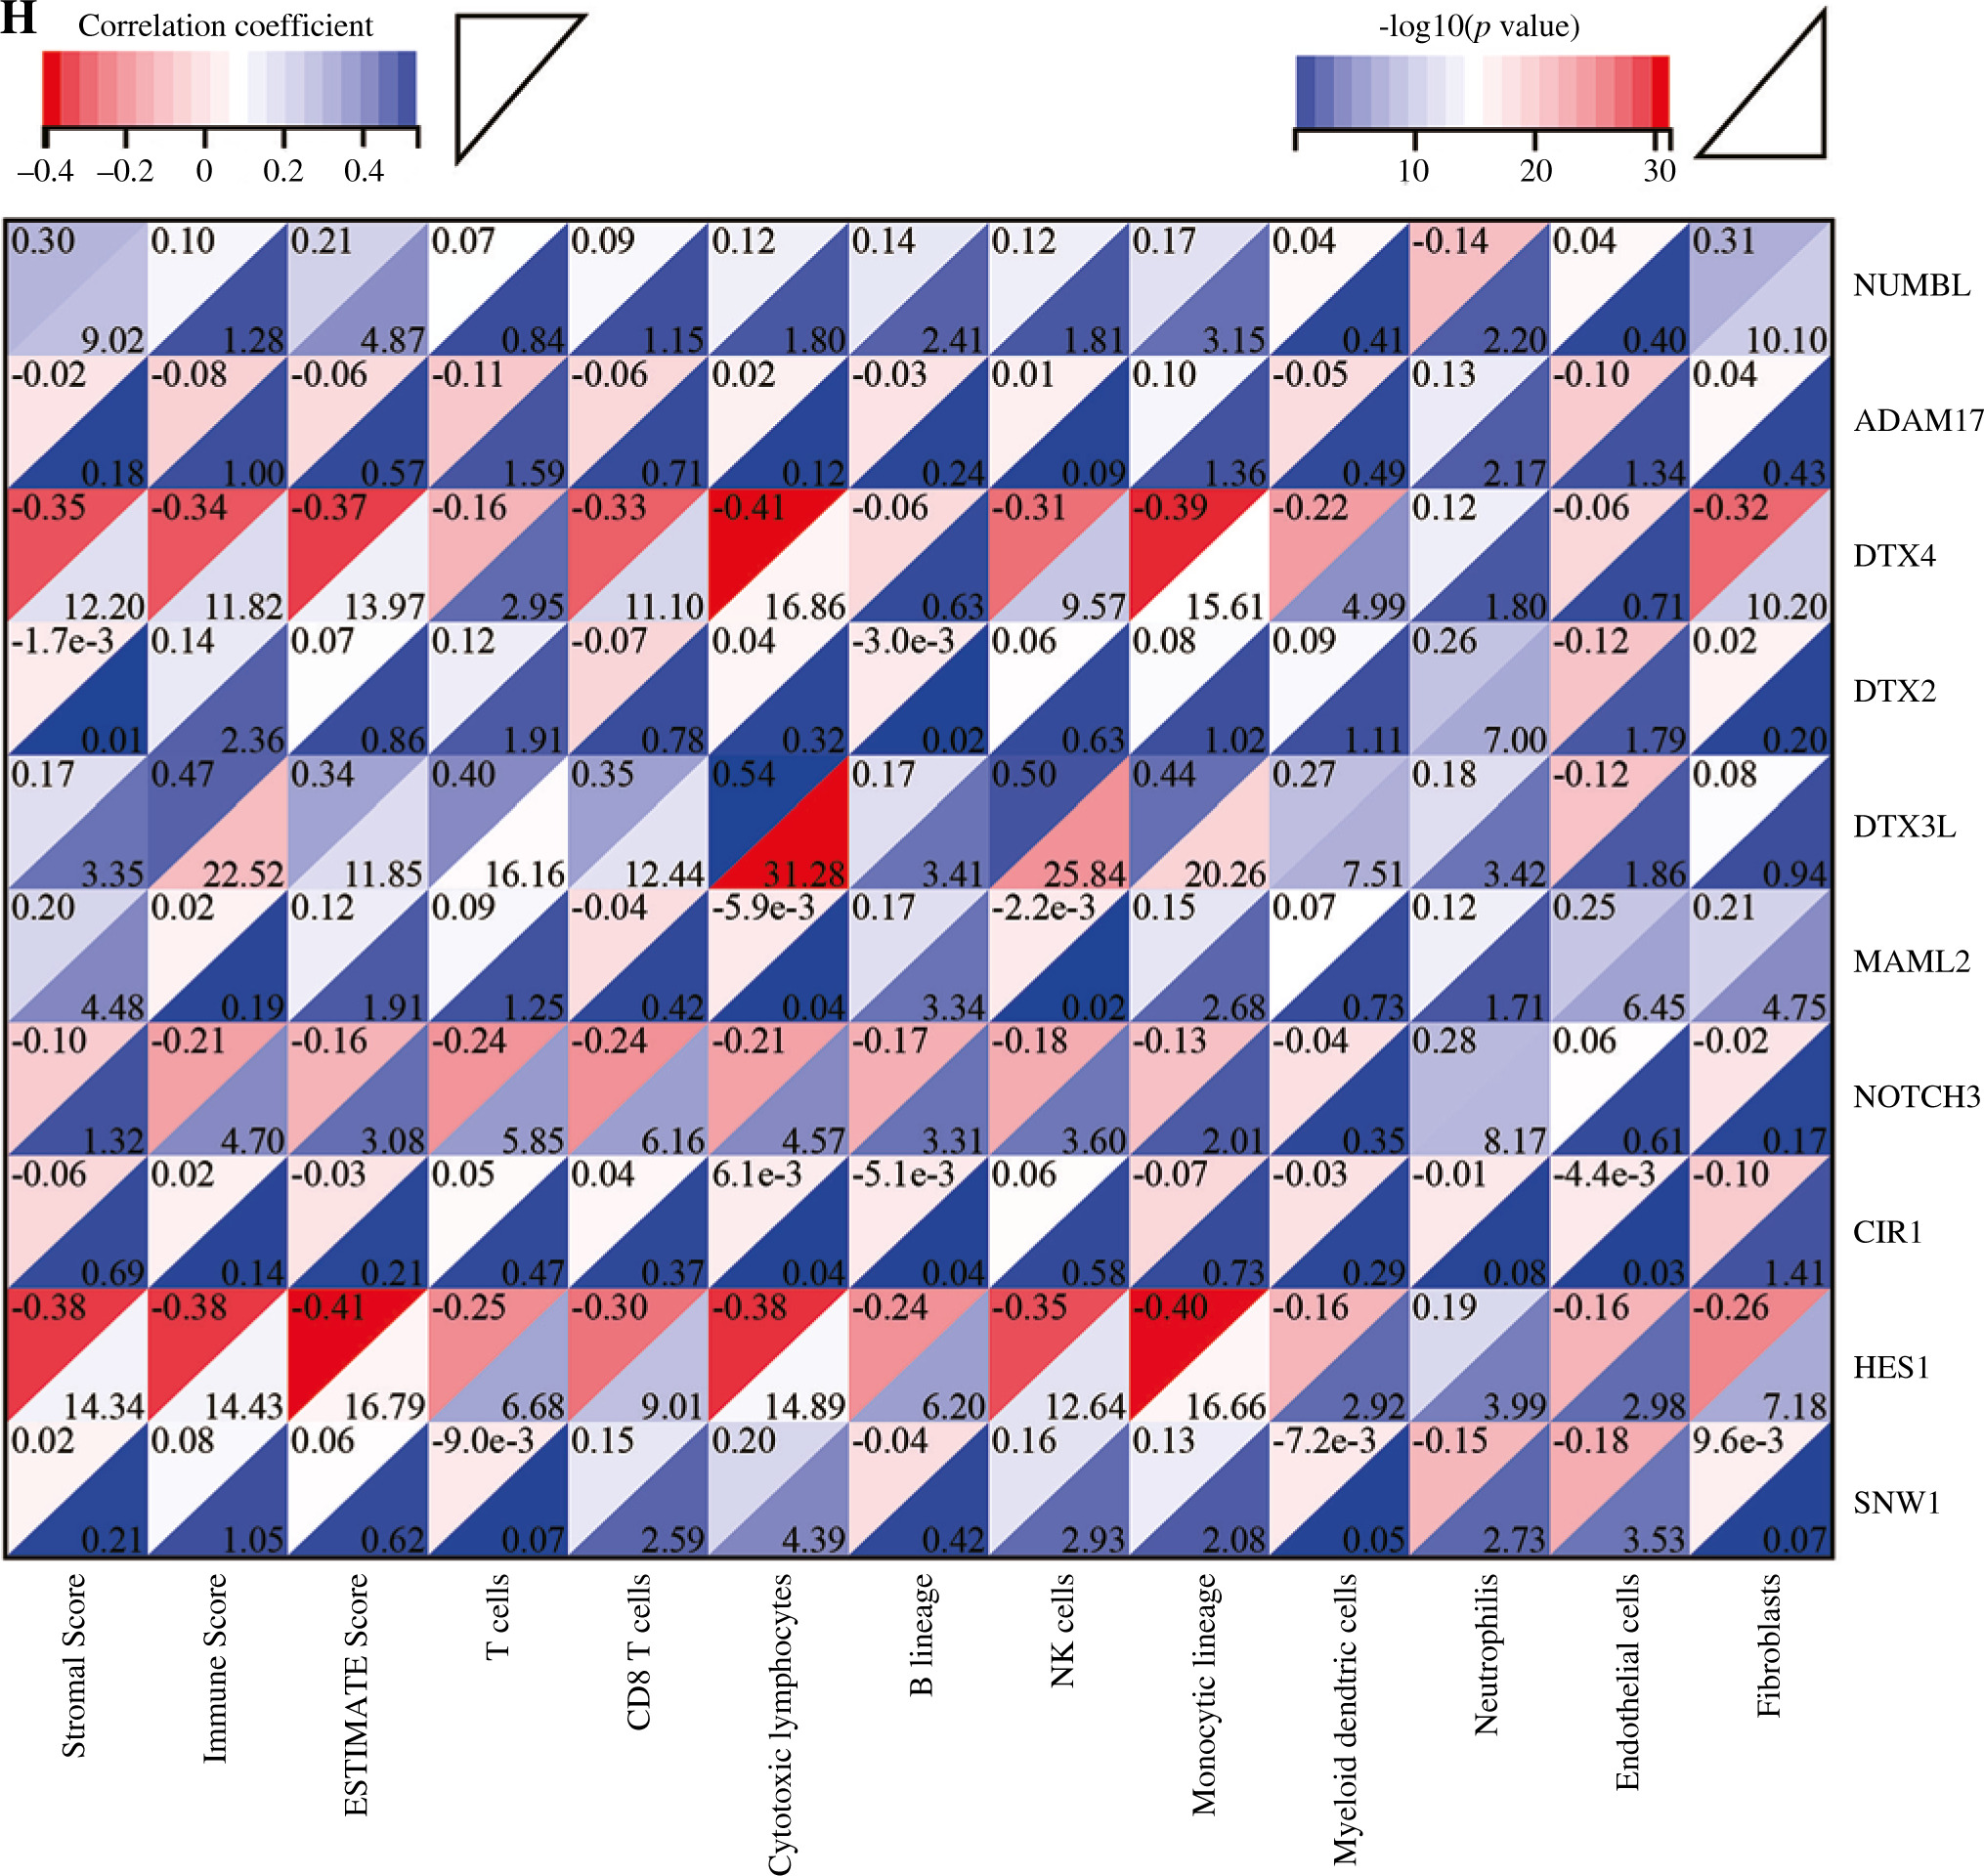
In addition, we analyzed associations between these 10 genes (SNW1, NOTCH3, ADAM17, MAML2, NUMBL, DTX2, DTX4, DTX3L, HES1, CIR1) and 10 immune cells and immune-related scores (Fig. 4H). The results showed that the NUMBL gene was positively correlated with the scores of fibroblasts and stromal cells, the DTX4 gene was negatively correlated with cytotoxic lymphocytes, NK cells, monocyte cell lines, fibroblasts, immune cell score, stromal cell score and general score, the DTX3L gene was positively correlated with T cells, CD8 T cells, cytotoxic lymphocytes, NK cells, monocyte lines, stromal cell score and the composite score, the NOTCH3 gene was negatively correlated with T cells, CD8 T cells, endo- thelial cells, and immune cell scores, while the HES1 gene was negatively correlated with almost all immune cells.
Risk score correlation analysis
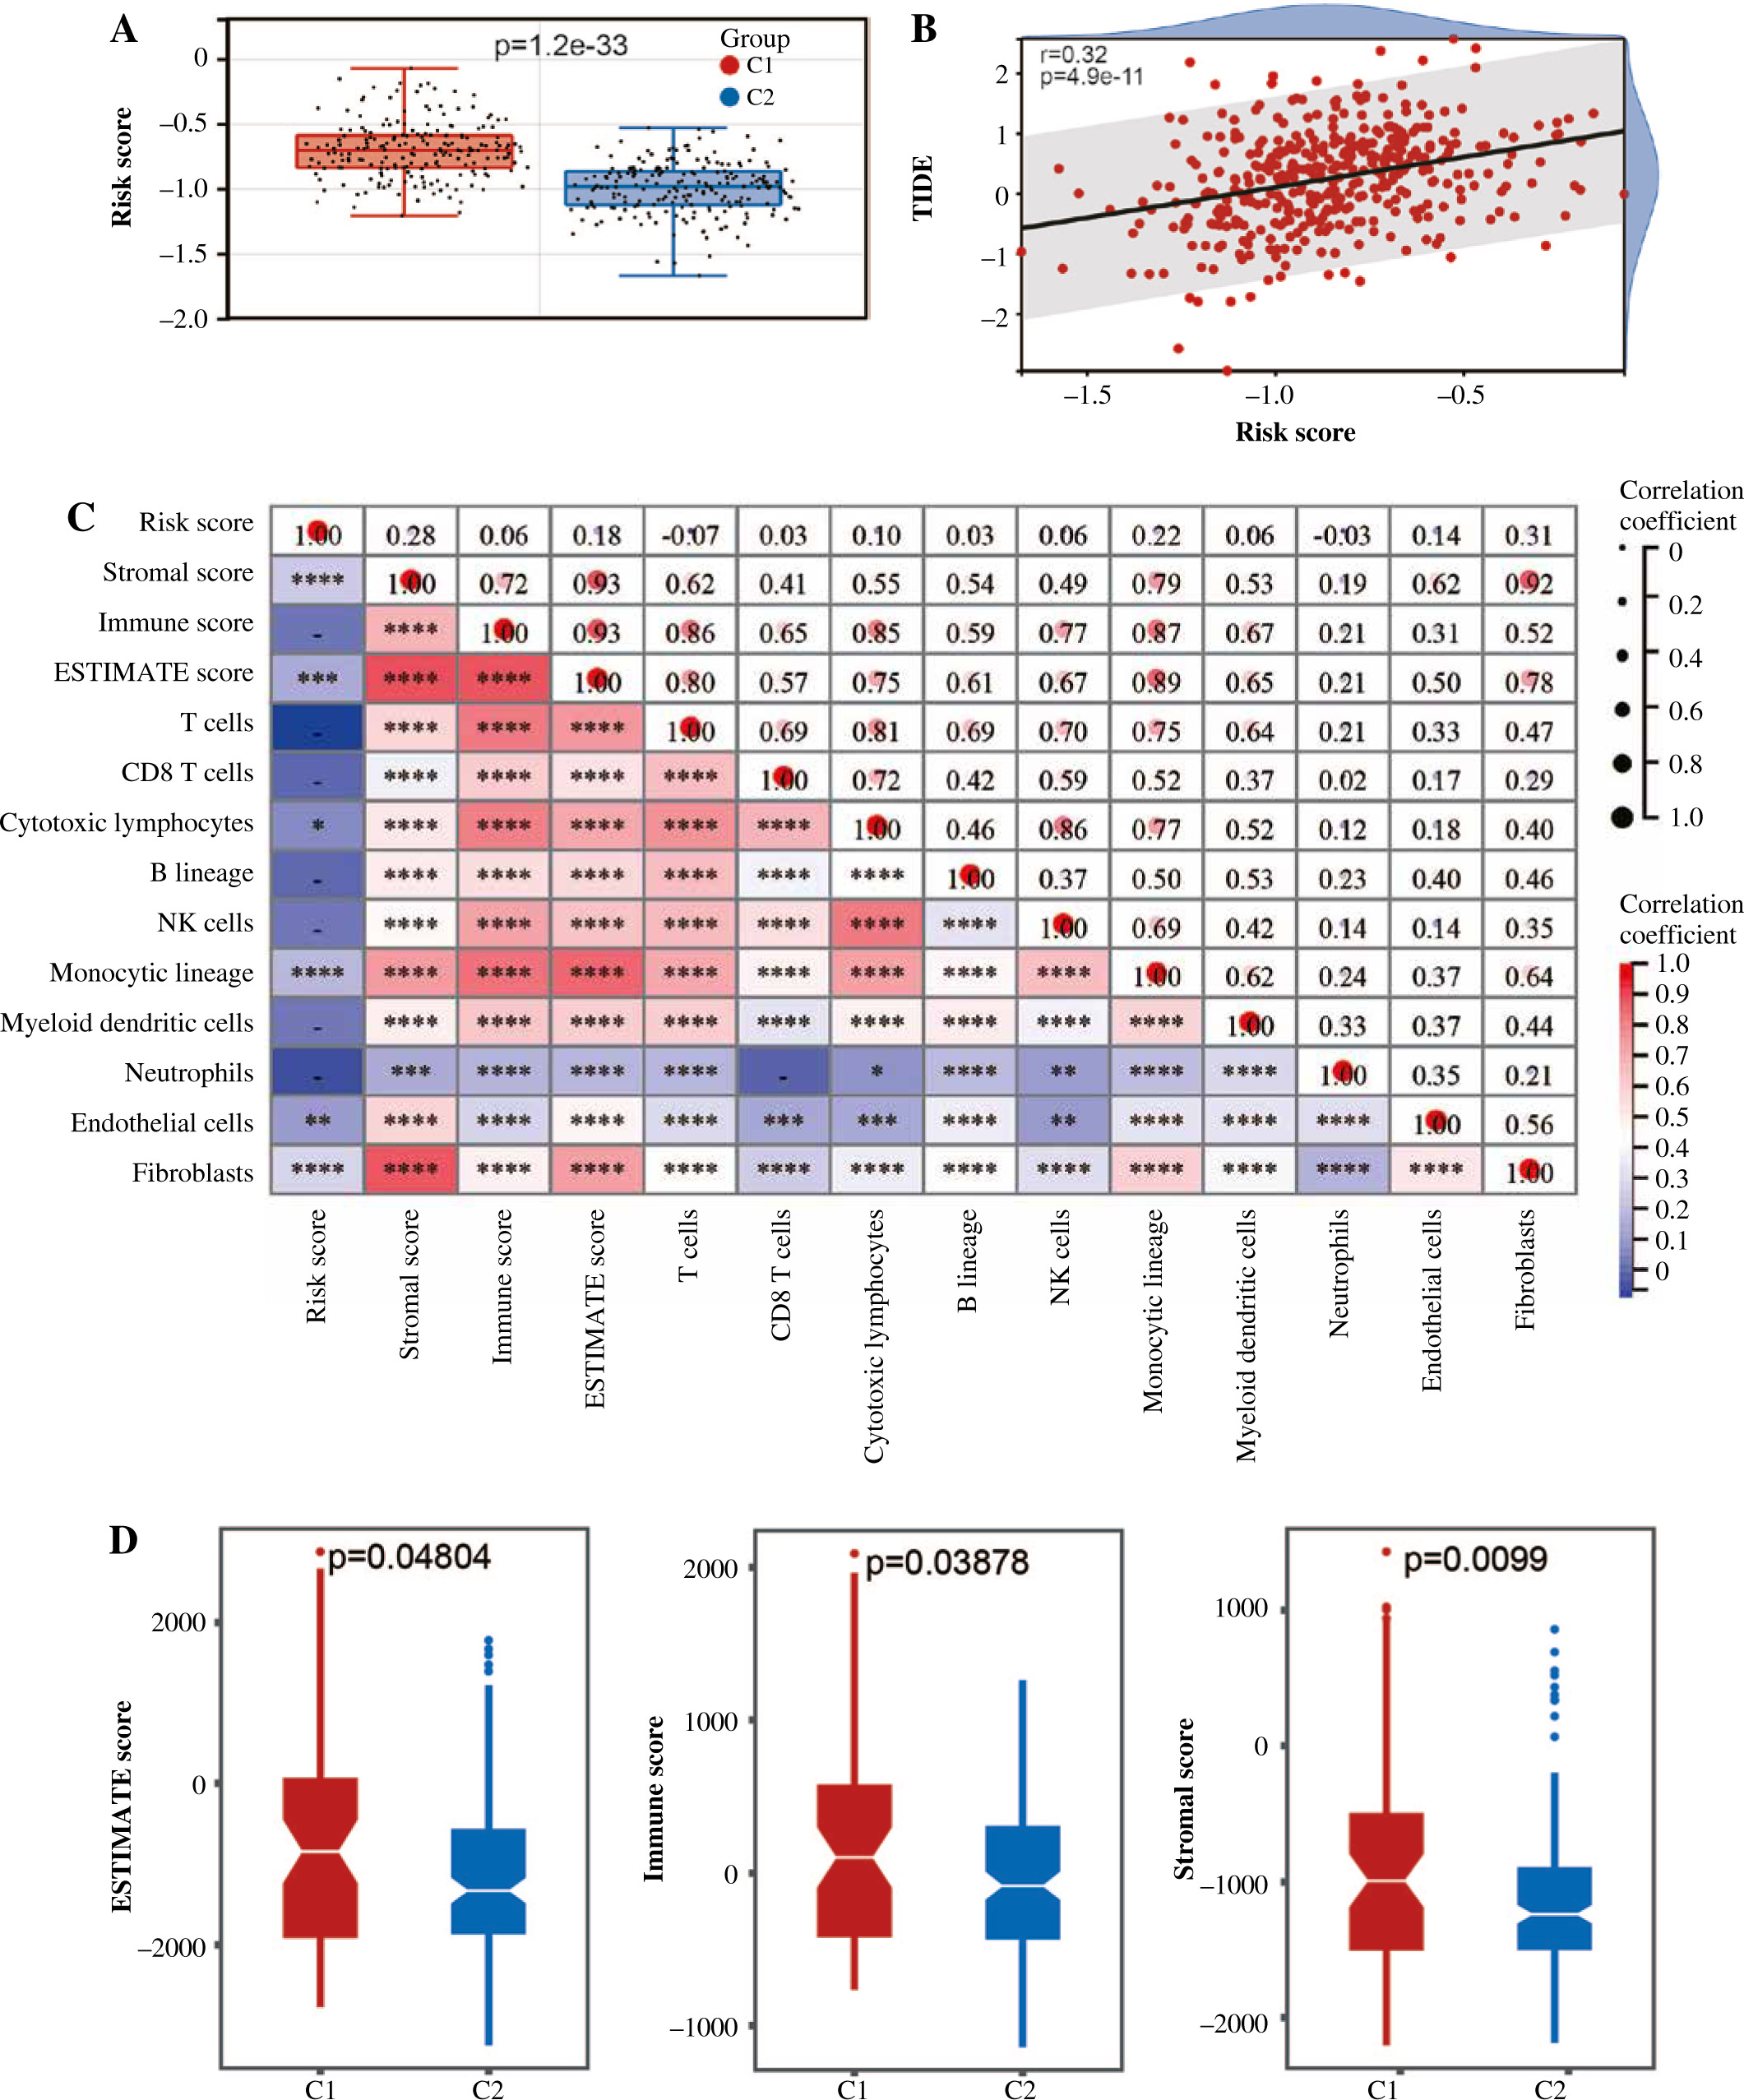
Based on the Lasso regression model, we calculated the risk score for each patient in the C1 and C2 groups. The risk score in the C1 group was significantly higher than that in the C2 group (Fig. 5A). Additionally, risk score was mainly correlated with stromal cell score, monocyte cell line and fibroblasts, while the correlation with other cells was weak (Fig. 5B). Next, we analyzed the correlation between TIDE score and risk score, and we found that there was also a positive correlation between TIDE score and risk score (Fig. 5C).
Fig. 5
Risk score correlation analysis. A) Boxplots showed risk score differences between Cluster 1 and Cluster 2. B) The correlation matrix plot showed the correlation characteristics of the risk score with 10 immune cells and the immune - related score. C) The Spearman correlation between TIDE score and risk score is shown. D) Boxplots show immune-related score differences between Cluster 1 and Cluster 2 in GSE13507
Validation of relationship between classification of BC based on NRG expression and immunity
To validate the relationship between classification of BC based on NRG expression and immunity, GSE13507 was selected as an external dataset for further analysis. Similar to results in TCGA, immune correlation scores, including the immune cell score, the stromal cell score, and the composite score were higher in Group C1 than in Group C2 in ESTIMATE analysis (Fig. 5D). However, relative immune cell levels in the two groups of patients showed no remarkable difference except T cells, cytotoxic lymphocytes, neutrophils and endothelial cells in the CIBERSORT method (Fig. 5E). Additionally, Group C1 had a worse prognosis and lower TIDE score than Group C2 (Fig. 5F, G). It was found that patients in Group C1 had a stronger predicted immune response than those in Group C2 (Fig. 5H).
Fig. 5
Cont. E) Boxplots show immune cell infiltration differences between Cluster 1 and Cluster 2 in GSE13507. F) Kaplan-Meier (K-M) analyses of OS between Cluster 1 and Cluster 2 in GSE13507. G) Boxplots show TIDE score differences between Cluster 1 and Cluster 2. H) Response of Cluster 1 and Cluster 2 to immunotherapy
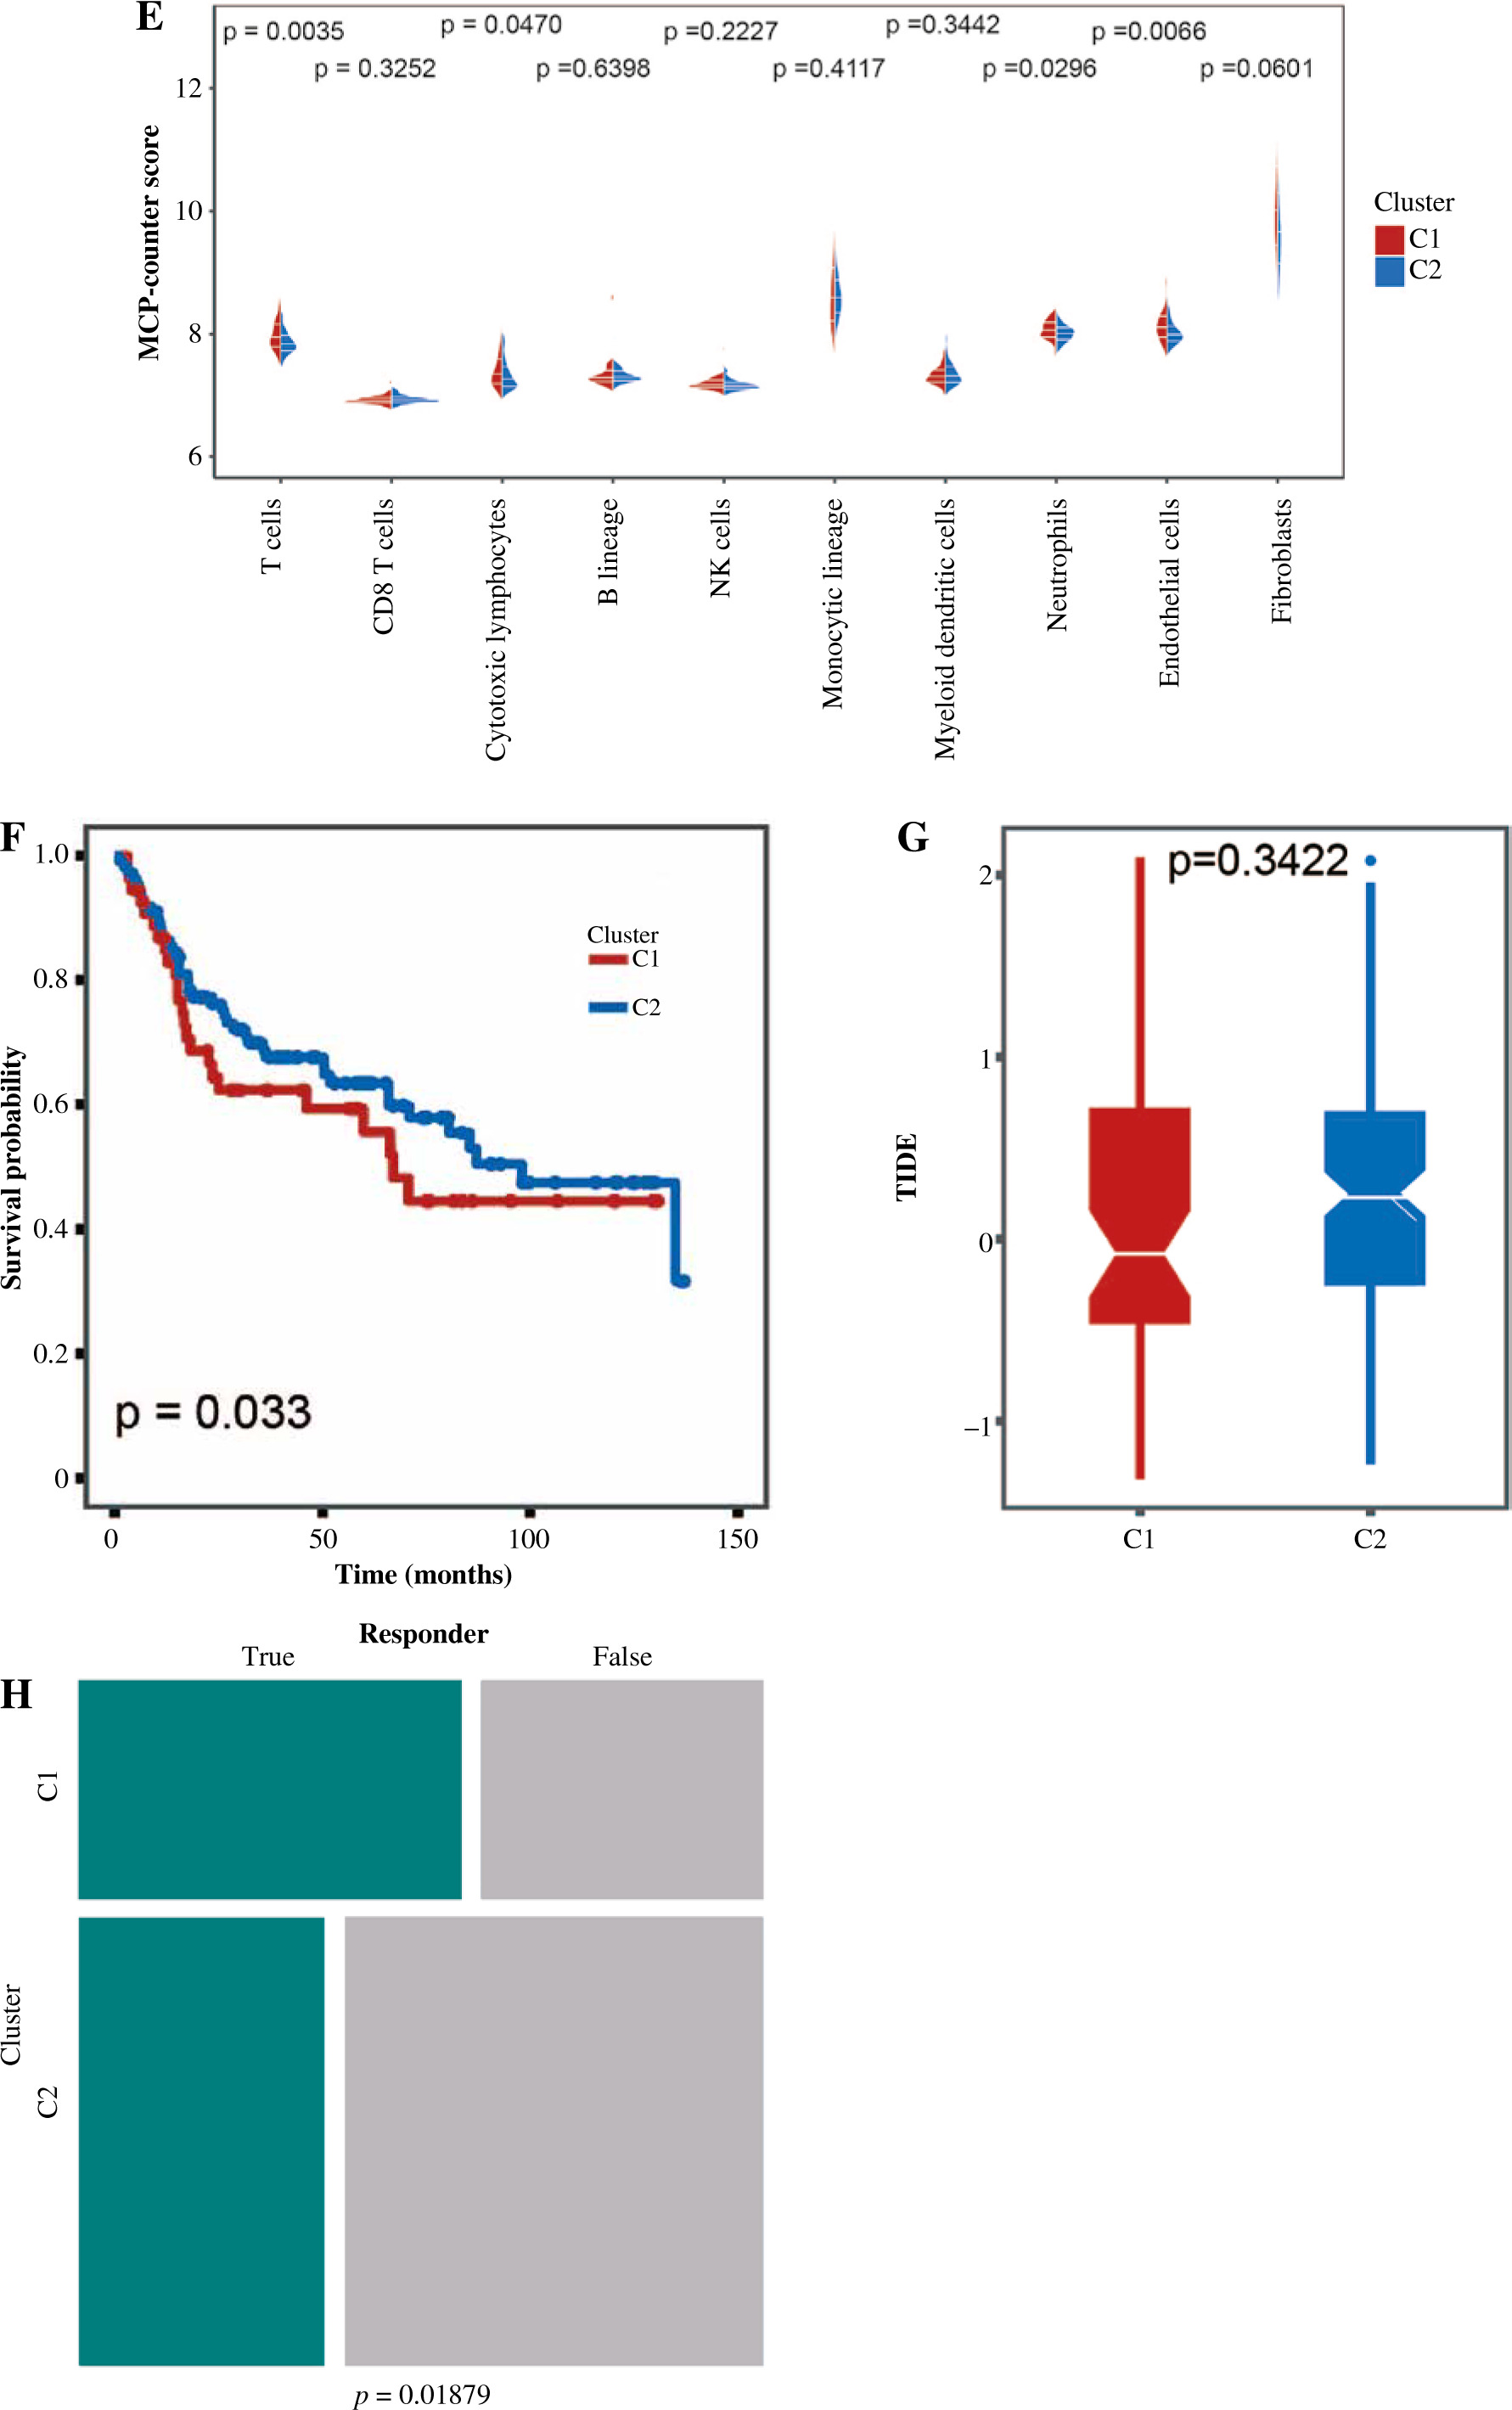
Table 1
Comparison of clinical characteristics between Groups C1 and C2
Discussion
In the past few decades, great progress has been made in the diagnosis and treatment of bladder cancer, but some patients have relapsed or even progressed after treatment; therefore, we need to find a new prognostic biomarker and treatment for bladder cancer to better provide a new strategy for early diagnosis, disease treatment and prognosis. Previous studies have shown that Notch signaling is an evolutionarily conserved pathway and that unlike other signaling pathways, the typical Notch signaling pathway has no intermediate products; instead, Notch receptors undergo three divisions to release the Notch intracellular domain (ICD), enabling it to transfer to the nucleus and regulate the transcription of target genes [17-19]. In addition, unlike other signaling molecules that can be secreted remotely, ligands of the Notch signaling pathway are generally thought to signal to adjacent target cells or target organs via paracrine or paracrine routes; this affects gene expression in adjacent tissues [20, 21]. In the case of cancer, Notch signaling can both directly promote and inhibit a variety of tumor cells and regulate the process of tumor progression by regulating the TME. Although the role of Notch signaling in the development of bladder cancer has been increasingly appreciated, the relationship between Notch signaling and the prognosis of bladder cancer has rarely been studied.
In this study, we collected as many relevant gene expression and clinical characteristics of bladder cancer patients and normal individuals with clinical parameters as possible from public databases; firstly, the differences of Notch signaling pathway-related genes between the normal and bladder cancer patients were analyzed. The results showed that RFNG, KAT2A, PSENEN, APH1A, NCSTN, DTX4, DTX2, Notch3 were highly expressed in the patients with bladder cancer, and the expression of MAML3, KAT2B, MAML1, NOTCH1, NOTCH2, MAML2, NOTCH4, DLL1, DLL4 was down-regulated, which was consistent with the results of previous studies [22]. This suggests that different genes in the Notch signaling pathway play different roles in the development of bladder cancer. For patients with bladder cancer, we also constructed a heat map to visualize differences in Notch signaling- related genes in histopathology, age, past recurrence, molecular and morphological features, and survival outcomes; it can be seen that the gene expression of the Notch signaling pathway is not consistent in different pathological subtypes, different clinical stages and different ages of bladder cancer; we therefore speculate that Notch signaling may serve as an important biomarker to predict survival and immune status in patients with bladder cancer.
Using Lasso-Cox regression analysis, we identified 10 genes (SNW1, NOTCH3, ADAM17, MAML2, NUMBL, DTX2, DTX4, DTX3L, HES1, CIR1) that were closely related to the prognosis of bladder cancer; unsupervised concordance cluster analysis was performed to divide bladder cancer into two subtypes, Group C1 and Group C2. Clinical characteristics were analyzed for group C1 and Group C2; they mainly included age, pathological subtype, histological grade and TNM stage; combined with the difference in prognosis between Group C1 and Group C2, this Notch signaling pathway-based approach to bladder cancer typing can predict the survival of patients with bladder cancer.
TME consists mainly of blood vessels, immune infiltrates, fibroblasts and extracellular matrix around tumor cells; immune cell infiltration is closely related to the development, progression, prognosis and treatment of bladder cancer. We used the CIBERSORT method and ESTIMATE method to compare the difference of common cell and immune-related scores of TME. We observed that the immune cell score, stromal cell score and comprehensive score of Group C1 were higher than those of Group C2. We also used the TIDE score for both subtypes of bladder cancer and found that Group C1 also had stronger immune escape. Previous studies have shown that the stromal component as an independent prognostic factor affects the prognosis of tumors [23]. We therefore speculate that one reason for the worse prognosis of patients in Group C1 is because of the stronger immune resistance in Group C1, and another may be related to the remodeling of stromal components in the tumor microenvironment. In addition, our study suggests that patients with bladder cancer in Group C1 have a weaker ability to respond to immunotherapy and may not benefit from immunotherapy. We also analyzed 10 genes in the Notch signaling pathway that are closely associated with prognosis in the context of immune infiltration. For example, the DTX3L gene is positively associated with cytotoxic lymphocytes, and DTX3L is highly expressed in C1; it is suggested that the high expression of DTX3L is positively correlated with the poor prognosis of the patients, which is also consistent with the results of some previous studies [24].
Using a Lasso regression model, we obtained a risk score for bladder cancer classification based on Notch signaling, with Group C1 as the high-risk group and Group C2 as the low-risk group; a correlation analysis of the risk score with each immune cell and TIDE score found a positive correlation between the risk score and both the stromal component and TIDE score in the TME, which is also consistent with our previous conclusions.
In our study, we classified bladder cancer based on the Notch signaling pathway, and confirmed that some genes of the Notch signaling pathway can be used as potential biomarkers for risk prediction and to help improve clinical decision-making, but our study also had limitations similar to other bioinformatics approaches and lacked in vivo and in vitro experimental validation. Therefore, further experiments should be performed to verify the function of the genes involved in the Notch signaling pathway.