


Introduction
Non-alcoholic or more recently re-defined metabolic associated fatty liver disease (MAFLD) is regarded as the most relevant liver disease of the twenty-first century,affecting at least one third of the general population [1-3], and it is predicted to become the leading cause of liver transplantation by 2030 [4]. Non-alcoholic fatty liver disease (NAFLD) is a cardiovascular risk factor that is independent of the classic risk factors [5].
The global prevalence of NAFLD is currently estimated to be 24%. NAFLD is highly prevalent in all countries, but the highest rates are reported from the Middle East (32%) and South America (31%), followed by Asia (27%), the USA (24%) and Europe (23%), whereas NAFLD is less common in Africa (14%) [1].
Many epidemiological studies have shown that NAFLD, especially in its more severe forms (NASH), is linked to an increased risk of cardiovascular disease (CVD), independently of underlying cardiometabolic risk factors. This suggests that NAFLD is not solely a marker of CVD, but may also be involved in its pathogenesis [6].
Measurement of carotid intima-media thickness (CIMT) is a standard method for evaluation of subclinical atherosclerosis [7]. Nahandi et al. found that there was a strong association between NAFLD and increased CIMT, but this association is not affected by the severity of fatty liver and increasing liver enzymes. So, it is recommended immediately to treat patients with NAFLD in order to prevent atherosclerotic complications [8]. Endothelial dysfunction is an early step in the process of atherosclerosis, before development of fatty streaks or plaque inflammation [9]. One of the markers for endothelial dysfunction is endocan, which also increases in NAFLD [10].
Endocan is synthesized and secreted by activated vascular endothelial cells [11]. Previous studies have verified that endocan might play a key role in the pathophysiology of endothelial dysfunction by regulating major processes such as cell adhesion in inflammatory disorders [12-14]. It is well known that endothelial dysfunction is a key early event in atherogenesis and is integral to the onset of coronary artery disease (CAD) [15].
Mean platelet volume (MPV) is a biomarker of platelet (PLT) activation and function. It has been reported that MPV has prognostic value for cardiovascular diseases and is a risk factor for atherothrombosis [16].
Larger platelets (PLTs) compared to small PLTs are more active enzymatically and produce more thromboxane A2 with higher possibility of vascular damage and thrombosis formation [17].
Mean platelet volume seems to be a noticeable laboratory marker which increases significantly in NAFLD patients. As MPV is reported to be a potential risk factor for atherosclerosis, this marker may be useful in follow-up of patients with NAFLD [18].
Material and methods
Study design and population
This prospective observational cross sectional study was performed on 50 subjects attending the outpatient clinic of Hepatology, Gastroenterology and Infectious Diseases Department, Benha University Hospital, Benha University within the period from November 2021 to May 2022. Subjects included in this study were adults (≥ 18 years) and were divided into 25 apparently healthy persons with normal liver enzymes and abdominal ultrasonography as a control group and 25 NAFLD subjects diagnosed with ultrasonography. Subjects with a history of significant alcohol consumption (more than or equal to 30 g of alcohol per day for men and 20 g of alcohol per day for women) evaluated by a questionnaire, viral and autoimmune hepatitis, hereditary haemochromatosis, and α1-antitrypsin deficiency (evaluated by history and examination), steatogenic medications (amiodarone, valproic acid, antiretroviral drugs, methotrexate, and tetracyclines), or medicines that are used for management of NAFLD (vitamin E, metformin, and thiazolidinediones) or medicines that interact with normal platelet functions (such as aspirin and heparin) were excluded from the study and no evidence of metabolic syndrome [overt diabetes mellitus (fasting blood glucose > 126 mg/l or > 200 mg/l at 2 hours on a standard oral glucose load, hypertension ≥ 140/90 mm Hg, high-density lipoprotein cholesterol (HDL-C) < 35 mg/dl in men or < 40 mg/dl in women, triglycerides (TG) ≥ 150 mg/dl, obesity (body mass index – BMI > 30 kg/m2)] was found.
Clinical and laboratory assessment
Full history and thorough clinical examination were done for all patients. The clinical/pathological data of the patients were recorded, including age, sex, history of steatogenic medications intake, alcohol intake, manifestations of chronic liver diseases due to viral or other non-viral causes (ascites, LL oedema, jaundice, pruritus, Kayser-Fleischer ring by slit lamp examination, clubbing of fingers, signs of chest disease, signs of heart and renal failure).
Anthropometric evaluation: Weight, height and BMI were measured for each patient. BMI formula uses weight (in kg) and height (in meters) and is expressed in kg/m2 using this formula: weight (kg)/[height (m)]2. BMI results are interpreted as follows:
severely underweight – BMI less than 16.5 kg/m2,
underweight – BMI under 18.5 kg/m2,
normal weight – BMI greater than or equal to 18.5 to 24.9 kg/m2,
overweight – BMI greater than or equal to 25 to 29.9 kg/m2,
obesity – BMI greater than or equal to 30 kg/m2:
– obesity class I – BMI 30 to 34.9 kg/m2,
– obesity class II – BMI 35 to 39.9 kg/m2,
– obesity class III – BMI greater than or equal to 40 kg/m2 (also referred to as severe, extreme, or massive obesity) [19].
Blood collection and sample preparation: Ten millilitres of blood was withdrawn from each subject. The complete blood count was estimated using a cell counter with a Cell Dyn machine. Estimation of the levels of serum creatinine and liver enzymes was performed using a kinetic method via an automated Dimension system. The serum levels of albumin, prothrombin concentration (PC), and the international normalized ratio (INR) for prothrombin time were determined. Fasting blood sugar and 2-hour postprandial (mg/dl), HbA1c (%), viral markers including HBsAg using 3rd generation enzyme-linked immunosorbent assay technique (ELISA) and anti-HCV-Ab using 3rd generation ELISA were determined. Lipid profile includes total cholesterol (mg/dl). Triglycerides (mg/dl), high-density lipoproteins (HDL) (mg/dl) and low-density lipoprotein (LDL) (mg/dl) were determined.
NAFLD fibrosis score (NFS) was measured with this formula:
–1.675 + 0.037 × age (years) + 0.094 × BMI (kg/m2) + 1.13 × IFG/diabetes (yes = 1, no = 0) 0.99 × AST/ALT ratio – 0.013 × platelet (× 109/l) – 0.66 × albumin (g/dl) [20].
Radiological evaluation
Abdominal ultrasonography for diagnosis of NAFLD
Abdominal ultrasonography for diagnosis of NAFLD using a 2-5 MHz convex transducer, various (0-3) grades of steatosis have been proposed based on visual analysis of the intensity of the echogenicity, provided that the gain setting is optimum. When the echogenicity is just increased, it is grade I; when the echogenic liver obscures the echogenic walls of portal vein branches, it is grade II, and when the echogenic liver obscures the diaphragmatic outline, it is grade III fatty infiltration [21].
Carotid ultrasound scan for measurement of CIMT
Ultrasonography was performed with a GE Vivid 7 system equipped with a 13 MHz linear array imaging probe. The right common carotid artery (CCA) was examined with the patient lying supine, the head was directed away from the side of interest, and the neck extended slightly. The transducer was manipulated so that the near and far walls of the CCA were parallel to the transducer footprint, and the lumen diameter was maximized in the longitudinal plane. A region 1 cm proximal to the carotid bifurcation was identified, and the intima-media thickness (IMT) of the far wall was evaluated as the distance between the lumen–intima interface and the media–adventitia interface. The IMT was measured on the frozen frame of a suitable longitudinal image, with the image magnified to achieve a higher resolution of detail. The IMT measurement was obtained from four contiguous sites at 1 mm intervals, and the average of the four measurements was used for analyses. All measurements were performed by the same investigator without knowledge of clinical data. Upper normal average IMT is estimated to be up to 0.8 mm while atherosclerotic plaque defined as a thickness > 1.5 mm as measured from the media–adventitia interface to the intima–lumen interface [22].
Statistical methods
Data management and statistical analysis were done using SPSS version 25 (IBM, Armonk, New York, United States). Quantitative data were assessed for normality using the Shapiro-Wilk test and direct data visualization methods. Then, numerical data were summarized as means and standard deviations or medians and ranges. Categorical data were summarized as numbers and percentages. Quantitative data were compared between study groups using the independent t-test or Mann-Whitney U test for normally and non-normally distributed numerical variables, respectively. Categorical data were compared using the χ2 test. ROC analysis was done for CIMT in differentiating between cases and controls. Area under curve (AUC) with 95% confidence interval, best cut-off point, and diagnostic indices were calculated. Correlations were done using Pearson’s or Spearman’s correlation. CIMT was compared according to different parameters using the independent t-test. All statistical tests were two-sided. P values less than 0.05 were considered significant.
Results
Baseline characteristics of the study population
The current study population comprised 50 subjects, and was divided into two groups: group I included 25 subjects with NAFLD and group II included 25 healthy subjects. The baseline characteristics of this cohort are presented in Table 1.
Table 1
Characteristics and laboratory findings of studied groups
The mean age was 48.6 ±11.1 years, and 58.2% of these subjects were male.
The laboratory findings of studied groups are shown in Table 1; MPV, alanine transaminase (ALT), total bilirubin, serum creatinine, total cholesterol, LDL, TG, serum endocan and CIMT were significantly higher in group I than group II.
Diagnostic performance of noninvasive tools as predictors of early atherosclerosis in patients with NAFLD
Figures 1-3 and Tables 2-4 show the accuracy, in terms of AUC, of different noninvasive tools to detect early atherosclerosis in patients with NAFLD; the three noninvasive tools used were CIMT, endocan and MPV with AUC values of 0.849, 0.950, and 0.844 respectively, with p-value < 0.001, which is highly significant.

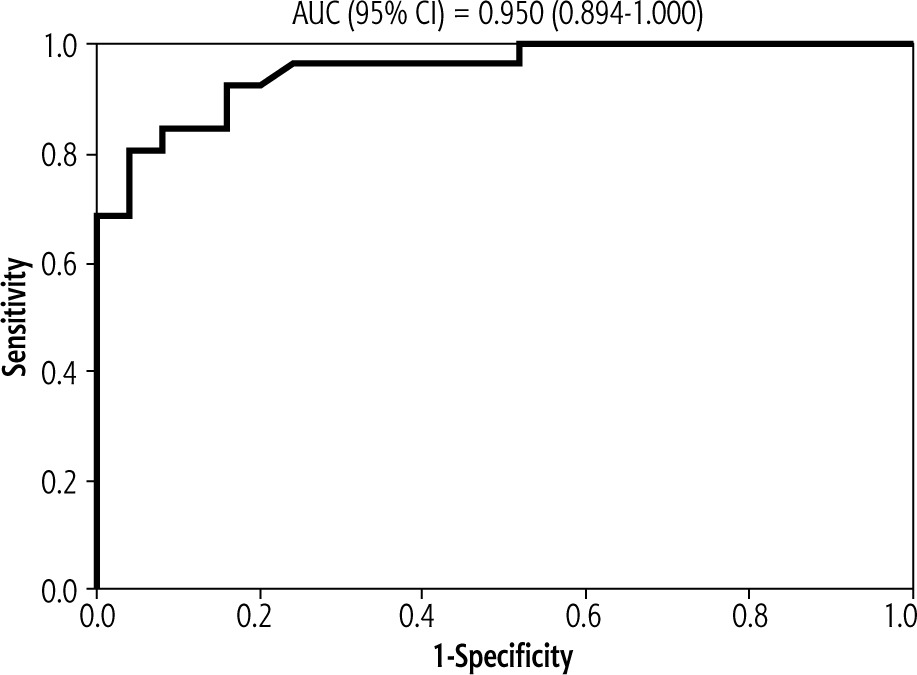
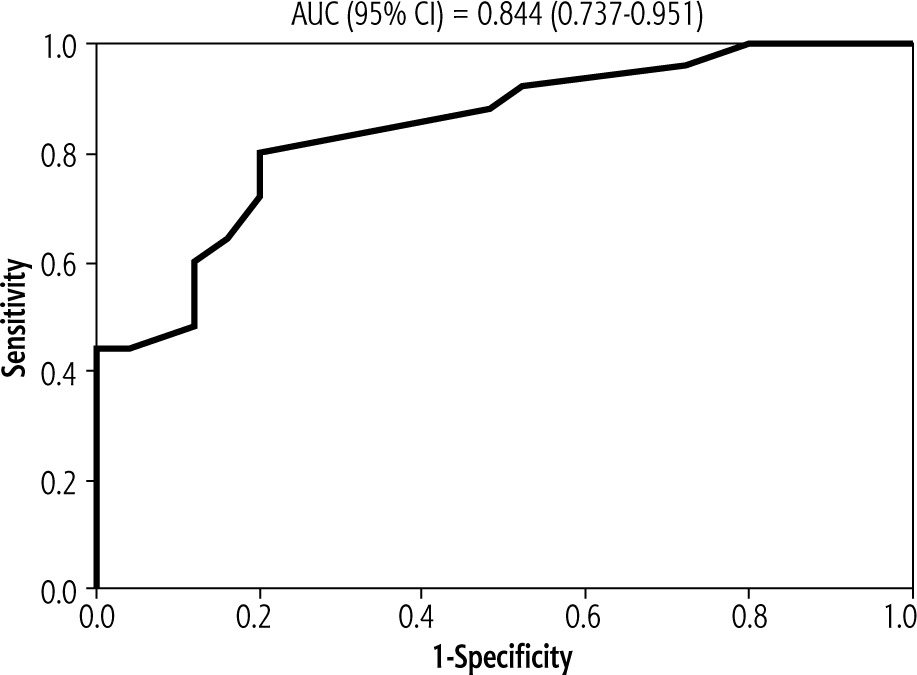
Table 2
Diagnostic performance of CIMT as predictor of early atherosclerosis in patients with NAFLD
| ROC characteristics | |
|---|---|
| AUC (95% CI) | 0.849 (0.738-0.959) |
| Best cut-off | > 0.7 |
| Sensitivity | 68% |
| Specificity | 92% |
| PPV | 89.5% |
| NPV | 74.2% |
| P-value | < 0.001 |
Table 3
Diagnostic performance of endocan as a predictor of endothelial dysfunction and early atherosclerosis in patients with NAFLD
| ROC characteristics | |
|---|---|
| AUC (95% CI) | 0.950 (0.894-1) |
| Best cut-off | > 0.197 |
| Sensitivity | 92% |
| Specificity | 84% |
| PPV | 85.2% |
| NPV | 91.3% |
| P-value | < 0.001 |
Table 4
Diagnostic performance of MPV as a predictor of endothelial dysfunction in patients with NAFLD
| ROC characteristics | |
|---|---|
| AUC (95% CI) | 0.844 (0.737-0.951) |
| Best cut-off | > 8.2 |
| Sensitivity | 80% |
| Specificity | 80% |
| PPV | 80% |
| NPV | 80% |
| P-value | < 0.001 |
Tables 5-7 show that the three noninvasive tools (CIMT, endocan and MPV) were significantly associated with most of the characteristics and laboratory investigations of patients. Also there is a highly significant correlation between CIMT, endocan and MPV.
Table 5
Correlation between CIMT and characteristics and laboratory investigations of patients
Table 6
Correlation between endocan and characteristics and laboratory investigations of patients
Table 7
Correlation between MPV and characteristics and laboratory investigations of patients
Discussion
Non-alcoholic or more recently re-defined as metabolic associated fatty liver disease is regarded as the most relevant liver disease of the twenty-first century, affecting at least one third of the general population [1-3] and it is predicted to become the leading cause of liver transplantation by 2030 [4].
Non-alcoholic fatty liver disease is associated not only with increased liver-related morbidity and mortality, but also with increased mortality due to CVD and cancer [23, 24]. Nahandi et al. found a strong association between NAFLD and increased CIMT, which is a standard method for evaluation of subclinical atherosclerosis, and on the other hand, this association is not influenced by the severity of fatty liver and increasing liver enzymes [8].
Therefore, it is recommended to treat patients with NAFLD to prevent atherosclerotic complications.
Endothelial dysfunction is an early step in the process of atherosclerosis, and hence crucial in CVD development [9]. Endothelial dysfunction of the systemic circulation was also observed in NAFLD, more pronounced in NASH [25]. One of the markers for endothelial dysfunction is endocan, which also increases in NAFLD [10].
Also, MPV is a biomarker of platelet activation and function. It has been reported that MPV has prognostic value for cardiovascular diseases and is a risk factor for atherothrombosis [16]. Mean platelet volume seems to be a noticeable laboratory marker which increases significantly in NAFLD patients; this marker may be useful in follow-up of NAFLD patients [18].
We aimed in this work to study the relation between NAFLD and subclinical atherosclerosis by measuring carotid artery intima media thickness, as a known marker of subclinical atherosclerosis. In addition, we evaluated the MPV and endocan level, as markers of endothelial dysfunction, in patients with NAFLD.
Taking non-invasive tools as predictors of early atherosclerosis into account, MPV was significantly higher in the NAFLD patient group (9.4 ±1.2 fl) than the control group (8.1 ±0.6 fl) (p-value < 0.001), which is in agreement with Madan et al., who reported from analysis of data from 8 observational studies including 1428 subjects (NAFLD = 842 and non-NAFLD = 586) which showed that MPV was significantly higher in patients with NAFLD than those without, with a p value < 0.001, indicating the presence of increased platelet activity in NAFLD patients [25]. Also, this agrees with Nallathambi et al., who reported that increased MPV with NAFLD patients indicates enhanced platelet activity and this may be used as a simple surrogate marker for the prediction of NAFLD [26]. Also, Saremi et al. reported that MPV was a significant marker which was higher in NAFLD patients (10.29 ±0.95 fl) compared to the control group (9.56 ±1.18 fl) (p-value < 0.001) [18].
Mean platelet volume showed significant positive correlations with AST (r = 0.696, p < 0.001) and ALT (r = 0.622, p < 0.001), and significant negative correlations with platelets (r = –0.734, p < 0.001) and PC (r = –0.413, p = 0.04), and this is in concordance with Tuzer et al., who reported that lower platelet count and higher MPV were observed in NAFLD patients [27]. Also MPV showed significant positive correlations with NFS (r = 0.866, p-value < 0.001) and NAFLD grade (r = 0.819, p-value < 0.001), which is similar to Saremi et al., who reported that MPV was higher in NAFLD patients (10.29 ±0.95 fl) compared to the control group (9.56 ±1.18 fl) (p-value < 0.001), and MPV was significantly different between NAFLD grade I(10.23 ±1.00), NAFLD grades II and III (11.29 ±1.84) and the control group (9.56 ±1.18) (p = 0.001) [18]. So, MPV is positively correlated with grade of NAFLD and can be used in follow-up of patients with NAFLD.
In the current study, the endocan level was significantly higher in the NAFLD group (0.6; range from 0.1 to 4.9 ng/ml) than the control group (0.1; range from 0.01 to 0.4 ng/ml and p-value was < 0.001), which is in agreement with Dallio et al., who reported that endocan level was significantly higher in NAFLD subjects compared to controls (1.23 ±1.51 vs 0.68 ±0.4 ng/ml; p-value = 0.016) [28]. Also, this agrees with Klisic et al., who found that endocan level was higher in NAFLD as well as in advanced fibrosis as compared with controls (p-value < 0.002) [29]. Also, Elsheikh et al. reported that endocan (as a marker for endothelial dysfunction) was also increased in NAFLD [10]. Also, NAFLD subjects had significantly higher endocan levels than the control group, as reported by Ustyol et al. [30].
ROC analysis was performed for endocan in predicting endothelial dysfunction in NAFLD patients, and showed that there was a significant excellent AUC of 0.950 with a 95% confidence interval range of 0.894-1 (p < 0.001). The best cut-off was > 0.197 ng/ml,at which sensitivity and specificity, PPV, and NPV were 92%, 84%, 85.2%, and 91.3%, respectively. This is in agreement with Erman et al., who reported that endocan showed AUC of 0.867 (p < 0.001) and the cut-off value of serum endocan level to predict NAFLD was 122.583 pg/ml with a sensitivity of 71.79%, specificity of 90%, PPV of 93.3% and NPV of 62.1% [31].
Endocan showed significant positive correlations with NFS (r = 0.958, p < 0.001) and NAFLD grade (r = 0.863, p < 0.001). This is similar to Dallio et al., who found that NAFLD was associated with a statistically significant increase in endocan serum levels compared to controls, and the increase was more marked in NASH patients compared to NAFLD patients (p = 0.001 and p = 0.004 vs. controls, respectively) [28], which indicates that there was a positive correlation between endocan level and severity of NAFLD.
Another non-invasive tool in our study is CIMT, which was significantly higher in the NAFLD group (0.9 ±0.3 mm) than the control group (0.6 ±0.1 mm), and the p-value was < 0.001. This was in agreement with Musa et al., who reported that CIMT was higher in NAFLD patients compared to controls (0.74 ±0.14 vs. 0.65 ±0.11; p = 0.025) [32]. Also, Aygun et al. reported that carotid artery ultrasound measurements in the NAFLD group revealed that the mean and maximum CIMT values were significantly higher than those of the control group with a higher frequency of plaque (0.646 ±0.101 vs. 0.544 ±0.067; p < 0.001) [33]. Also, Madan et al. reported that CIMT, a marker for generalised atherosclerotic burden, was associated with NAFLD, which means that the patients with NAFLD may be at risk of early generalized atherosclerosis [25]. Also, in the study performed by Dogru et al. subjects with NAFLD had significantly greater CIMT measurements than controls (p < 0.001) [34]. Also, Thakur et al.reported that NAFLD patients had higher average CIMT (0.6 ±0.12) vs. controls (0.489 ±0.1), p < 0.05, and had higher prevalence of atherosclerotic plaques (20% vs. 5%, p < 0.05) than controls [35].
Diagnostic performance of CIMT as a predictor of early atherosclerosis in NAFLD patients was done, and revealed an excellent significant AUC of 0.849 with a 95% confidence interval range from 0.738 to 0.959. The best cut-off point was > 0.7, at which sensitivity, specificity, PPV, and NPV were 68%, 92%, 89.5%, and 74.2%, respectively. This is in agreement with Musa et al., who found that the AUC for CIMT was 0.567, with a cutoff value of 0.6 as a possible cut-off value to discriminate NAFLD giving a sensitivity of 70%, specificity 53.3%, PPV 75%, NPV 47.1%, and diagnostic accuracy 64.4% [32].
In this study, CIMT showed a significant positive correlation with MPV (r = 0.806, p < 0.001) and a significant negative correlation with platelets (r = –0.689, p < 0.001). This agrees with Arslan et al., who found a significant relationship between MPV and CIMT [36]. Also, Kilciler et al. reported a positive relationship between MPV and carotid atherosclerosis in adult patients with NAFLD, but there was no difference between NAFLD and the control group regarding MPV and CIMT [37].
In the current study, CIMT showed significant positive correlations with AST (r = 0.666, p < 0.001), ALT (r = 0.595, p = 0.002), total bilirubin (r = 0.436, p = 0.0.03), direct bilirubin (r = 0.527, p = 0.007), NFS (r = 0.879, p < 0.001) and NAFLD grade (r = 0.843, p < 0.001). Also, CIMT showed a significant negative correlation with albumin (r = –0.451, p = 0.024). This agrees with Fracanzani et al., who performed a longitudinal cohort study on 125 NAFLD patients and 250 controls at baseline and 10 years later and found that major cardiovascular events were observed in 19% of NAFLD patients, with an estimated cumulative risk significantly higher in NAFLD than in controls [38].
Colak et al. found that CIMT was significantly higher in patients with NAFLD than the control group (0.67 ±0.09 vs. 0.52 ±0.11 mm, p < 0.001), and the average CIMT measurements were found in groups of control, simple steatosis, and NASH as 0.52 ±0.11, 0.63 ±0.07, and 0.68 ±0.1 mm, respectively; the differences between groups were significant (p < 0.001) [39]. This mean that CIMT was positively correlated with severity and grade of NAFLD.
In the current study, CIMT showed a significant positive correlation with endocan (r = 0.877, p < 0.001).This is in agreement with Nalbantoglu et al., who found that obese children have a higher endocan level compared to the control group and also have increased CIMT, so there was a significant correlation between CIMT and endocan in obese children [40].
In conclusion, patients with NAFLD have significantly higher mean values of carotid intima-media thickness, representing a possible increased risk of atherosclerosis. Also MPV and endocan level were higher in NAFLD patients and can be used as predictors for endothelial dysfunction, so the clinical implication of these results might be that patients with NAFLD are at significantly increased risk for subclinical atherosclerosis and endothelial dysfunction independent of obesity, dyslipidaemia and metabolic syndrome.