


Introduction
Triple-negative breast cancer (TNBC) is an aggressive molecular subtype of breast cancer and is characterised by negative oestrogen receptor (OR), progesterone receptor (PR), and HER2-neu [1]. It has an aggressive behaviour and unfavourable prognostic criteria such as high grade, early brain and lung metastasis, dismal outcome, and unfavourable survival rates [2]. There is still no specific targeted therapy for TNBC, and it is even chemo-resistant [3]. Hence, there is an urgent need to clarify the molecular mechanisms underlying the progression and metastases of BLBC, in order to detect novel targeted therapies. The promoting factors of the epithelial–mesenchymal transition (EMT) process were found to be negative prognostic factors in cancer of the breast [4]. There are many factors that control the EMT process and cancer progression. There is a plethora of signalling pathways that are incriminated in the activation of EMT [5]. Microfibrillar-associated protein 5 (MFAP5) is a protein with multiple functions, which plays an essential role in the regulation of cell behaviour and survival [1]. MFAP5 is one of the expressed genes in most human malignancies; a few studies have clarified its function [6]. Evaluation of MFAP5 expression in malignant epithelial cells is detailed in only a few studies [7]. Autophagy is a stress-related process that degrades dangerous cytosolic components, and it is characterised by phagophore formation. It was found that factors enhancing autophagy could control cancer progression [8]. Integral membrane protein 2A (ITM2A) is a type II transmembrane protein, which is one of the autophagy related proteins, and its role in breast cancer, particularly TNBC, remains uncertain [9].
The aim of the present study was to assess the expression of MFAP5 and ITM2A proteins in tissues of TNBC using immunohistochemistry, to correlate the expression with clinicopathological and prognostic parameters of such an aggressive cancer, and to show the relationship between EMT and autophagy in breast cancer progression and metastasis.
Material and methods
The present study is a retrospective study that included sections from archived paraffin blocks retrieved from 120 patients with TNBC. We collected cases during three years, from December 2016 to December 2019, from Zagazig University hospitals and other private surgical hospitals. We obtained approval from the local Ethics Committee of ZU institutional board for performance of the study. Patients signed a written informed consent form to be included in the study. For all patients ER, PR, Her2-neu, and Ki-67 labelling index were assessed. We recorded all clinicopathological and follow-up data from patients’ files. Staging of samples derived from included cases was done using the 7th edition of the TNM staging system [10]. Grading of cases was done according to the grading criteria of Elston and Ellis [11].
For immunohistochemistry staining we used primary rabbit poly clonal anti-MFAP5 antibody (catalogue number; MBS9204084) and primary rabbit poly clonal anti-ITM2A antibody (catalogue number; ab203620) at 1 : 50 dilution.
Inclusion criteria: Samples derived from patients with TNBC who showed negative expression of ER, PR, and Her2neu and have full histopathological and follow-up data.
Exclusion criteria: Paraffin blocks with insufficient samples, patients with incomplete clinicopathological or follow-up data, and patients with positive ER, PR, and Her2neu expression.
We assessed nuclear expression of MFAP5 and cytoplasmic expression of ITM2A in malignant epithelial cells semiquantitively, giving the stain intensity scores: 0, 1, 2, and 3 – representing: negative, weak, moderate, and strong stain, respectively, and giving the stain extent in the tumour cells scores: 0, 1, 2, 3, and 4 – representing: 0%, from 1 to 25%, from 26–50%, from 51–75%, and more than 75%, respectively [9].
We multiplied scores of intensity and extent to reach the final stain score from 0–12, then finally the stain was divided into low and high according to the cut-off point of 4; this cut-off point value was used to divide results into low and high results to allow easy and clear statistical analysis of values.
We used sections from skeletal muscles and normal colon mucosa as positive controls for MFAP5 and ITM2A, respectively.
Patients clinicopathological data, such as age and sex of patients, tumour size, grade, stage, and the presence of lymph node metastases and distant metastases, and follow-up data such as disease progression, recurrence, response to chemotherapy, and survival rates, were retrospectively collected, recorded, tabulated, and statistically analysed to correlate between MFAP5 and ITM2A expression and the data.
Statistical analysis
We performed statistical analysis using SPSS 22.0 (SPSS Inc., Chicago, IL, USA).
We determined continuous variables as mean ±SD, and we have checked them for normality by using the Shapiro-Wilk test. We determined categorical variables as numbers and percentages. We used the Mann-Whitney U test to allow easy comparison between non-normally distributed variables, while the c2 test was used to compare trends of changes in frequencies of ordinal data. Stratification and correlation of rates of OS and RFS rates with the immunohistochemical markers were made by Kaplan-Meier curve analysis.
Results
MFAP5 expression and its relationship with pathological findings which were found in samples retrieved from included cases are shown in Table 1 and Figure 1. MFAP5 tissue expression in TNBC cells was positively correlated with age of patients, presence of lymph node metastases (p < 0.001), larger tumour size (p = 0.004), and higher stage (p = 0.007) and higher grade of tumour (p = 0.005).
Table 1
Association between clinicopathological findings and MFAP5 in included triple-negative breast cancer patients
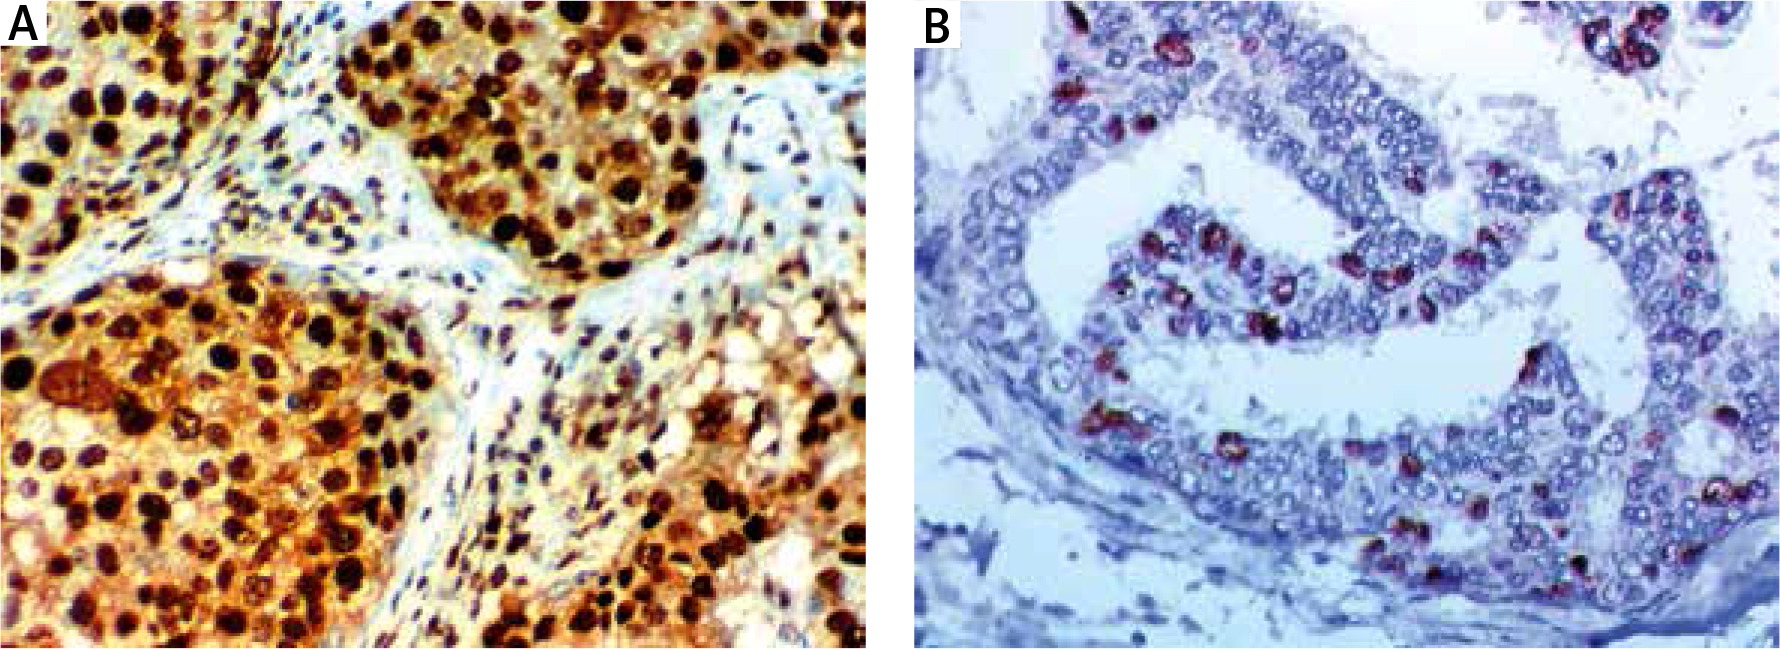
Fig. 1
Nuclear expression of MFAP5: (A) high expression in cells of triple-negative breast cancer (TNBC); high grade, stage IV ×400, (B) low nuclear expression in intra-ductal carcinoma ×400
ITM2A expression and its relationship with pathological findings which were found in samples retrieved from included cases are shown in Table 2 and Figure 2. Because we did not correlate malignant tissue with non-neoplastic breast tissue, down-regulation of ITM2A expression in TNBC was found – its expression was decreased in higher grade than in lower grade tumour and areas of intra-ductal carcinoma, reaching negative results in high-grade tumours. ITM2A tissue expression in TNBC cells was negatively correlated with the age of patients (p = 0.009), presence of lymph node metastases (p = 0.002), larger tumour size (p = 0.006), and higher stage (p = 0.007) and higher grade of tumour (p = 0.004).
Table 2
Association between clinicopathological findings and ITM2A in included triple-negative breast cancer patients
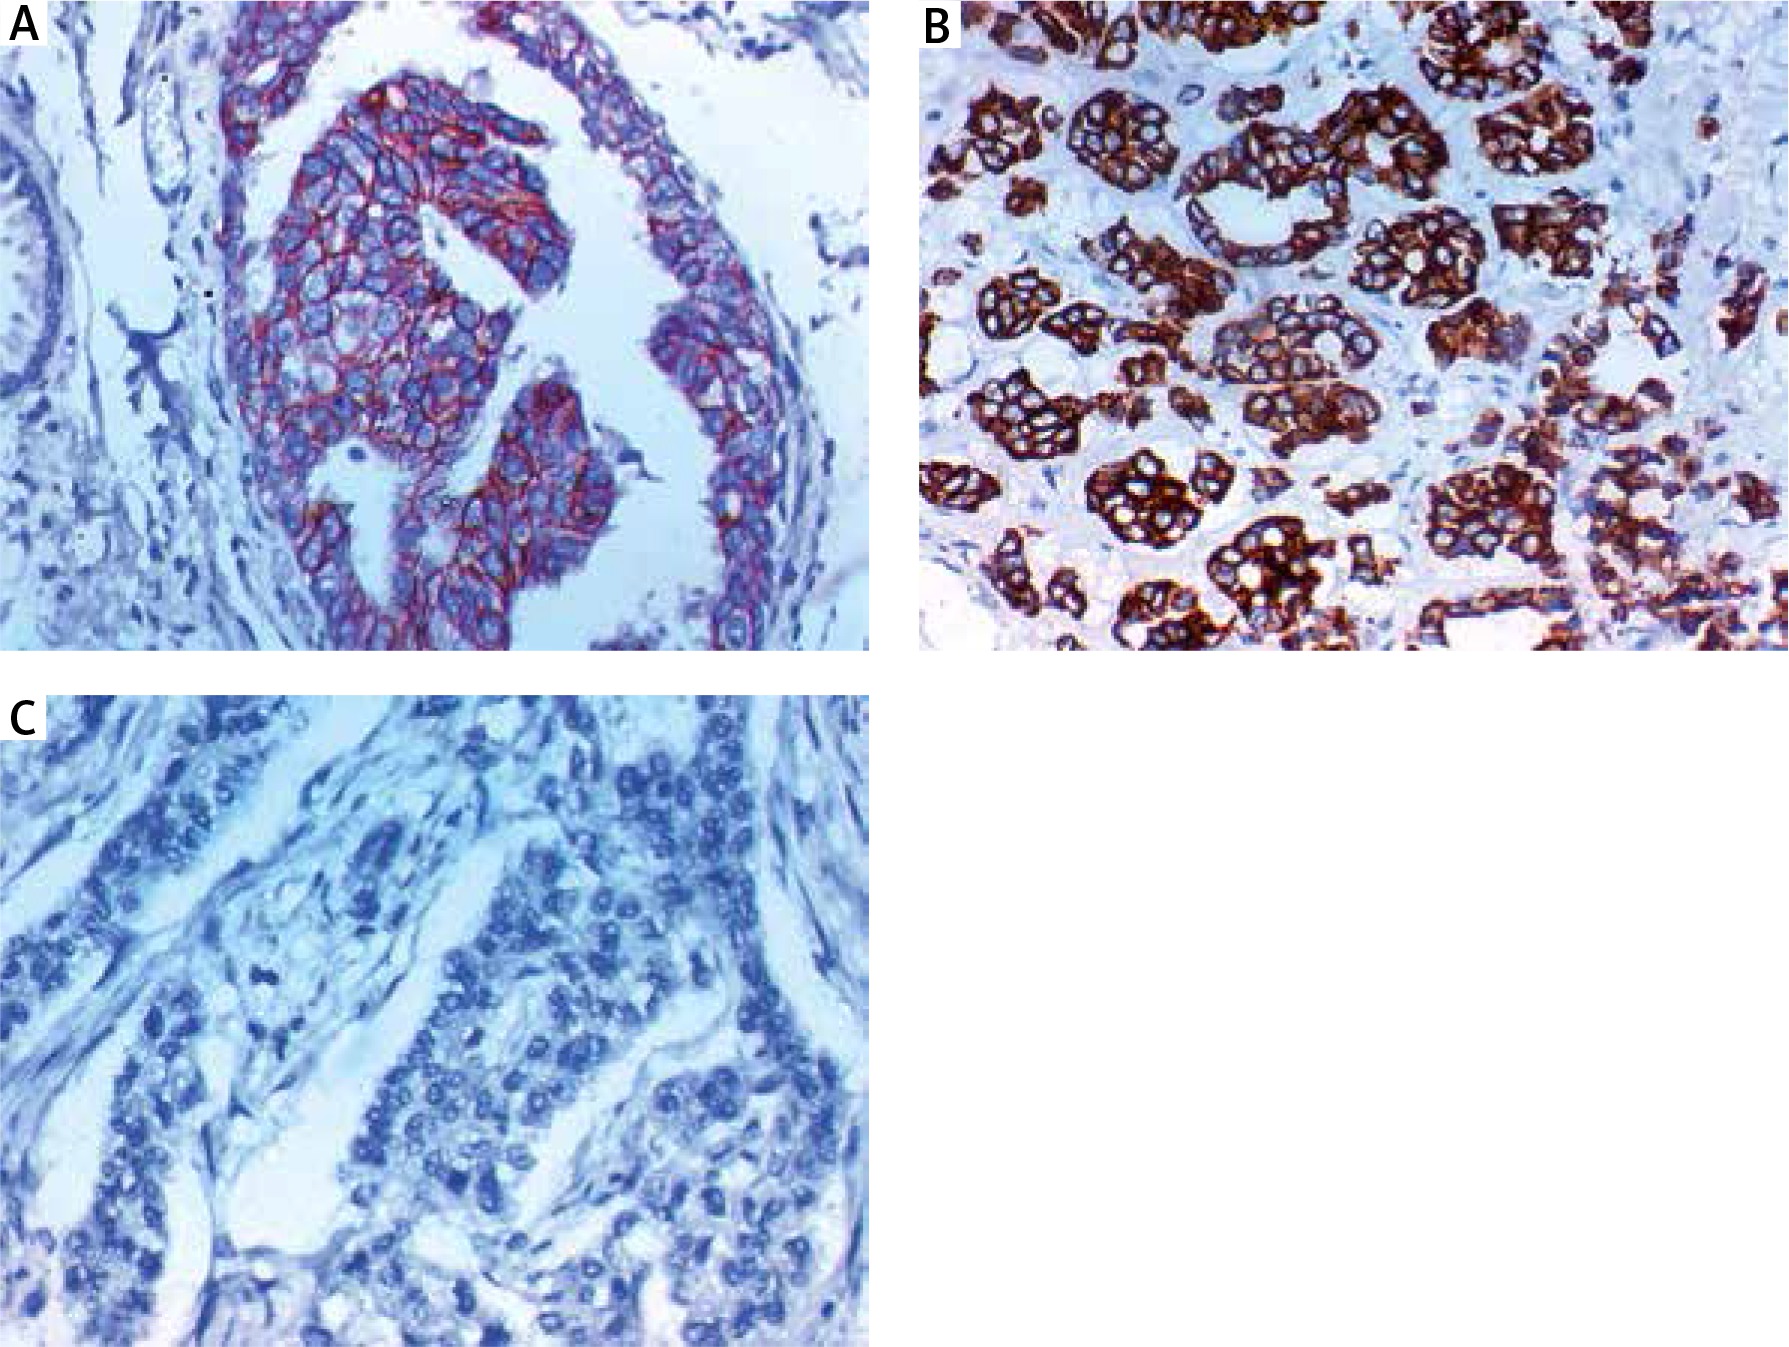
Fig. 2
Cytoplasmic expression of ITM2A: (A) high expression in intra-ducal carcinoma ×400, (B) high expression in low-grade triple- negative breast cancer TNBC stage II ×400, (C) low expression in high-grade triple-negative breast cancer TNBC, stage IV ×400
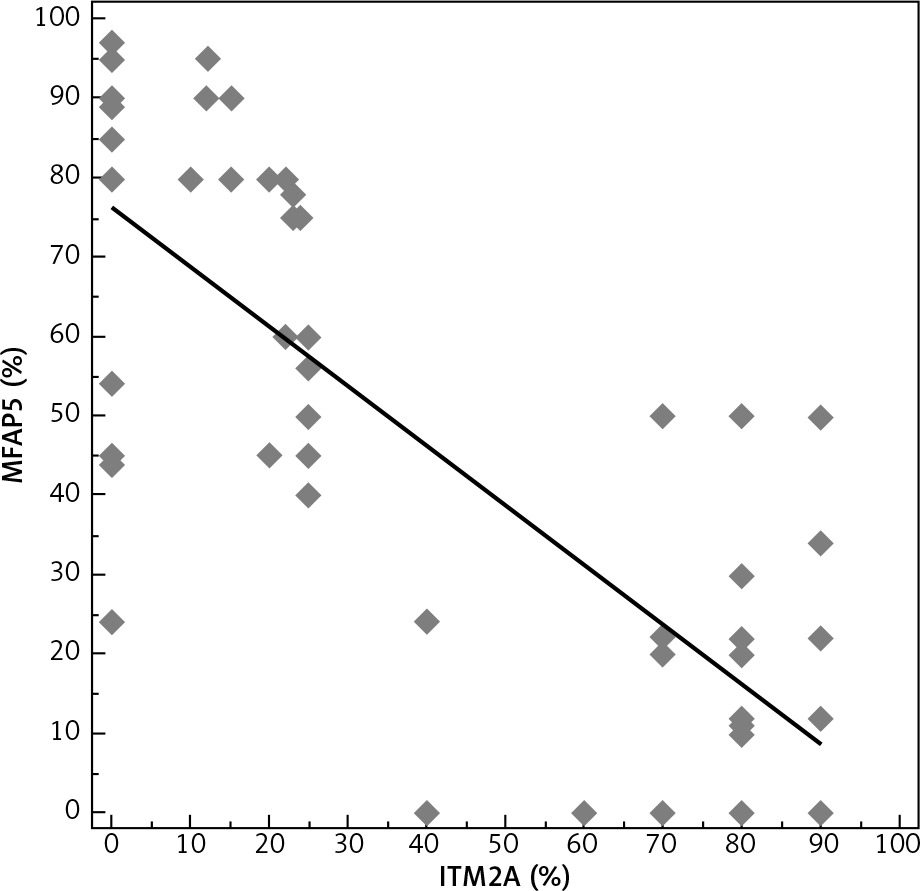
We found an inverse relationship between expression of both MFAP5 and ITM2A in TNBC tumour cells (r = – 0.640; p = 0.002) (Fig. 3).
Fig. 3
Scatter plot with regression line shows a significant strong inverse correlation between MFAP5 and ITM2A
Patient outcomes, follow-up, and survival data results are shown in Table 3 and 4 and in Figure 4 and 5.
Table 3
Association between clinicopathological features, MFAP5, ITM2A, and survival in included triple-negative breast cancer patients
Table 4
Association between MFAP5, ITM2A expression, disease recurrence, distant metastases, and survival rates in included triple-negative breast cancer patients
Fig. 4
Kaplan-Meier curve of local recurrence-free survival rate of the included triple-negative breast cancer patients: (A) stratified according to MFAP5 (B) stratified according to ITM2A
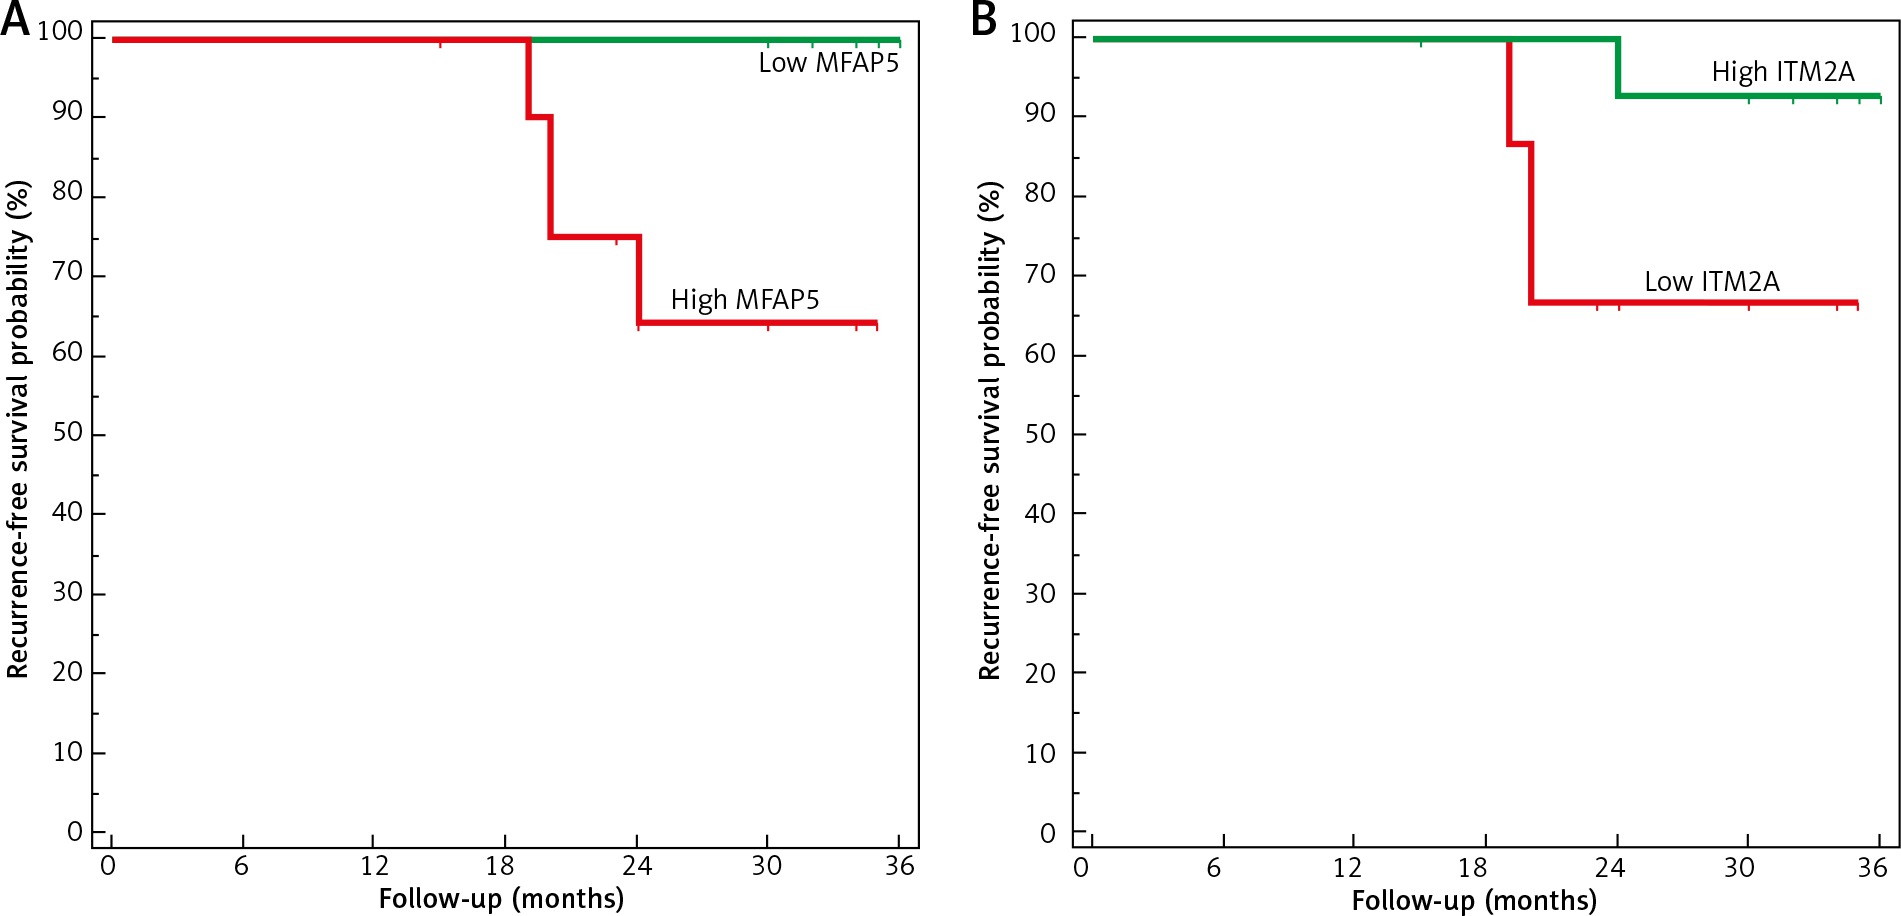
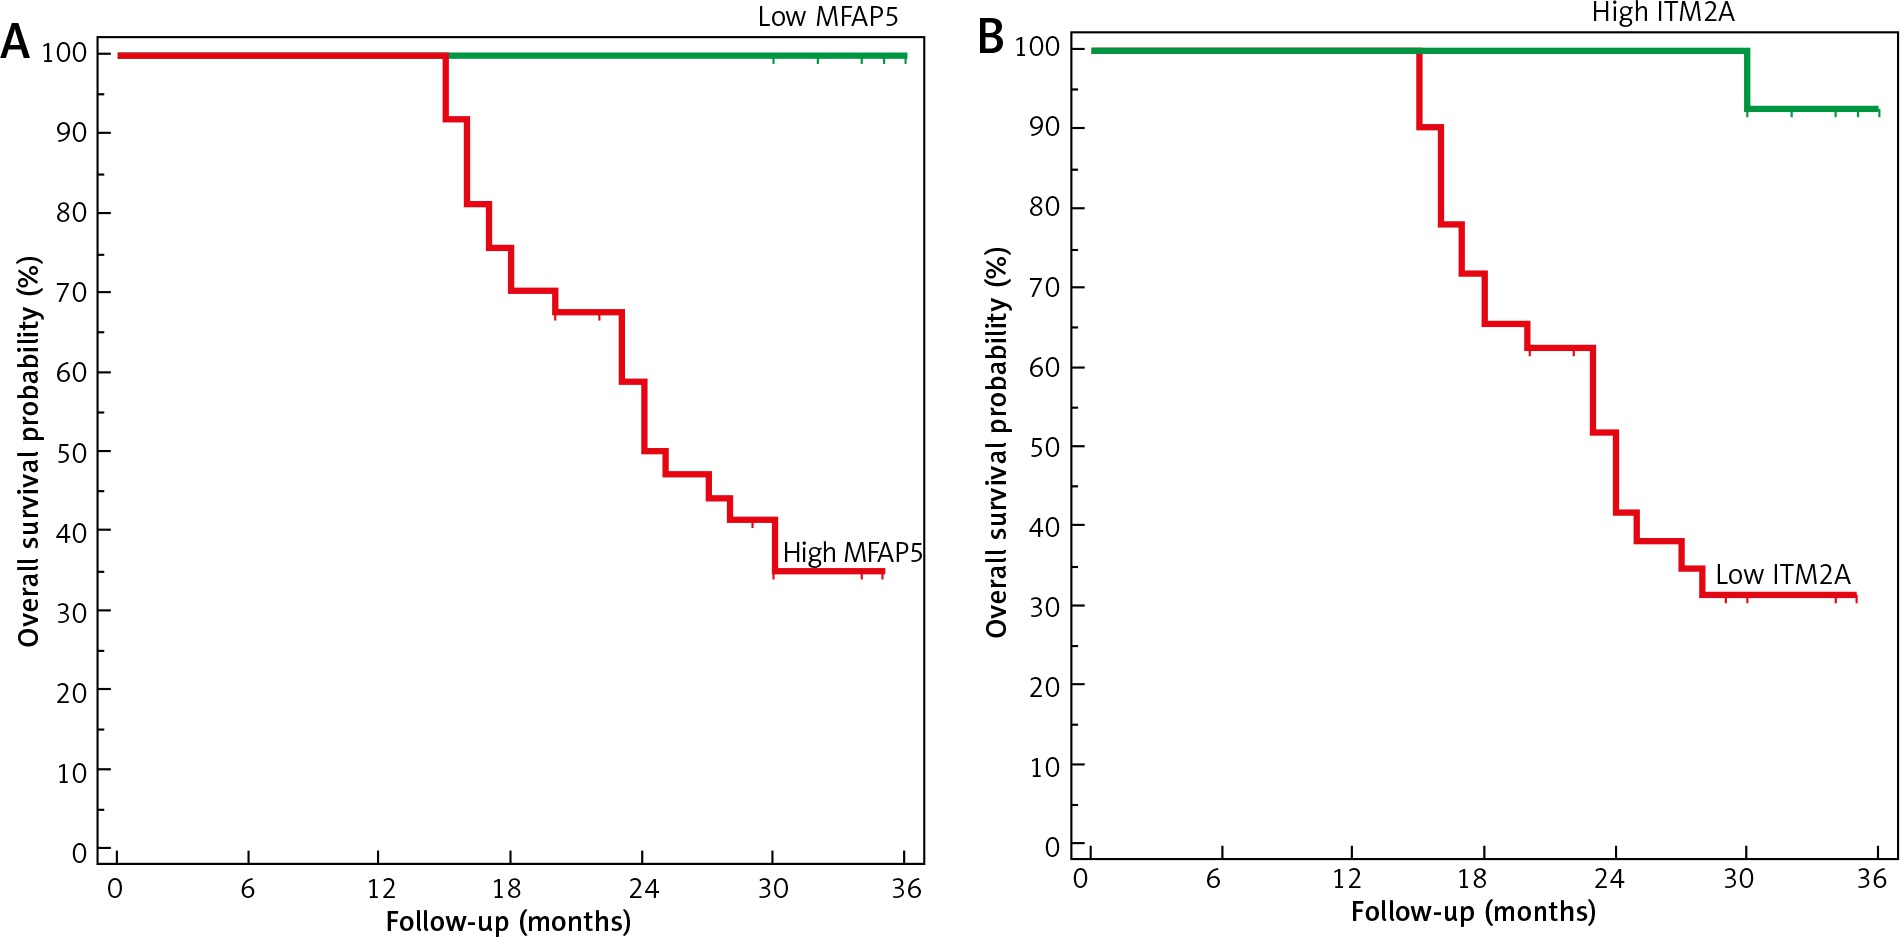
Fig. 5
Kaplan-Meier plot of overall survival rate of the included triple-negative breast cancer patients: (A) stratified according to MFAP5, (B) stratified according to ITM2A
Recurrence-free survival rate (RFS) and overall survival rate (OS) for all patients were 83.6% and 60.8%, respectively. We assessed the recurrence of the disease and the RFS rate only in patients who had complete response to treatment.
In patients underwent chemotherapy, low MFAP5 expression and high ITIM2A expression was positively associated with good response to chemotherapy. High MFAP5 expression and low ITM2A expression was associated with recurrence of tumour and disease progression (p = 0.002 and 0.007, respectively). High MFAP5 expression and low ITM2A expression was associated with a low three-year RFS rate (p = 0.001 and 0.016, respectively). High MFAP5 expression and low ITM2A expression was associated with a low three-year OS rate (p < 0.001).
Discussion
TNBC, which is a molecular subtype of breast cancer, has aggressive behaviour, no targeted therapy, and high incidence of disease progression and development of metastases; hence, it needs further evaluation and new studies to detect novel prognostic markers and targeted therapy to improve its outcome [1]. EMT initiation and activation in tumour cells is thought to be responsible for starting and maintaining the metastatic program [12]. Studying biomarkers that play a role in EMT might lead to the detection of novel biomarkers that could help to improve the prognosis of TNBC.
MFAP5 gene expression was previously found to be associated with poor outcome of many tumours through activation of signalling pathways that are responsible for EMT induction and maintenance in tumour cells, but its tissue protein expression by immunohistochemistry in epithelial cells is not fully detailed.
We found that MFAP5 tissue expression in TNBC cells was associated with unfavourable pathological data and dismal outcome, similarly to previous studies [1, 13–15].
Wu et al. [1] showed that MFAP5 played essential roles in TNBC occurrence, invasion, and progression and that its up-regulation is associated with advanced TNM staging and higher incidence of metastases to axillary lymph nodes. Moreover, Wu et al. [15] revealed that MFAP5 mRNA levels were markedly up-regulated.
There are many studies showing that MFAP5 up-regulation is related to progression of many tumours and poor prognosis [13–16]. Our study might help in clarifying the mechanisms by which overexpression of MFAP5 in TNBC leads to its progression.
MFAP5 leads to activation of Notch and TGF-b signalling pathways, which lead to induction and promotion of EMT, which in turn lead to an aggressive course and progression of tumour cells to invasion and metastasis [1].
Our results confirm previous results about expression of MFAP5 [17] and activation of Notch pathway, which means that targets against such a gene may lead to blocking the Notch pathway and stopping tumour progression, which might improve the prognosis of BLBC.
MFAP5 leads to tumour progression by increasing expression of mesenchymal markers, such as N-cadherin, and by decreasing E-cadherin levels in cells of TNBC that promote EMT. This denotes that MFAP5 induces EMT in TNBC cells. Additionally, MFAP5 promoted activation of Smad and the Notch signalling pathway downstream signals, and that inhibition of Notch signalling pathway through down-regulation of MFAP5 leads to inhibition of EMT and tumour progression [1].
It was found that inhibitors of Notch and TGF-β signalling pathways leads to blocking of MFAP5-mediated invasion, migration, and proliferation of tumour cells.
We proved the results of Wu et al. [1] regarding the association between MFAP5 and EMT activation, but all the mechanisms of action of MFAP5 remain unknown. Hence, we assessed the expression of another marker, i.e. ITM2A, which was found to be associated with autophagy induction because we hypothesised that there could be a relationship between MFAP5 expression and autophagy control in TNBC tumour cells.
ITM2A was recently described to have cancer suppressor function in many epithelial cancers [18], but its role in autophagy and cancer progression has not been established in TNBC. In the current study we found that the expression of ITM2A is markedly reduced in malignant tissue, and its expression is associated with favourable parameters. Moreover, ITM2A was inversely associated with MFAP5, which is associated with induction of EMT, which denotes the inverse association between autophagy and EMT in TNBC.
Similar results were detected by Zhou et al. [9], who showed that the levels of ITM2A mRNA level were markedly down-regulated in tissues of breast cancer in comparison with levels in non-neoplastic tissues.
Moreover, the results of Zhou et al. [9] were in line with ours, confirming that expression of ITM2A inhibited growth of breast cancer cells. ITM2A expression was inversely associated with advanced age, advanced stage, and basal like phenotype, so it might help in the prediction of chemotherapy response [19].
Autophagy dysfunction was found in many cancers, which might lead to progression or suppression of oncogenesis according to the type of the tumour [20]. Activation of autophagy was found in actively growing tumours in sites of nutrient deprivation and hypoxia that needed autophagy for tumour growth, such as cancer of the pancreas [21].
Hence, pharmacological or genetic autophagy inhibition leads to increased levels of reactive oxygen species and increased DNA damage, which in turn leads to the regulation of cell proliferation and survival [22].
In the current study we clarified the tumour suppressor function of autophagy and the association between up-regulation of ITM2A and prevention of TNBC progression, which was in line with [23, 24], and we associated its role in inhibition of EMT.
Conclusions
We assessed the expression of two novel biomarkers with different mechanisms of action, i.e. EMT induction and autophagy induction, in a specific molecular subtype of breast cancer (TNBC), and we concluded that EMT induction, which is denoted by MFAP5 up-regulation, was associated with poor clinicopathological parameters, disease progression, and unfavourable survival rates, while autophagy induction denoted by high ITM2A expression was associated with favourable clinicopathological parameters, lower incidence of disease progression, and favourable survival rates. Hence, we highlighted the possibility of the presence of a biological role of EMT and autophagy in controlling TNBC progression. Proving our results requires further studies to allow the discovery of novel, promising therapeutic targets for patients with breast cancer, particularly the TNBC molecular subtype, in the future.
Strengths of the study
Assessment of expression of novel markers in a large number of cases of breast cancer with a specific aggressive molecular subtype – TNBC.