


Introduction
The amount of radiologically dense breast tissue displayed on a mammogram is not the same for all women. This is due to differences in the composition of breast tissue and is called mammography density. Mammographic density is a strong risk factor for breast cancer. In addition, the risk of breast cancer is 4-5 times higher in women with higher density (over 75% of the breast area) than in women with low or no breast density. The presence of dense tissue in over 50% of the breast area may explain the occurrence of about 1/3 of breast cancers [1-4].
Epidemiology of mammographic density is consistent with its sensitivity as a marker of susceptibility to breast cancer. Mammographic breast density has the characteristics of a quantitative trait and is determined by genes that are easier to identify than those that are analyzed in the breast cancer itself. Genes that determine breast density can also be associated with the risk of breast cancer, and their identification is likely to provide insight into the biology of breast and identify potential targets for prevention strategies.
To date, many studies have been carried out on genetic factors that may affect breast density [5-9]. It is suggested that some elements of the insulin-like growth factor pathway (IGF-1) are associated with breast density and IGF levels [10, 11]. Literature data indicate the association of single nucleotide polymorphisms (SNPs) in the IGF-1 and IGFBP-3 gene region with breast density [10-22]. It is also known that single nucleotide polymorphisms in IGF-1R (insulin-like growth factor receptor 1), IRS1 (insulin receptor substrate 1), and PI3KCB (phosphoinositide-3-kinase, catalytic, beta polypeptide) genes may affect breast morphology and carcinogenesis [15].
The polymorphism of rs2946834 is related to the level of IGF-1 among women with breast cancer in the United Kingdom population [16]. However, its direct association with the risk of developing this cancer has not been demonstrated. Studies indicate that the impact of rs2946834 polymorphism on circulating IGF levels does not appear to substantially influence breast cancer risk among primarily Caucasian postmenopausal women, Chinese women and African Americans [23-26]. Another polymorphism of the single nucleotides of the IGF-1 gene analyzed was rs5747694. Similarly to the polymorphism rs2946834, it is related to the level of IGF-1 in women of the British population [16]. Literature data suggest that rs5747694 polymorphism has been studied only among patients from the East Anglian region of UK [16, 17].
A correlation between the polymorphisms rs1520220 and rs6220 of the IGF-1 gene was observed, as well as the rs1801278 polymorphism of the IRS gene and high breast density while the polymorphism rs361072 of the PI3KCB gene was associated with low breast density [22]. Four SNPs of the IGFBP-3 gene (rs2132572, rs2854744, rs2471551 and rs3110697) were related to the level of IGF-1 and IGFBP-3 [22]. The association of the following SNPs of the IGF-1 gene with the increasing level of IGF-1 has been shown: rs9989002, rs2033178, rs7136446, rs978458 and rs6220. The association of the following SNPs of the IGF-1 gene with the increasing levels of IGF-1 has been shown: rs9989002, rs2033178, rs7136446, rs978458 and rs6220. These polymorphisms were associated to a small extent with breast density in pre-menopausal women. Much greater correlation was found between polymorphisms and mammographic breast density in postmenopausal women. The most statistically significant results were obtained for the rs6220 polymorphism and IGF-1 level. Research suggests a correlation between IGF-1 genetic variants and variable protein levels. However, their correlation with breast density has not been completely confirmed [22].
A study by Verheus et al. showed that the rs9989002 alleles, rs2033178, rs7136446, rs978458, rs6219 were significantly associated with an increase in IGF-1 levels. However, they did not correlate with breast density in the studied women [27].
Studies indicate that IGF pathway may influence the risk of breast cancer by influencing the morphogenesis of breast tissue [26]. SNPs of the IGF-1 gene may affect the level of IGF1 protein in tissues [18, 28]. It was shown that the polymorphisms rs1520220 and rs6220 in the IGF-1 gene region correlate with the high level of IGF1 protein encoded by this gene and thus with a high risk of breast cancer [18].
In the present study, six SNPs of the IGF-1 gene were analyzed, including: rs1520220, rs2945834, rs5747694, rs6214, rs6219, rs5742678. The study included women diagnosed with an increased breast mammographic density, breast cancer and women as a control group. An attempt was made to assess the significance of the above IGF-1 gene polymorphisms as prognostic and predictive factors in Polish women with diagnosed increased breast mammographic density.
Material and methods
Patients
98 samples of peripheral blood collected from women with increased mammographic breast density. 135 samples of peripheral blood collected from women who were diagnosed with breast cancer. 60 preparations of epithelium from the oral mucosa of women who were not diagnosed with pathological changes of the breast and who were not genetically burdened with breast and/or ovarian cancer. The intensification of mammographic density of women’s breasts was classified according to the six-level BIRADS scale (Breast Imaging-Reporting and Data System) [29], while all tumors were subjected to histopathological evaluation and grading according to the Bloom-Richardson scale [30]. Clinical-pathological characteristics of the studied group of women are in Table 1. The study protocol was approved by the Bioethical Committee of the Polish Mother’s Memorial Institute (approval number: 10/2012).
Table 1
Clinical-pathological characteristics of women from whom the material used for the research was collected
Isolation of DNA from whole blood using DNA-sol and extraction phenol-chloroform-isoamyl alcohol.
DNA was isolated from whole blood by combined DNA-sol and phenol-chloroform isoamyl alcohol extraction. Approximately 200 µl of blood was suspended in 500 µl DNA-sol (ICN Biomedicals Inc., USA) and incubated at 37°C for 12 hours. After this time, an equal volume of phenol : chloroform : isoamyl alcohol (25 : 24 : 1, v/v/v) was added. The whole was centrifuged at 8000 × γ for 10 minutes at room temperature. From the resulting aqueous phase, the DNA was precipitated by adding 1/10 volume of 3 M sodium acetate, pH 5.2, and 2 volumes of ethanol at 4°C. After thorough mixing, the samples were stored at –70°C for one hour. The DNA was centrifuged at 10,000 × γ for 30 minutes at 4°C. The isolated DNA was dried at 37°C and then suspended in 30 µl of deionized water and stored at –20°C.
Isolation of DNA from the epithelium of the oral mucosa using the Sherlock AX kit
DNA from the epithelium of the oral mucosa were isolated using a set of Sherlock AX (A & A Biotechnology, USA) according to manufacturer’s instructions.
Spectral analysis of DNA purity
The purity of the obtained DNA preparations was determined by spectrophotometric method, analyzing the absorbance spectra of the samples in the wavelength range 230-300 nm. The accepted criterion for DNA purity was the value A260/A280, which was within 1.8-2.0.
Quantitative analysis of DNA
The concentration of DNA was determined by spectrophotometric method based on the absorbance value measured at 260 nm. This value corresponded to 1OD = 50 µg DNA/ml.
Detection of polymorphisms in the IGF-1 gene by the analysis of single-stranded DNA conformation polymorphism (SSCP-PCR)
Polymorphisms of the IGF-1 gene were detected using SSCP-PCR polymorphism analysis of single-stranded DNA conformation.
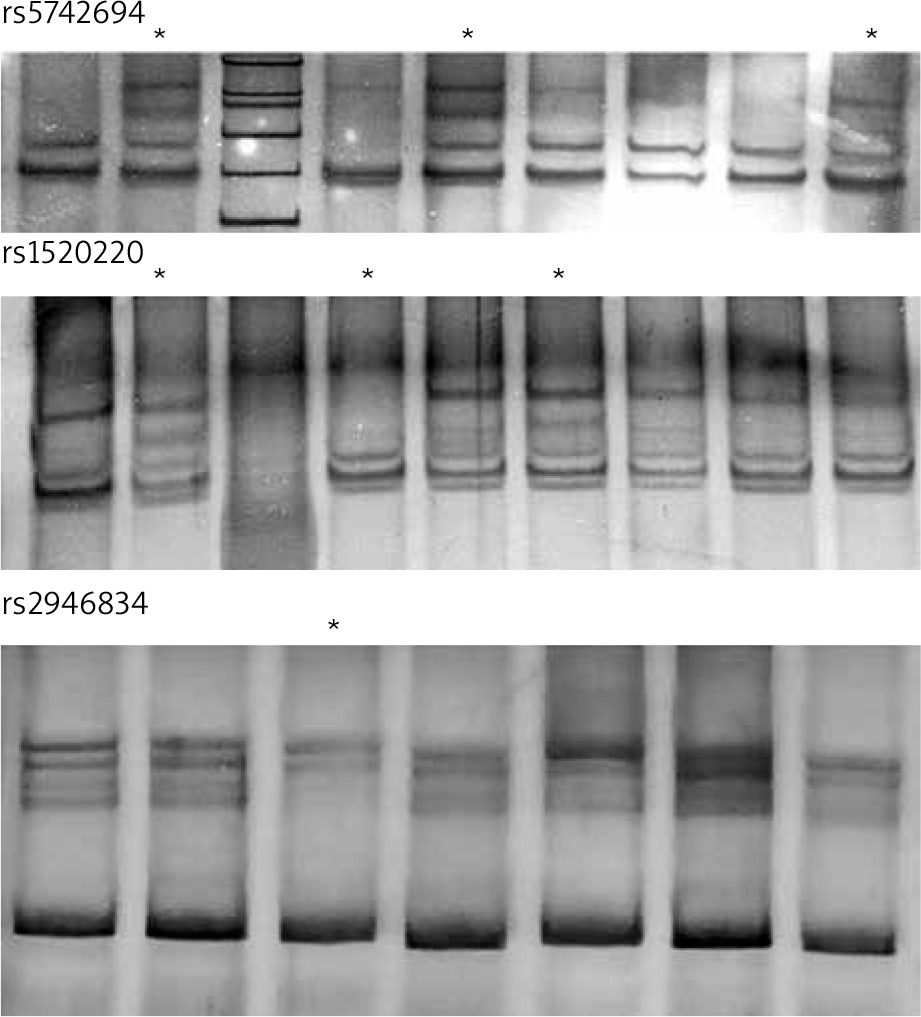
A reaction mixture of the following composition was used for PCR: 2.5 µl of 10x concentrated PCR buffer, 1 µl of each primer, 0.2 µl of Taq polymerase with 5 U/µl activity, 1 µl of a 200 µM mixture of nucleotides (dNTPs) and 100 ng matrix. The reaction mixture was made up to a final volume of 25 µl. The nucleotide sequences of the primers, the binding temperature and the size of the PCR products are shown in Table 2. The primers were designed using the Primer3 program. For all primer pairs, the amplification reactions were carried out using the following thermal profile: Pre PCR → 94°C, 4 minutes; PCR → 94°C, 20 seconds; 59°C, 20 seconds; 72°C, 40 seconds (35 cycles); Post PCR → 72°C, 10 minutes. Exemplary electropherograms showing the separation of PCR products exhibiting a different spatial structure in the PCR-SSCP reaction are shown in Figure 1.
Table 2
Characterization of primers used for studies on SNPs in the IGF-1 gene
Evaluation of silver products by PCR
For the evaluation of PCR products the silvering reaction was used according to Bassam et al. [28].
Sequencing of PCR products showing a different spatial structure in the PCR-SSCP reaction
Sequencing was performed on those PCR products that presented a different separation pattern compared to the control group without the mutant IGF-1 gene. To confirm the occurrence of SNP polymorphisms, direct PCR product sequencing was performed. Sequencing was performed using Sanger’s dideoxy method using 2 ‚, 3’-dideoxyribonucleoside triphosphates (ddNTPs).
As a control, the correct fragment was also sequenced. The PCR reaction was performed on a GeneAmp 2400 PCR System thermocycler (Perkin Elmer) and the process products were purified, precipitating them with ethanol and EDTA. Automatic sequence reading was performed using the ABI PRISM™ 377 automatic DNA sequencer (Applied Biosystems) and the Big Day ™ Terminator Cycle sequencing kit Ready Reaction Kit (Applied Biosystems) according to the manufacturer’s instructions. The results were analyzed using the Sequencing Analysis Software ™ ver. 3.4.1 (Applied Biosystems) and Factura ™.
Statistical analysis
The statistical analysis of the obtained results was carried out using the STATISTICA computer program ver. 5.0 (StatSoft, Inc.). The result was considered statistically significant at the significance level p less than 0.05. Statistical analysis of the distribution of genotypes and alleles in the test and control group was carried out after prior confirmation that the obtained systems remain in a state of equilibrium according to the rules of Hardy and Weinberg. Wild type of the genotype and allele was the reference group.
Results
Table 3 presents the distribution of genotypes and allele frequencies of IGF-1 gene polymorphisms in women diagnosed with an increased breast mammographic density, patients with breast cancer and in the control group (n = 60).
Table 3
Distribution of genotypes and allele frequencies of IGF-1 gene polymorphisms among women diagnosed with an increased breast mammographic density (n = 98), breast cancer patients (n = 135) and in the control group (n = 60)
Polymorphism rs1520220
In the course of analyzes, the influence of the CC genotype on the risk of breast cancer in the case of rs1520220 polymorphism was confirmed. The research was carried out both in the group of patients with breast cancer and in the control group. An increased frequency of the CC genotype was observed in the study group compared to the control (Table 3). The CC homozygote was 2.5 times more frequent in the group of patients than in the control group (OR = 2.6 95% CI 1.01-6.5, p = 0.04) (Table 4).
Table 4
Distribution of genotypes and allele frequencies of IGF-1 gene polymorphisms among women diagnosed with breast cancer (n = 135) and in the control group (n = 60). OR analysis
The obtained results indicate the possibility of a correlation between the rs1520220 polymorphism and the occurrence of this tumor. In women with the CC genotype, the risk of breast cancer is more than 2.5 times higher than in the control group (OR = 2.6 95% CI 1.01-6.5, p = 0.04) (Table 4). In women characterized by an increased breast mammographic density, the frequency of genotype CC is higher compared to the control (χ2 = 5.08, p = 0.02). In addition, the distribution of alleles is significantly different compared to the control (χ2 = 5.25, p = 0.02) (Table 5).
Table 5
Analysis of differences in the distribution of genotypes and alleles of IGF-1 gene polymorphisms between the studied groups
There were no differences in the distribution of the examined genotypes between patients characterized by an increased mammographic density of breasts and women with breast cancer.
In addition, there were no differences in the distribution of genotypes and alleles in the studied groups depending on the menopausal status, BMI, stage of the cancer on the Bloom-Richardson scale (cancer patients) and the degree of mammographic density (patients with dense nipple).
Polymorphism rs2946834
Among women with the AA genotype, the risk of breast cancer is three times higher than in the control group (OR = 3.0 95% CI 1.00-9.15, p = 0.05) (Table 4). The occurrence of the G allele reduces the risk of breast cancer (OR = 0.55 95% CI 0.32-0.95, p = 0.04). In contrast, the presence of the A allele increases almost 2-fold risk of developing breast cancer (OR = 1.81 95% CI 1.05-3.15, p = 0.04). However, the occurrence of the A-allele increases the risk of breast cancer almost twice (OR = 1.81 95% CI 1.05-3.15, p = 0.04).
The frequency of G and A alleles in women with increased breast mammographic density is significantly different from the frequency of these alleles in the control group (p = 0.03) (Table 5). There were no differences in the distribution of genotypes and alleles in the studied groups, taking into account menopausal status, BMI, cancer severity on the Bloom-Richardson scale (patients with cancer) and the degree of mammographic density (patients with dense nipple).
Polymorphism rs5747694
In women who are heterozygous for rs5747694 polymorphism (TG), the risk of breast cancer is twice as high as in the control group (OR = 2.08 95% CI 1.00-4.40, p = 0.05) (Table 4). In women with an increased breast mammographic density, heterozygotes are higher compared to the control (χ2 = 3.75, p = 0.05) (Table 5). There were no differences in the distribution of the examined genotypes between patients characterized by an increased mammography density and women with breast cancer. In addition, there were no differences in the distribution of genotypes and alleles in the studied groups depending on menopausal status, BMI, cancer severity on the Bloom-Richardson scale (patients with cancer) and the degree of mammography density (patients with a thick nipple).
Polymorphisms: rs6214, rs6219, rs5742678
There was no association with an increased risk of breast cancer in the case of the other three polymorphisms. The distribution of genotypes and alleles in women with breast cancer and increased mammographic density was not different in comparison with the control group.
Discussion
The IGF-1 gene is highly polymorphic. Polymorphisms of single nucleotides as well as nucleotide repeats are present within this gene. Polymorphisms of CA microsatellite replicates are located at the 5 ‚and 3’ end of the IGF-1 gene and also in intron 2. As the literature data of the CA185 allele shows, the 3 ‚repeat polymorphism correlates with the high mammographic density of breasts in premenopausal women [31]. The polymorphism of CA repeats in the promoter region is important due to its location. It affects the transcriptional activity of the gene [32, 33]. The first scientists who described the correlation between this polymorphic locus and IGF level were Rosem et al. [34]. However, these results have not been confirmed [35-39]. Lai et al. Showed a small correlation between CA19 polymorphism and breast density in postmenopausal women [40].
Literature data indicate that SNPs of the IGF pathway genes may be better risk factors for breast cancer among women with high breast mammography density compared to microsatellite repeats polymorphisms [22, 37, 41].
Studies of Chinese women’s populations showed that the A/G and G/G genotypes of rs951715 polymorphism in the IGF-1R gene were associated with higher mortality in postmenopausal women. A significant correlation with the survival rate of breast cancer was found in premenopausal women carrying the polymorphisms rs2854744 and rs3110697 of the IGFBP3 gene together with an additional polymorphism rs6413441. High survival rates have been demonstrated for pre-menopausal women with the following genotypes: C/T-T/T (rs3110697), A/C-C/C (rs2854744) and N/A-A/A (rs6413441). This correlation was not found for SNPs of the IGF-1 gene [41].
Because levels of IGF-1 and IGFBP-3 may affect the increased risk of breast cancer among premenopausal women, studies have been undertaken to find out whether there are differences in the regulation of these proteins between women with hereditary BRCA1/2 mutations and those that are not carriers of these mutations. The studies included a large population of women aged 18-40 with hereditary BRCA1/2 mutations and a group without a mutation. There were determined genotypes for IGF-1 and IGFBP-3 polymorphisms. The A-202C polymorphism allele of the IGFBP3 gene was found to be much more frequent among women without BRCA1/2 mutation and was associated with IGFBP3 levels, from the 5th to the 10th day of the cycle and from the 18th to the 23rd day of the cycle. There was no difference in the incidence of IGF-1 genotypes and the level of coding protein between the study groups. The research suggests that it is possible that in young women who are not carriers of hereditary BRCA1/2 mutations there may be a risk of breast cancer due to the high level of IGFBP-3 [42].
Analysis of the literature data indicates that five of the nine IGF-1 gene polymorphisms studied, such as rs5742615, rs5742678, rs5742694, rs1549593, rs1520220, rs6220, rs6214, rs6219, rs2946834 showed a statistically significant relationship with the variable level of IGF-1 among women in menopausal age. This correlation was not shown among men [43]. These were the polymorphisms rs5742678, rs5742694, rs1520220, rs6220 and rs2946834. For all five polymorphisms, lower frequency alleles were associated with high levels of IGF-1.
Two SNPs rs5742615 and rs1549593 did not correlate with IGF-1 levels in menopausal women, but were associated with high levels of this protein in the group of age-matched men. The polymorphisms rs6214 and rs6219 were not related to the level of IGF-1 in both sexes [43].
Five SNPs polymorphisms: rs5742678, rs5742694, rs1549593, rs1520220 and rs2946834 were associated with the risk of breast cancer in menopausal women. Only one polymorphism rs1549593 was not related to the level of IGF-1 among these women [43].
Studies have shown that gene polymorphisms of the IGF pathway are associated with breast density or IGF-1 levels. Genetic analyzes provided the hypothesis that some elements of the IGF pathway may affect the risk of breast cancer, and this effect is the result of their impact on breast tissue morphogenesis [22]. Studies on IGF polymorphisms are still ongoing and show the significant role of the different genetic variants and its impact on mammographic density of breasts [44-48].
As a result of detailed genetic analyzes, the presented study demonstrated a correlation between the rs1520220 polymorphism and the occurrence of breast cancer. The polymorphism rs1520220 is located in intron 3 of the IGF-1 gene [49]. Literature data indicate that it affects the level of protein encoded by this gene in breast tissues [17, 50]. The polymorphism of rs1520220 in intron 3 is associated with high level of IGF-1 and, consequently, high risk of breast cancer [51-53]. It has been shown that the polymorphism (rs1520220) of the IGF-1 gene is associated with high breast density [22, 50]. It should be emphasized that there are scientific reports that confirm that women who are carriers of the rs1520220 polymorphism have a low degree of breast density [19, 25, 54].
In the presented studies, the effect of the CC genotype on the risk of breast cancer was found in the case of rs1520220 polymorphism. The obtained results indicate the possibility of a relationship between the rs1520220 polymorphism and the occurrence of this tumor. In the group of women characterized by an increased breast mammographic density, a relationship between the polymorphism rs1520220 and this phenomenon was observed. The analysis also included a group of patients characterized by an increased breast mammographic density and a group of women with breast cancer. The study evaluated the significance of rs1520220 polymorphism for the development of cancer in women with high mammographic density of the breast. There were no differences in the distribution of the examined genotypes between patients characterized by an increased breast mammographic density and women with breast cancer. The obtained results indicate the lack of significance of the rs1520220 polymorphism for the development of breast cancer in women with an increased mammographic density of the breast.
World literature data indicate that among premenopausal women, polymorphic variants of IGF pathway genes, such as IGF-I, IGFBP-3, IRS1, and PI3KCB may affect breast density and growth factor levels. This suggests that IGF system components may participate in the development of breast cancer [53].
In the presented study, there was no difference in the distribution of genotypes and alleles rs1520220 in the Polish population depending on the menopausal status. The distribution of genotypes did not differ depending on BMI, stage of the cancer on the Bloom-Richardson scale (cancer patient) and breast mammography density (patients with a thick nipple).
In the course of further research, the polymorphism rs294683, which is located in the untranslated 3’UTR (3 ‚untranslated region) of the IGF-1 gene, was tested. This is an important region in which different signal sequences can be found:
In the studies of Linda et al. it was proved that the frequency of the A allele was inversely proportional to breast density in pre- and postmenopausal women [60]. Similar results were obtained in the presented work. In the case of women with increased mammographic breast density in postmenopausal age, the distribution of allele frequencies G (0.72) and A (0.28) were different than in the control group (G 0.83, A 0.17) (Table 3).
The last SNPs that were tested were rs6214, rs6219, rs5742678. Significant relation to IGF1 level was found for rs6219 polymorphism in the population of 2,395 European women (EPIC study) and polymorphism rs5742678 in the group of 420 women from Great Britain [17, 50, 61]. In the case of presented studies, there was no correlation of rs6214, rs6219, rs5742678 polymorphisms with the risk of breast cancer.
Due to the importance of the problem of early detection and treatment of neoplastic diseases, it seems important to study the relationship between polymorphisms and the occurrence and development of tumors. In the presented work, genetic analysis of SNPs of the IGF-1 gene was carried out in the population of Polish women. This type of research is extremely rare in the world, and this is the reason why the analyzes presented above were carried out. In Poland, they can be considered as pilot studies.
To further address the issue of limitations of our study, one has to emphasize, that our groups may be quantitatively unsatisfactory to make final conclusions on genetic phenomena as these should be studied on larger groups. Therefore, further studies would be justified and needed to reveal the common involvement mechanisms of IGF-1 SNPs in breast cancer formation. However the results, obtained in the study, contribute to better knowledge of and information on the molecular mechanisms which support the development of breast carcinoma.
Conclusions
We demonstrated that polymorphisms rs1520220, rs2946834, rs5747694 of IGF-1 are associated with the occurrence of breast cancer but not with increased mammographic density. Therefore we suggest that the association between the polymorphisms of IGF-1 and the risk of developing breast cancer is independent of mammographic density.