


Introduction
The incidence of renal cell carcinoma (RCC) is on the rise yearly worldwide. According to global cancer data from 2020, kidney cancer ranked 14th in terms of incidence rate (2.2%) and 15th in terms of mortality rate (1.8%) [1]. Although nephrectomy can be a curative procedure, approximately 30% of patients with localized clear cell RCC (ccRCC) eventually developed to a metastatic stage, which requires systemic therapy and is associated with high mortality [2].
The inflammatory responses are critical in tumour initiation, progression, invasion, and metastasis development [3]. Moreover, systemic inflammatory markers including neutrophils, lymphocytes, monocytes, and the lymphocyte-to-monocyte ratio (LMR) have shown prognostic value in RCC [4, 5]. During renal carcinogenesis, the renal cancer cells can penetrate the renal capsule and can infiltrate the perirenal adipose tissue (PRAT) [6], a process associated with a poor prognosis [7]. The thermogenic activity of perirenal adipocytes promotes the growth, invasion, and metastasis of the renal cancer cells and reduces their antitumour efficacy through the interaction of the renal cancer cells with the adjacent PRAT [8]. The Mayo adhesive probability score (MAPS) is an accurate imaging scoring system in predicting PRAT adhesion, which was first proposed in robotic-assisted partial nephrectomy [9]. Higher MAPS were associated with poor progression-free survival of patients with localized RCC treated with surgery [10]. The Mayo Clinic stage, size, grade, and necrosis (SSIGN) score comprise a dependable, accessible model with a prognostic value on the basis of readily obtained variables from the clinician and pathologist [11].
The predictive models combining information from multiple factors are widely accepted for their value in counselling patients and determining the necessity of an adjuvant therapy in the genitourinary oncology [11]. However, the joint utilization of preoperative cancer-related inflammation biomarkers, PRAT image-based scoring system, and tumour characteristics for prognosis of patients with localized ccRCC has not been covered.
Aim
This study was designed to assess the clinical implication of a newly proposed prognostic model for predicting DFS in patients with localized ccRCC. This model was a joint utilization of the LMR, SSIGN, and MAPS, termed as the LMR-SSIGN-MAPS.
Material and methods
Population
From January 2010 to December 2015, a total of 1834 patients with localized ccRCC, who underwent radical or partial nephrectomy at the Department of Urology of the Cancer Hospital Chinese Academy of Medical Sciences, were reviewed with retrospection.
The enrolment standards for this study were as follows: (1) no other solid tumours prior to surgery; (2) no history of using statins for hyperlipidaemia; (3) no thyroid disease, no liver or kidney dysfunction; (4) no bilateral or multiple ccRCC, no previous kidney surgery or kidney injury; (5) no signs of extrarenal metastases and preoperative adjuvant therapy; (6) definitive pathological diagnosis and complete resection of tumour with negative margins; (7) complete preoperative medical information or follow-up data; and (8) available preoperative MAPS measurements with computerized tomography (CT) or magnetic resonance imaging (MRI) scan.
Finally, 612 patients were integrated into this study. The study protocol was authorized by the Ethics Committee of the Cancer Hospital Chinese Academy of Medical Sciences. Furthermore, all patients supplied informed consent.
Data collection
Clinical information, consisting of general demographic variables, preoperative peripheral haematological indicators, pathological characteristics, and MAPS, were collected (Table I). Tumours were routinely fixed in 10% formalin, and paraffin-embedded sections were stained with haematoxylin and eosin (H&E). The pathological features were assessed by 2 senior pathologists on the basis of the Fuhrman grading system and the 2010 American Joint Commission on tumour-node-metastasis staging [12, 13]. Additionally, some indicators derived from preoperative peripheral blood that have been reported to be significant for the prognosis of renal cell carcinoma were collected. Castelli risk index-I (CRI-I) was defined as the ratio of total cholesterol (TC) to high-density lipoprotein cholesterol (HDL-C), while Castelli risk index-II (CRI-II) was defined as the ratio of low-density lipoprotein cholesterol (LDL-C) to HDL-C [14]. The prognostic nutritional index (PNI) was defined as albumin + 5 × lymphocyte [15]. The preoperative controlling nutritional status (CONUT) score was calculated on the basis of the serum albumin level, total lymphocyte count, and total cholesterol level [16]. The systemic inflammation score (SIS) was calculated on the basis of preoperative serum albumin and LMR [17].
Table I
Variables in the analysis (n = 44)
The MAPS was computed by 2 measurements as follows: the thickness of the posterior renal fat and the extent of the perirenal fat stranding around the renal tumour at the level of the renal vein on CT scan or T1 MRI scan (Photo 1). The thickness of the posterior renal fat was calculated as the distance between the posterior renal capsule and the body in centimetres (< 1 cm = 0 points; 1.0–1.9 = 1 points; ≥ 2.0 cm = 2 points). A perirenal fat stranding extent score was acquired at one level (no stranding = 0 points, mild stranding = 2 points, severe stranding = 3 points). The total score (0–5 points) was obtained by adding the 2 scores together [9].
Photo 1
Mayo Adhesive Probability (MAP) score calculation-the thickness of the posterior renal fat (white line on the image) and grading of perinephric stranding on CT and MRI. A, D – No stranding: 0 points. The perirenal adipose tissue shows no stranding on (A) CT and (D) MRI. B, E – MAP score: 4 points. The thickness of the posterior renal fat is 2.4 cm (2 points) with moderate stranding (2 points) on (B) CT, and the posterior distance is 2.6 cm (2 points) with moderate stranding (2 points) on (E) MRI. C, F – Severe stranding: 3 points. The perirenal adipose tissue shows severe stranding with thick image-dense bars of inflammation on (C) CT and (F) MRI
CT – computed tomography, MRI – magnetic resonance imaging.

The SSIGN score was calculated based on tumour stage, size, grade, and necrosis as follows. (i) T-stage: 0 points for pT1 and pT4, 1 point for pT2 and 2 points for pT3; (ii) N-stage: 0 points for pNx and pN0, 2 points for pN1 and pN2; (iii) M-stage: 0 points for pM0 and 4 points for pM1; (iv) Tumour size: 0 points for less than 5 cm, 2 points for more than 5 cm; (v) Nuclear grade: 0 points for grade 1 and 2, 1 point for grade 3, 2 points for grade 4; (vi) Necrosis: 0 points for no necrosis, 2 points for necrosis. The total score (0–15 points) was obtained by adding the 6 scores [11].
A follow-up physical examination, routine haematological index, and imaging such as CT or MRI were performed every 3–6 months 2 years after surgery and annually thereafter. The study endpoint was DFS, defined as the time between surgery and local recurrence or distant metastasis of kidney cancer or death from any cause. Survival was defined from the telephone interviews and the outpatient medical records. The follow-up period ended in December 2021.
Statistical analysis
The patients were randomly divided into a training cohort and a validation cohort in a 7 : 3 ratio until the 2 cohorts were not significantly different in terms of all the variables (p-value > 0.05, Table II).
Table II
Baseline characteristics of the 612 patients
[i] CHD – coronary heart disease, BMI – body mass index, PN – partial nephrectomy, RN – radical nephrectomy, LMR – lymphocyte to monocyte ratio, SSIGN – the Mayo Clinic Stage, size, grade, and necrosis score, CONUT – controlling nutritional status score, MAPS – Mayo adhesive probability score, SIS – systemic inflammation score, SD – standard deviation.
The median and standard deviation of continuous variables were included in the descriptive analysis. The frequencies and proportions were analysed in the categorical variables. The p-value was computed by applying the rank sum test on continuous variables and the χ2 test on categorical variables. The LASSO Cox regression (R software and “glmnet” package) was conducted to determine the DFS-related variables to develop predictive models for feature selection of high-dimensional variables and multicollinearity among variables. The optimal cut-off values of LMR were determined by using the X-tile software. The variables with p < 0.05 level were identified as statistically independent risk factors in the multivariate Cox regression analysis. The precision of the risk prediction model was assessed using the value of the Harrell’s C-index.
A 2-sided test was used for all the statistical tests. Statistically significant was defined as p-value < 0.05. The multivariate Cox regression analysis and the Harrell’s C-index were performed with R version 3.6.2. Moreover, the mean C-index was computed with Stata 14.0 (Stata Corp. Texas, USA).
Results
Baseline characteristics
In close compliance with the inclusion criteria, 612 patients with localized ccRCC who underwent surgery from January 2010 to December 2015 were incorporated and randomly divided into a training cohort (n = 414) and a validation cohort (n = 198) (Figure 1).
Figure 1
Patient selection flowchart
ccRCC – clear cell renal cell carcinoma, CT – computed tomography, PN – partial nephrectomy, RN – radical nephrectomy, MRI – magnetic resonance imaging, MAPS – Mayo adhesive probability score.

The study included 432 (70.6%) men and 180 (29.4%) women, with a mean age of 53.1 ±10.6 years. The pattern of age allocation was as follows: 173 (28.3%) patients ≥ 60 years and 439 (71.7%) patients < 60 years. A radical nephrectomy was conducted in 392 (64.1%) patients and partial nephrectomy in 220 (35.9%) patients. The pathological stages T1, T2, and T3 were 486 (79.4%), 17 (2.8%), and 109 (17.8%) cases, respectively. Moreover, 55 (9.0%), 349 (57.0%), 188 (30.7%), and 20 (3.3%) cases were in Fuhrman grades 1, 2, 3, and 4, respectively. The mean follow-up period was 77.2 months. During the follow-up period, 92 (15.0%) patients had distant metastasis or local recurrence and 56 (9.2%) died, of which 48 (7.8%) died of cancer. The 5-year DFS rate was 88.6% in the overall cohort.
The prognosis values based on the LMR, SSIGN, and MAPS
Among the 44 variables, the risk indicators (regression coefficients) selected by LASSO Cox regression were LMR (0.025) in blood indexes; Fuhrman tumour grading, size, and SSIGN (0.062, 0.064, 0.222) on pathology; and MAPS (0.470) for images (Table III, Figures 2 A, B). The optimum cut-off value on the LMR was 2.80 (Figure 2 C), and the LMR (≥ 2.8 vs. < 2.8) was assigned points (0 or 1) to each indicator. According to the cut-offs in the literature, SSIGN (0–3 vs. 4–7 vs. 8) were assigned points (0, 1, 2), and MAPS (0–3 vs. 4–5) were assigned points (0 or 1) to each indicator [10, 18]. The Kaplan-Meier survival analysis showed that LMR, MAPS, and SSIGN have significant prognosis values in predicting DFS (p = 0.019, p < 0.0001, and p < 0.0001) (Figures 2 D–F).
Table III
Coefficients of significant variables screened by LASSO regression in the training cohort
| Variables | Coefficients | HR |
|---|---|---|
| MAPS | 0.470 | 1.601 |
| SSIGN | 0.222 | 1.249 |
| Size | 0.064 | 1.066 |
| Fuhrman grade | 0.062 | 1.063 |
| LMR | 0.025 | 1.025 |
| Haemoglobin | -0.002 | 0.998 |
| BMI | –0.021 | 0.979 |
| Nephrectomy (laparoscopic/open surgery) | –0.157 | 0.854 |
Figure 2
Clinical outcomes based on LMR, SSIGN, and MAPS. A – LASSO coefficient profiles of the 44 variables; B – 10-fold cross-validation for tuning parameter selection in the LASSO model; C – The optimal cut-off value for LMR
LMR – lymphocyte to monocyte ratio, SSIGN – the Mayo Clinic Stage, size, grade, and necrosis score, MAPS – Mayo adhesive probability score, DFS – disease-free survival.

Figure 2
Cont. D – Kaplan-Meier analysis for DFS based on LMR. E – Kaplan-Meier analysis for DFS based on MAPS. F – Kaplan-Meier analysis for DFS based on SSIGN
LMR – lymphocyte to monocyte ratio, SSIGN – the Mayo Clinic Stage, size, grade, and necrosis score, MAPS – Mayo adhesive probability score, DFS – disease-free survival.

Predictive risk LMR-SSIGN-MAPS model establishment
One multivariate Cox regression analysis of the training cohort further revealed that LMR (HR = 1.04, p = 0.009), SSIGN (HR = 1.36, p < 0.001), and MAPS (HR = 1.99, p < 0.001) were considered to be independent risk variables (Figure 3 A). However, haemoglobin, body mass index (BMI), triglyceride, SIS, NLR, PLR, PNI, and CONUT were considered to be non-independent risk variables (p > 0.05). Consequently, the LMR-SSIGN-MAPS (LSM) risk model combining LMR, SSIGN, and MAPS was constructed (Figure 3 B). The LMR-SSIGN-MAPS score was 0 in 434 (70.9%) cases, 1 in 258 (21.9%) cases, 2 in 32 (5.2%) cases, 3 in 10 (1.6%) cases, and 4 in 2 (0.3%) cases. Furthermore, patients were classified into low-risk (score 0), intermediate-risk (score 1 or 2), and high-risk (score 3 or 4) groups according to the LMR-SSIGN-MAPS model. The 5-year DFS rates were 94%, 77.1%, and 50%, respectively.
Figure 3
The construction of LMR-SSIGN-MAPS model. A – Multivariate Cox regression analysis in the training cohort. B – The LMR-SSIGN-MAPS model combining LMR, SSIGN, and MAPS
BMI – body mass index, TG – triglyceride, HGB – haemoglobin, NLR – neutrophil to lymphocyte ratio, PLR – platelet-to-lymphocyte ratio, LMR – lymphocyte to monocyte ratio, PNI – prognostic nutritional index, CONUT – controlling nutritional status score, SIS – systemic inflammation score, SSIGN – the Mayo Clinic Stage, size, grade, and necrosis score, MAPS – Mayo adhesive probability score.

Accuracy of the LMR-SSIGN-MAPS model compared with other models
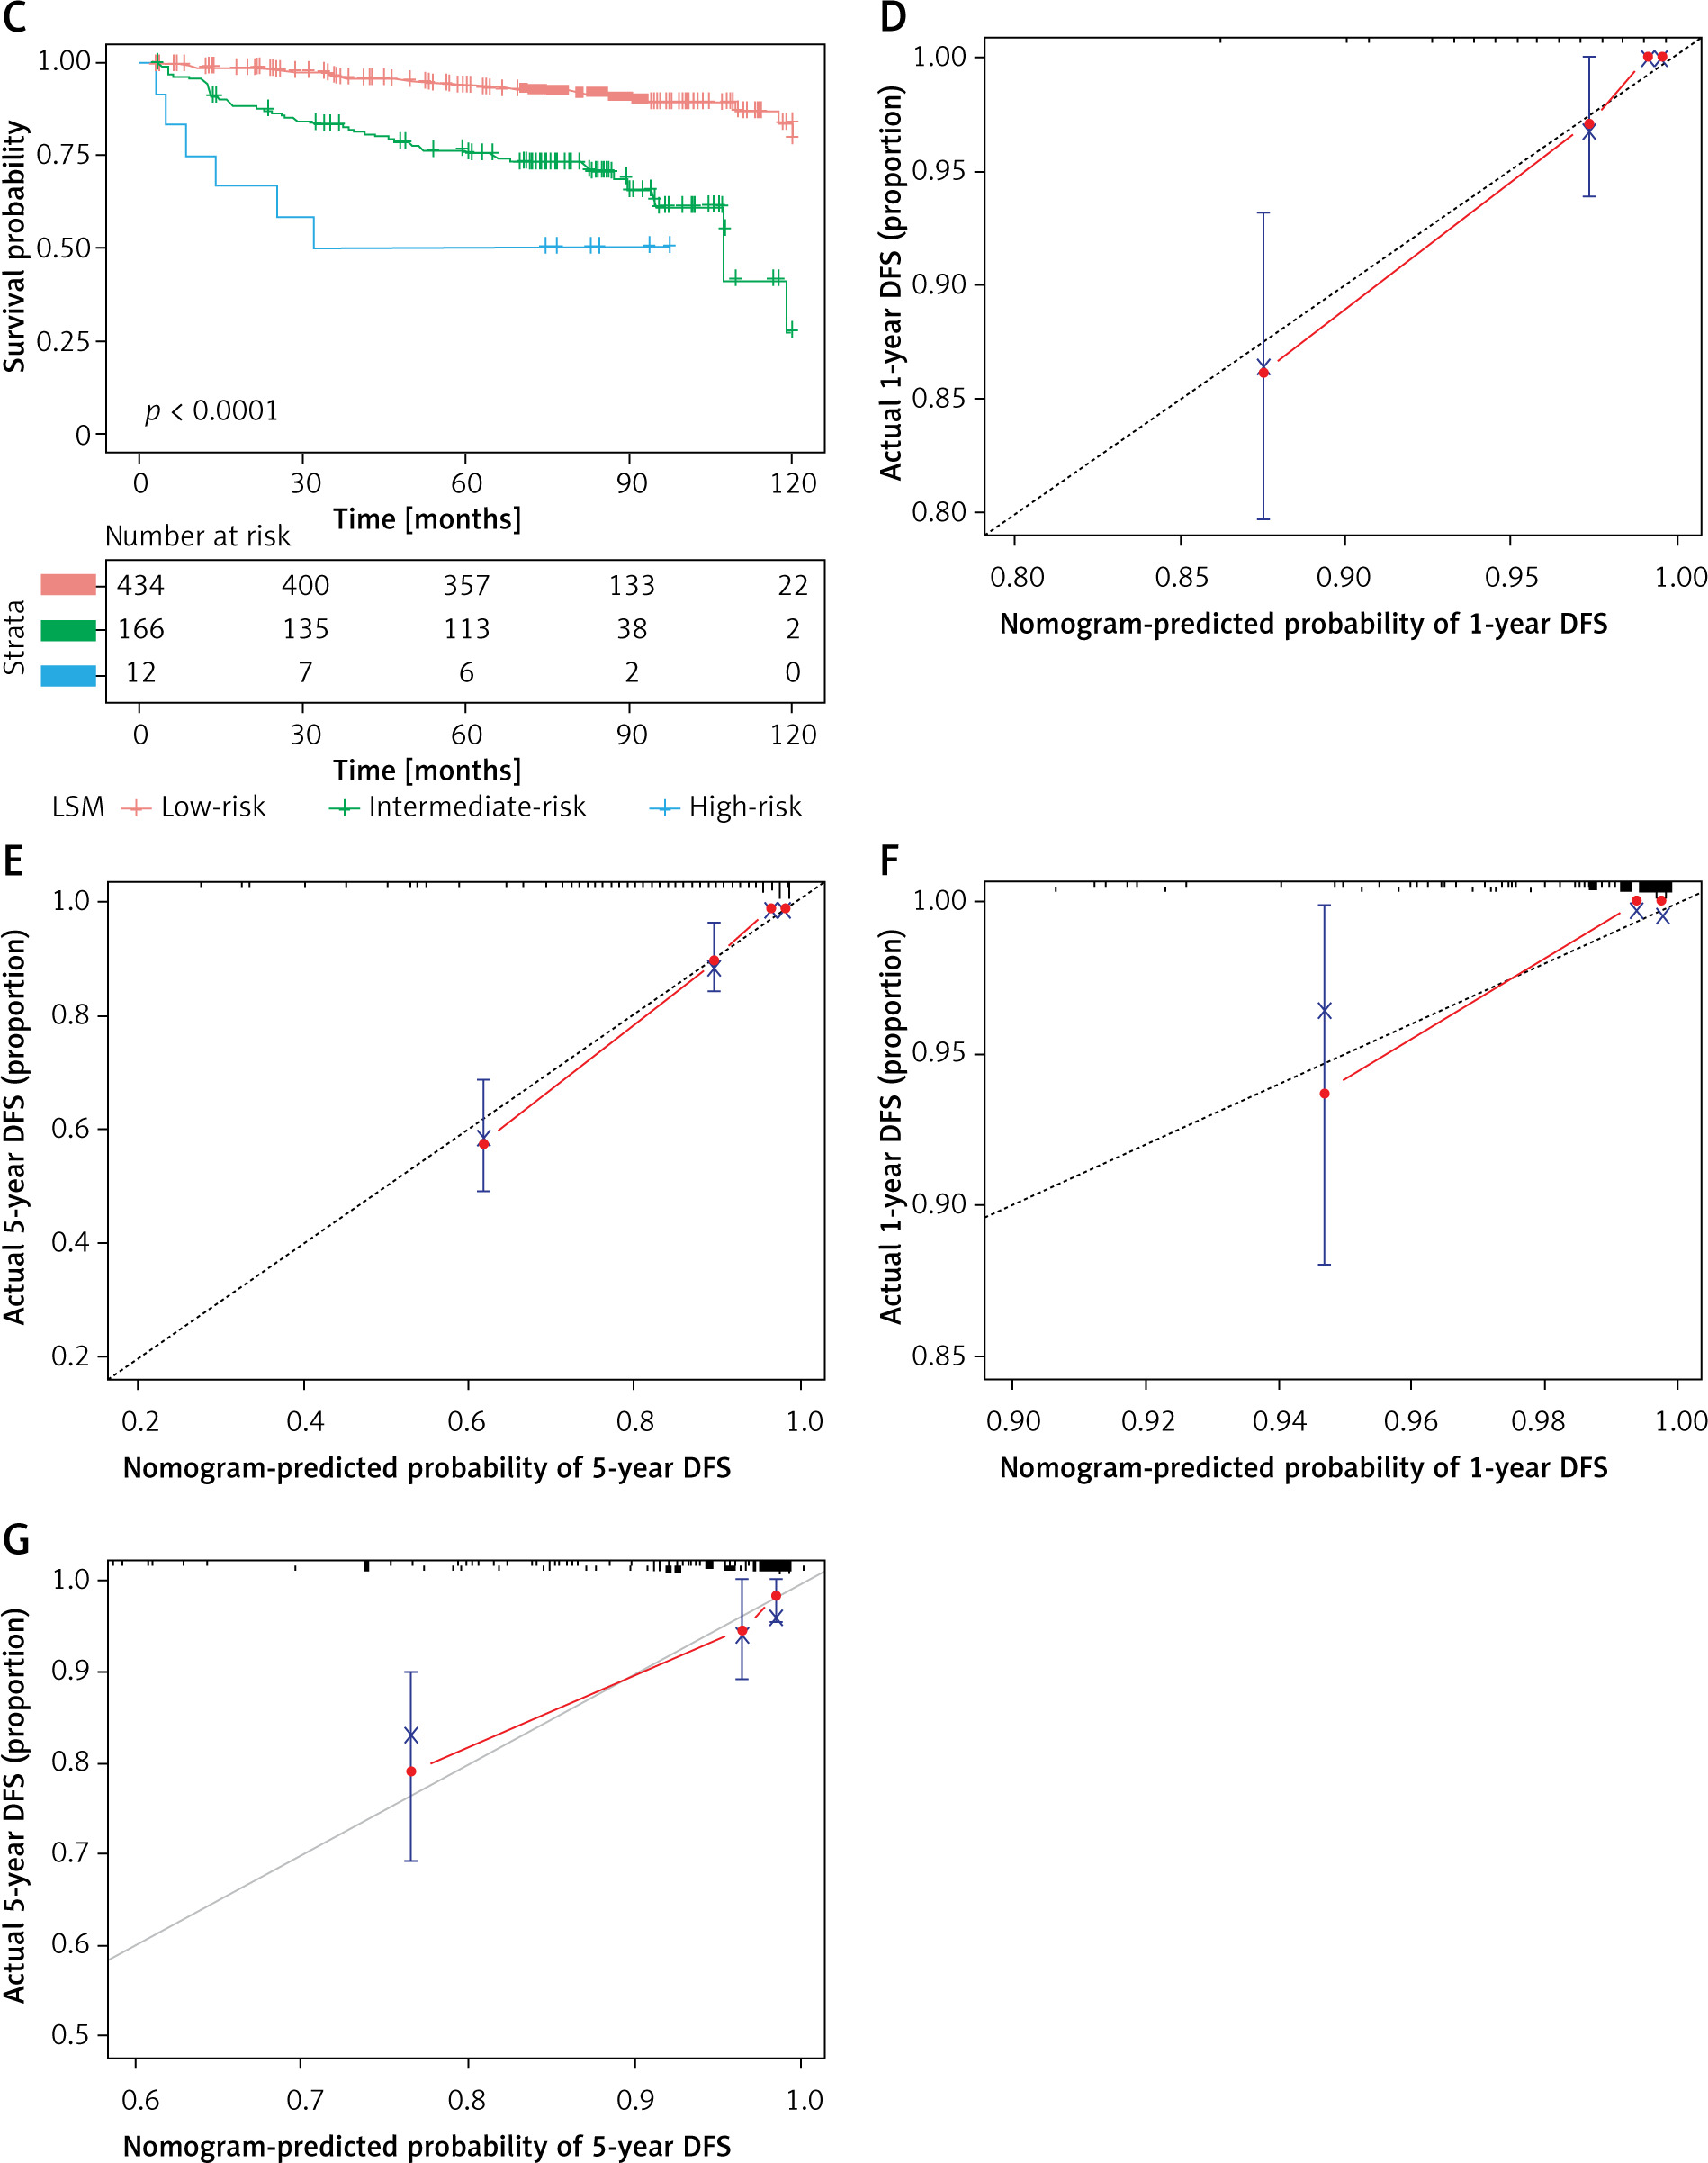
The accuracy among the LMR-SSIGN-MAPS (model 1), SSIGN-MAPS (model 2), and SSIGN score (model 3) was compared using Harrell’s C-index. The Harrell’s C-index for LMR-SSIGN-MAPS were 0.854 (95% CI: 0.815–0.893) and 0.848 (95% CI: 0.807–0.889) comparing with SSIGN scores of 0.782 (95% CI: 0.777–0.787) and 0.772 (95% CI: 0.699–0.845) in the training and validation cohorts, respectively (Table IV, Figures 4 A, B). The Kaplan-Meier survival analysis revealed that the stratified groups, based on the LMR-SSIGN-MAPS model, have significant differences in predicting DFS in localized ccRCC. Higher LMR-SSIGN-MAPS score was associated with poor DFS in the overall cohort (p < 0.0001) (Figure 4 C). The calibration curves displayed that the predicted probabilities of 1.5-year DFS (Figures 4 D, E) in the training cohort and 1.5-year DFS (Figures 4 F, G) in the validation cohort matched well with the observed probabilities.
Table IV
Harrell’s C-Index of prediction accuracy of LMR-SSIGN-MAPS and other models for DFS
Figure 4
Accuracy of LMR-SSIGN-MAPS model compared with other models. A – Use the c-index to compare the LMR-SSIGN-MAPS model with the other models in the training cohort; B – Use the c-index to compare the LMR-SSIGN-MAPS model with the other models in the validation cohort. (model 1, LMR-SSIGNMAPS score; model 2, SSIGN-MAPS score; model 3, SSIGN score)
DFS – disease-free survival, LMR – lymphocyte to monocyte ratio, C-index – Harrell’s concordance (c)-index, SSIGN – the Mayo Clinic Stage, size, grade, and necrosis score, MAPS – Mayo adhesive probability score.

Figure 4
Cont. C – Kaplan-Meier analysis for DFS based on LMR-SSIGN-MAPS (LSM) model in the overall cohort. (low risk, LMR-SSIGN-MAPS score = 0; moderate risk, LMR-SSIGN-MAPS score = 1 or 2; high risk, LMR-SSIGN-MAPS score = 3 or 4); D – The calibration curve of the prediction for the patients’ 1-year DFS in the training cohort; E – The calibration curve of the prediction for the patients’ 5-year DFS in the training cohort; F – The calibration curve of the prediction for the patients’ 1-year DFS in the validation cohort; G – The calibration curve of the prediction for the patients’ 5-year DFS in the validation cohort
DFS – disease-free survival, LMR – lymphocyte to monocyte ratio, C-index – Harrell’s concordance (c)-index, SSIGN – the Mayo Clinic Stage, size, grade, and necrosis score, MAPS – Mayo adhesive probability score
Discussion
We constructed the predictive model of the integrated and developed LMR-SSIGN-MAPS score in patients with localized ccRCC. A higher LMR-SSIGN-MAPS score was significantly associated with poorer DFS. The finding identified that the LMR-SSIGN-MAPS, which consisted of preoperative biomarkers of inflammation, PRAT image-based scoring system, and pathology features demonstrated its strengths of simplicity and high predictive power.
Monocytes can differentiate into macrophages and dendritic cells. Furthermore, tumour-associated macrophages (TAMs) are the most dominant subpopulation of myeloid cells [19], which have been correlated with a poor prognosis [20]. Myeloid-derived suppressor cells (MDSCs) with tumour-promoting properties such as elimination of adapted antitumour immune responses and promotion of metastasis are a population of heterogeneous bone marrow cells [21]. The levels of monocytes can, at a certain level, represent the tumour burden of patients with cancer [5]. T cells are the predominant immune cell populations in the tumour microenvironment (TME) on ccRCC, with an average of 51% in the samples [22]. Comparatively low levels of lymphocytes may weaken tumour automonitoring and defence, leading to decreased antitumour efficacy [23]. Multiple studies have confirmed that LMR is a superior prognostic predictor for some tumours [5]. Therefore, patients with RCC with high LMR tend to experience advantageous urological outcomes. Our study proved that LMR was a significant independent risk variable (p = 0.009), and a low level of LMR (< 2.80) is associated with decreased DFS compared with high LMR (> 2.80) in patients with localized ccRCC (p = 0.008).
Because of the advantages of the videoscopic approach in terms of faster recovery, shorter hospital stay, and improved quality of life for the donor, Jakimowicz et al. showed that hand-assisted laparoscopic donor nephrectomy was a safe approach and should be used routinely instead of open surgery [24]. In our study, laparoscopic partial nephrectomy and laparoscopic radical nephrectomy also had the advantages of less surgical trauma, less bleeding, faster postoperative recovery, and fewer complications compared with open surgery, but the type of surgery was a non-independent risk variable (regression coefficients –0.157). Furthermore, in spite of the Fuhrman grade and size were obtained by the LASSO Cox regression screening from 44 variables; (i) the SSIGN was constructed on the basis of clinic stage, size, grade, and necrosis which includes Fuhrman grade and size [11]; (ii) the regression coefficient of SSIGN was significantly higher than both Fuhrman grade and size; (iii) the SSIGN was reconfirmed as a significant risk variable by multivariate Cox regression analysis (p < 0.001); and (iv) with 20 years of follow-up, the SSIGN continued to be a helpful prognostic tool, and the model kept its high predictive power for contemporary radial nephrectomy (RN) and partial nephrectomy (PN) patients [25]. Therefore, the SSIGN score was chosen for constructing a prognostic model, and high SSIGN scores were associated with decreased DFS in patients with localized ccRCC (p < 0.001). However, SSIGN only included oncological features, and in our prediction model, SSIGN alone had a Harrell’s C-index of 0.782, whereas in combination with LMR and MAPS, Harrell’s C-index improved significantly to 0.854 in the training cohort.
Cancer cells can reprogram the metabolism of neighbouring noncancerous cells to provide extra energy substrates and metabolites for accelerated neoplasm growth [26]. Wei et al. reported that ccRCC cells produce a parathyroid hormone-related protein that facilitates PRAT browning through protein kinase A activation, leading to the release of excessive lactate to promote ccRCC growth, infiltration, and metastasis [8]. Adipose tissue secretes various adipokines, in particular vascular endothelial growth factor and interleukin 6, which are responsible for the induction of angiogenesis and inflammation, and they are correlated with a more invasive pathological profile and poor prognosis of RCC [27]. The MAPS is a score system calculated by measuring the thickness of the posterior renal fat (representing visceral obesity possibly) and the extent of perirenal fat stranding (representing organ inflammation possibly), which is correlated with progression-free survival in localized RCC [10]. Consistent with this report, our study proved that MAPS is a significant risk variable (p < 0.001), and high MAPS was correlated with a decrease in DFS compared with lower MAPS in patients with localized ccRCC (p < 0.001).
A growing body of predictive algorithms and nomograms were usually used for predicting the outcomes of RCC after surgery [28, 29]. In our study, the LMR-SSIGN-MAPS model was constructed for predicting DFS in patients with localized ccRCC. Because Harrell’s C-index is more applicable to censored data [30], it is used to assess the model’s predictive power. In training and validation cohorts, the LMR-SSIGN-MAPS model (Harrell’s C-index, 0.854, 0.848) has higher accuracy compared with the SSIGN score (Harrell’s C-index, 0.782, 0.772). Based on the LMR-SSIGN-MAPS model, the K-M survival analysis showed that higher LMR-SSIGN-MAPS scores were significantly correlated with poorer DFS in the overall cohort (p < 0.0001). Therefore, the integrated prognostic model LMR-SSIGN-MAPS was in agreement with the view that multiple marker integration can be used to provide higher accuracy and predictive efficacy [31]. However, certain limitations with this model warrant further discussion. Firstly, the enrolment of patients exclusively from a single centre and the dependency of model formulation and verification on retrospective datasets predispose to a selection bias. Secondly, due to the slow update of the patients’ image storage and retrieval system, fewer image data were available for early patients, and fewer figures were obtained as the time lengthened. Thirdly, the routine blood tests did not contain C-reactive protein before 2013 in our centre, so it was not possible to incorporate all potential correlates like C-reactive protein and the modified Glasgow prognostic score for LASSO Cox regression analysis. Finally, as Higuchi et al. pointed out, the real incident rate of abdominal wall pseudohernia is limited by the retrospective design of the study and the modest sample volume, and so it should be accurately quantified by more large-scale studies and further meta-analyses [32]. Because the validations were conducted internally, we were unable to rule out the possibility that the choice of variables and thresholds led to overfitting of the model, requiring external validations in further multicentre studies.
Conclusions
The LMR-SSIGN-MAPS comprehensive prognostic model, consisting of preoperative inflammatory biomarkers, a PRAT image-based scoring system, and pathological features, showed the advantages of ease of use and high predictability and might be also used as a potential prognostic model for predicting DFS in patients with localized ccRCC.