


Introduction
The phosphatidylinositol 3-kinase (PI3K)/AKT/mechanistic target of rapamycin (mTOR) signaling pathway dominates a wide range of cellular processes including survival, proliferation, and growth, is regulated by many signaling proteins upstream and regulates many effectors downstream. This pathway is hyperactivated or altered in many types of cancer [1].
mTOR is a serine/threonine kinase that acts through two structurally and functionally distinct protein complexes, the mTOR1 complex (mTORC1) and the mTOR 2 complex (mTORC2), to detect and integrate multiple intracellular and environmental signals [2, 3].
It is excessively over-activated in more than 70% of cancers [4]. In recent years, it has been widely demonstrated in animal models and cancer patients that mTOR dysfunction contributes to tumorigenesis [5]. Thus, the components of the mTOR pathway are among the most frequently mutated genes in cancer [6].
Several types of mTOR inhibitors, such as rapamycin, its rapalogs and mTORC1/2 kinase inhibitors, have been studied in various cancer models, including breast cancer, lung cancer, colorectal cancer, and others. However, the effects of mTOR inhibitors used as monotherapy in cancer are sometimes mitigated by several mechanisms of resistance [7].
Rapamycin is an allosteric inhibitor of mTOR and has been approved as an immunosuppressant, but interest is focused on its anticancer potential. However, the performance of rapamycin and its analogs (rapalogs) has not been distinguished despite isolated success in subsets of cancers, suggesting that the full therapeutic potential of mTOR targeting has not yet been exploited. A new generation of competitive adenosine triphosphate (ATP) inhibitors that directly target the mTOR catalytic site exhibits potent and complete inhibition of mTOR and is in early clinical trials [8].
Therefore, new therapeutic strategies based on mTOR inhibition need to be further developed, including combination therapies targeting other pathway inhibitors [9]. Inhibition of the PI3K/AKT/mTOR pathway increases antitumor activity [10]. Studies have shown that the combination of compounds simultaneously targeting different molecules of the PI3K/AKT/mTOR pathway leads to synergistic activity[11].
Computational design has indeed become a powerful and essential tool in drug discovery, especially in the context of developing dual-targeted drugs for novel kinase targets. Kinases are enzymes involved in various cellular processes and have been implicated in many diseases, including cancer. Designing drugs that can target multiple kinases simultaneously can offer significant advantages in terms of therapeutic efficacy [12].
Based on these results, we provide an in silico strategy for the exploration of competitive dual PI3K/mTOR and AKT/mTOR inhibitors of ATP, after two previous explorations of AKT/PI3K and mTOR/PI3Kinhibitors, and PI3K/AKT and mTOR/AKT inhibitors [13, 14].
The marked interest in the development of new PI3K/AKT and PI3K/mTOR inhibitors as potential agents for cancer treatment has prompted us to explore the possibility of developing these inhibitors on the basis of quantitative structure-activity relationship (QSAR) models to predict bioactivity of PI3K and AKT inhibitors towards mTOR and the interaction of the best will be evaluated by docking analysis.
Material and methods
Dataset generation
Mechanistic target of rapamycin inhibitors were taken from Binding DataBase (https://www.bindingdb.org) and their IC50 (concentration of molecules causing 50% inhibition) was converted to a logarithmic scale, pIC50. A total of 170 chemically different compounds with high activity with pIC50 greater than 8 were recruited to construct the mTOR-QSAR model. AKT and PI3K inhibitors with a pIC50 greater than 8 were also selected with the aim of predicting their activity towards mTOR using the developed QSAR model and exploring their dual activity. Compounds of significant activity were chosen to predict future effective dual inhibitors.
Quantitative structure-activity relationship model generation
184 2D descriptors available on the MOE 2008.10 (obtained from Chemical Computing Group (CCP); Montreal, QC, Canada) [15] were calculated for the 170 compounds. Invariant and insignificant descriptors were initially eliminated; then the QSAR contingency descriptor selection and intercorrelation matrices between descriptor pairs were used to extract the 52 most relevant molecular descriptors, which were employed for the distance calculation of each database entry.
All 170 selected compounds were distributed randomly to a training set with 128 compounds (75% of the data) and a test set consisting of 42 compounds (25% of the data).
Partial least squares (PLS) analysis based on the leave-one-out (LOO) method was used to correlate molecular descriptors with pIC50 values.
Quantitative structure-activity relationship model validation
The internal validation procedure evaluates the relative predictive performance of the QSAR model, firstly via the correlation coefficient (R2), which is used to measure the correlation between the experimental pIC50 and the predicted interest values with the purpose of observing the variability between the variables in the set test, and secondly by the root mean square error (RMSE), which is used to evaluate the relative error of the QSAR model.
The model is also tested by cross-validation using the LOO method and the computation of the correlation coefficient (R2) and mean squared error (RMSE), while the detection of outliers was conducted using Z-Score, $ Z-SCORE (absolute difference between the value of the model and the activity field, divided by the square root of the mean square error of the data set) and $ XZ-SCORE (absolute difference between the value of the model under a leave-one-out cross validation scheme and the activity field, divided by the square root of the mean square error of the data set).
External validation evaluates the activities of the predictions and the calculation of the numerical parameters using the model.
Activity prediction
The constructed and validated QSAR-mTOR model was used to predict the activity of two groups of AKT and PI3K inhibitors against mTOR, a first one being AKT inhibitors and second one being PI3K inhibitors. These inhibitors, retrieved from the Binding database (https://www.bindingdb.org), have a pIC50 greater than 8 with 578 inhibitors for AKT and 477 inhibitors for PI3K.
After calculating the predicted activity, the 40 inhibitors with the best predictions in each group were selected for docking into mTor in order to explore their dual activity.
Molecular docking
The 3D coordinates of the PI3K inhibitors as well as AKT that showed the best predicted activity in the QSAR-mTOR model were generated from 2D by MarvinView 5.4.1.1. For the docking analysis, 4JT6 (PDB ID), the mTOR crystallized structure recovered from the PDB database with a resolution of 3.6 Å was used. For docking studies mutual graph learning (MGL) tools 1.5.6 with AutoGrid4 and AutoDock vina (Scripps) [16] were used. The mTOR structure was hydrogenated using MGL tools and PyMol was used to visualize the results [17].
In this study we followed the same docking strategy used by the authors in previously published studies [18]. The Grid boxes were generated, using MGL tools 1.5.6, around the active site of the two 3D structures of the mTOR kinase protein. The Grid boxes were set to have 16 to 20 Å of edge with coordinates x = 49.037, y = –0.839, z = –45.349. These coordinates were determined using the potential substrate binding residues as centroids (in the hinge region and the activation loop) [19].
AZD8055 and XL388 are known mTOR inhibitors and were also docked to mTOR to serve as a control to evaluate the docking results. Their 3D structures were obtained from PubChem.
Results
Quantitative structure-activity relationship analysis
The mTOR-QSAR model was built based on 52 molecular descriptors; the validation procedure evaluates the predicted activities and the residuals for the molecules in the training set. In cross-validation, the model is tested using a LOO method. An mTOR-SAR model with a correlation coefficient (R2) of 0.80813 and an RMSE of 0.17756 was obtained after the QSAR regression analysis of 170 molecules. It was validated and evaluated by the cross-validation method LOO. The predictive performance of this model was represented by cross-validated RMSE with 0.54236 and R2 with cross-validation of 0.65460.
Figure 1 presents the plot of both the experimental and the predicted inhibitory potency inpIC50 values of the training and test set compounds, showing a comparable and similar distribution between the two groups. No outliers were detected in the test set data, and all compounds were well-predicted with a residual value less than one log unit.

Virtual screening
The mTOR-QSAR model developed and validated was used to calculate the predicted activity of AKT and PI3K inhibitors against mTOR. Then, the 40 inhibitors with the best predictions in each group were chosen to perform their docking into mTOR. The best predicted AKT and PI3K inhibitors present pIC50 activities in the range 9.36–9.95 and 9.23–9.87, respectively.
Molecular docking studies
The docking scores (affinity) obtained from the docking of AKT inhibitors and PI3K inhibitors in the catalytic site of mTor were between –7.6 and –9.6 kcal/mol for the AKT inhibitor group and between –3.0 and –10.6 kcal/mol for the PI3K inhibitor group. The mTOR reference inhibitors AZD8055 and XL388 presented score of –7.2 and –8.6 kcal/mol, respectively (Tables 1, 2).
Table 1
Docked interaction analysis of AKT inhibitors screened into mTOR
Table 2
Docked interaction analysis of PI3K inhibitors screened into mTOR
Discussion
The PI3K/AKT/mTOR pathway is stimulated by numerous growth factors and their receptors, and it regulates metabolism, growth, survival, cell proliferation, and angiogenesis.
This pathway is one of the most frequently mutated pathways in cancer, leading to cancer progression and induces resistance to existing treatments. Combination inhibition of PI3K/AKT/mTOR signaling pathways is an approach to overcome the acquisition of resistance to cancer treatment.
In order to explore new common inhibitors of AKT/mTOR and PI3K/mTOR, an mTOR2D-QSAR model was constructed to predict the activity of one group of AKT inhibitors and another one of PI3K, then docking of those that had the best prediction (the top 40 in each group), whose results were compared to those of AZD8055 and XL388, was performed.
The mTOR inhibitors used to construct the QSAR model and those of AKT and PI3K whose activity towards mTOR was predicted were extracted from Binding Database and selected according to their IC50 bioactivity. The model was built by the PLS method using MOE software.
The AKT and PI3K inhibitor docking score compared to the AZD8055 and XL388 score predicts that the AKT inhibitors have an affinity between –7.6 and –9.8 kcal/mol and those of PI3K have an affinity between –3.0 and –10.6 kcal/mol, while AZD8055 and XL388 have affinities of only –7.8 and –8.6 kcal/mol, respectively. Therefore 39 AKT inhibitors and 30 PI3K inhibitors had an affinity higher than that of AZD8055, and 17 AKT inhibitors and 22 PI3K inhibitors had a higher affinity than that of XL388. Thus, the affinity and interaction of XL388 would be more effective than that of AZD8055.
Visualization of these interactions showed that the different compounds adapt to the ATP binding site forming hydrogen bonds, in particular with the residue V2240, which is considered as a hinge residue for mTOR. The best inhibitor of AKT and that of PI3K establish respectively 5 and 7 hydrogen bonds with mTOR, compared to AZ8055 and XL388, which have only 3 and 4 connections, respectively. The significant affinity score of some inhibitors despite the low number of hydrogen bonds can be explained by the hydrophobic interactions and that of van der Waals. Thus, the affinity and interaction of XL388 and most of the inhibitors studied are more efficient than those of AZ8055, a potent, selective and oral mTOR kinase inhibitor, which inhibits the proliferation of tumor cells in vitro and in vivo [20], but induces apoptosis [21].
A double comparison of the inhibitors studied with respect to XL388, in consideration of the affinity and the number of mTOR-mediated hydrogen bonds, predicts that 3 AKT inhibitors (Table 3) and 10 PI3K inhibitors (Table 4) have better results than XL388.
Table 3
Comparison of AKT inhibitors studied to XL388
Table 4
Comparison of PI3Kinhibitors studied to XL388
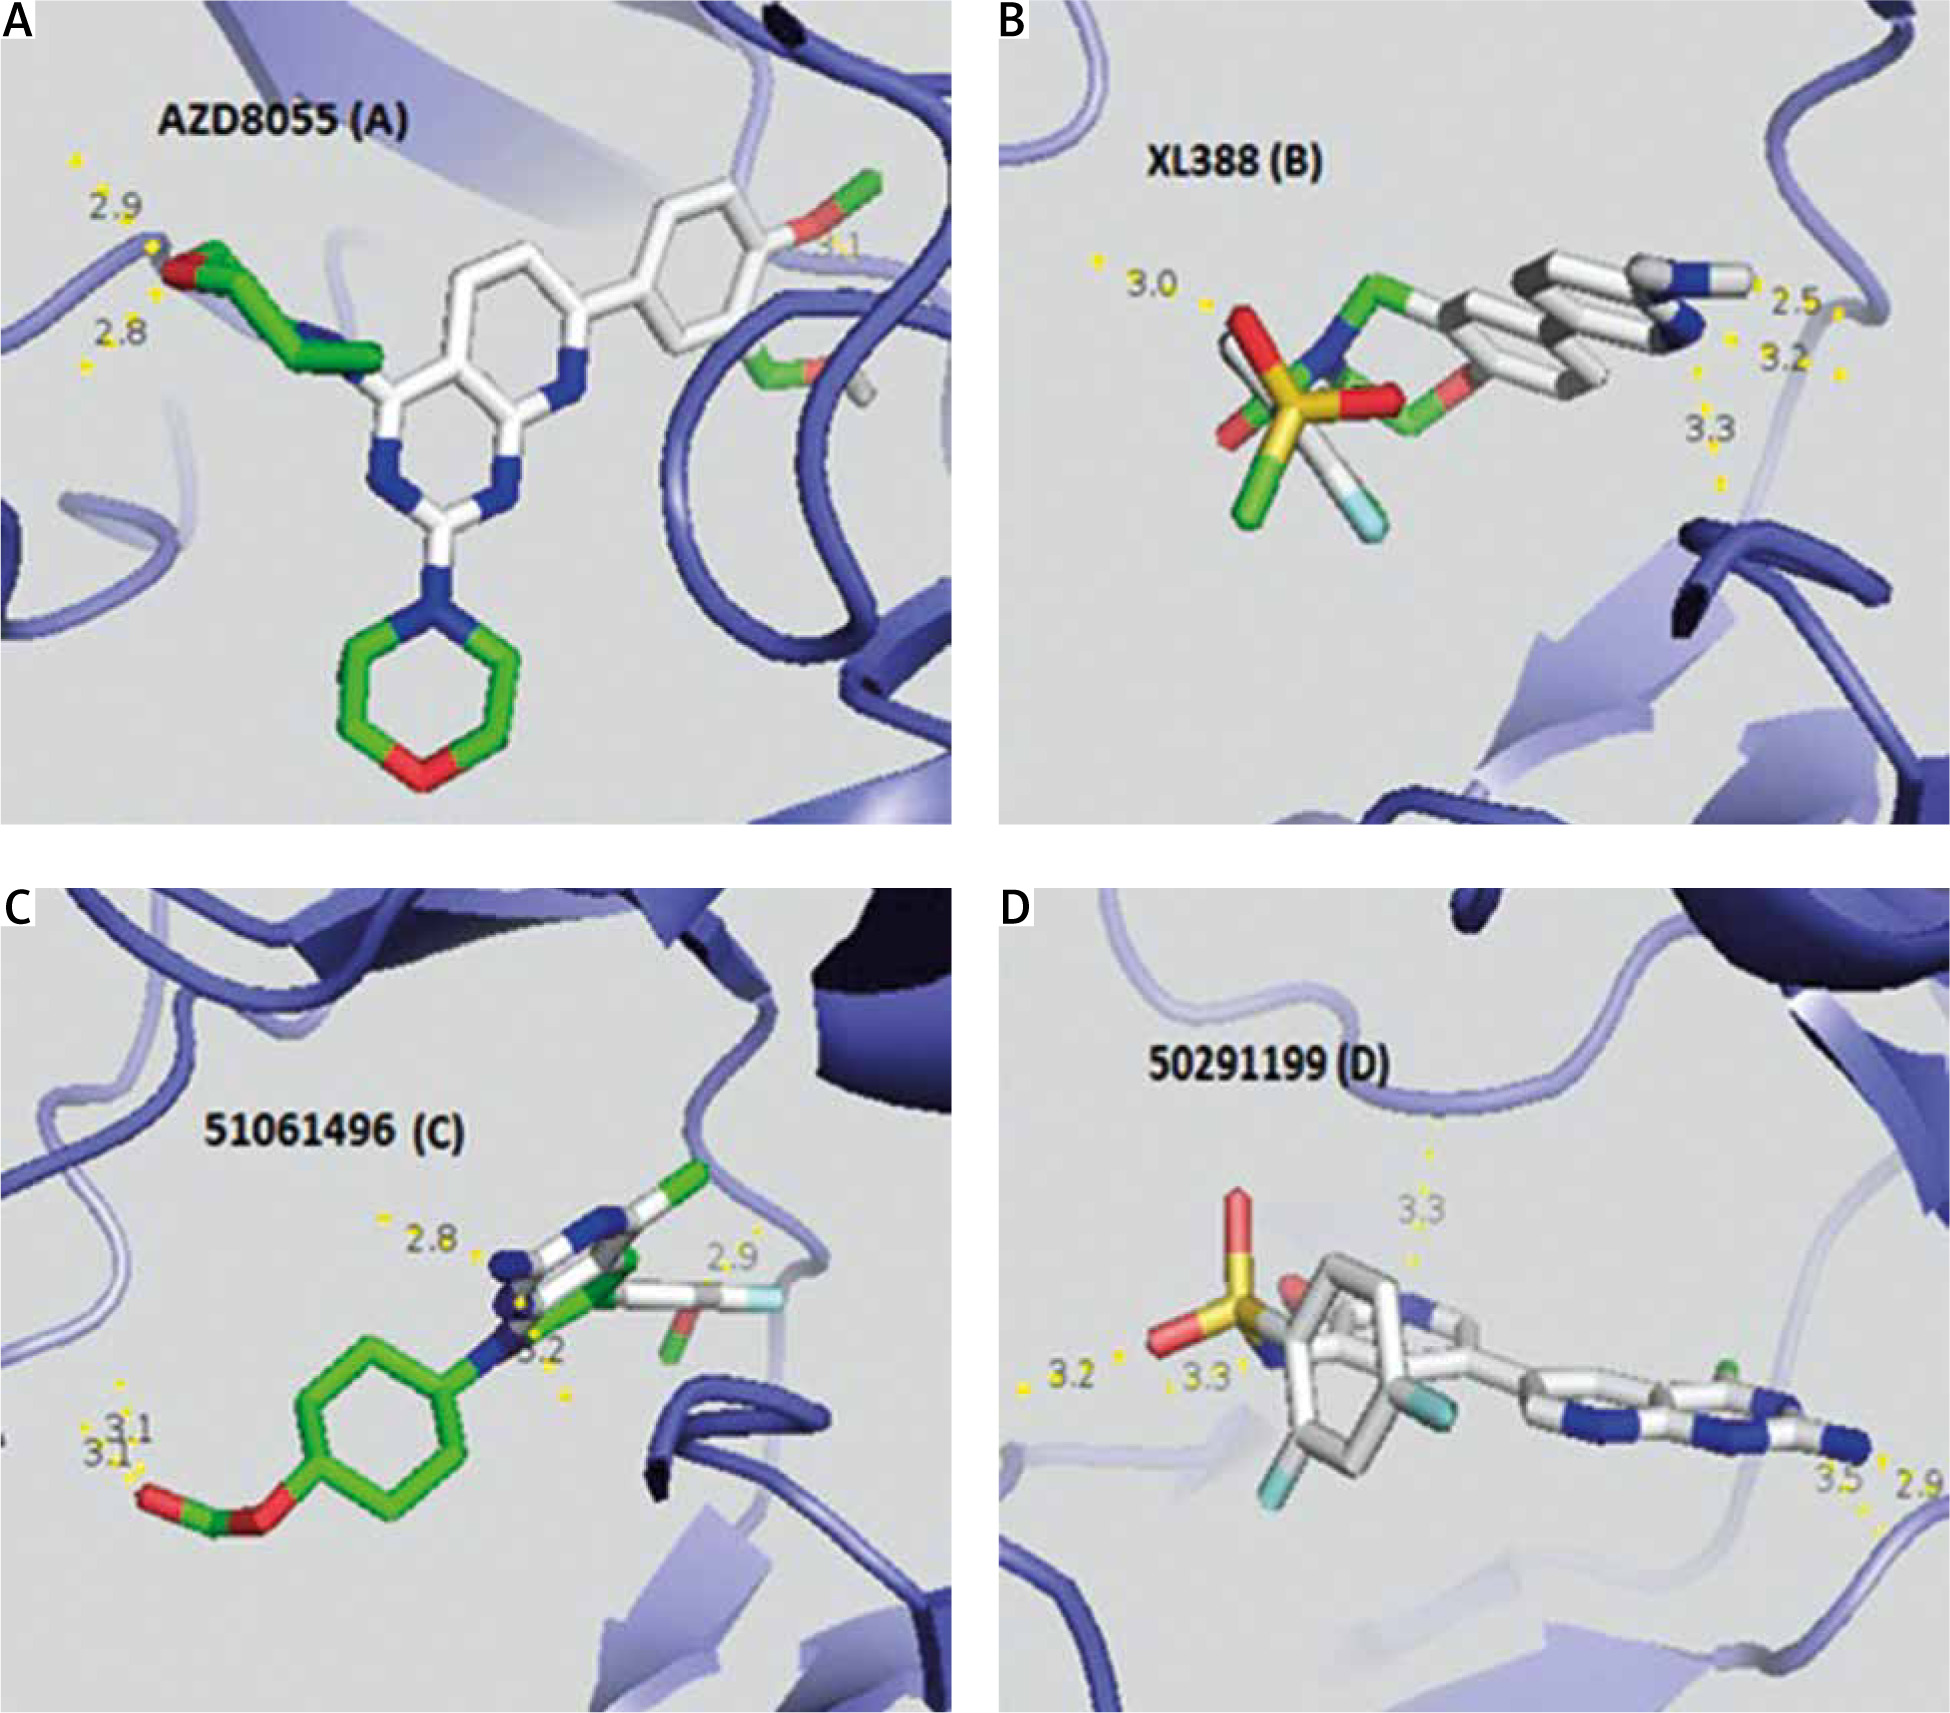
Taking into account the modified Lipinski rules (no more than 5 hydrogen bond donors, no more than 10 hydrogen bond acceptors, an octanol-water partition coefficient log P not greater than 5.5) and the Veber rule determining good bioavailability (polar surface area ≤ 140 Å (absolute polarity measurement), rotatable bonds ≤ 10 (flexibility measurement)), we found that 2 AKT inhibitors (Table 5), of which 51061496 is the most relevant (5 hydrogen bonds and an affinity of –9.7 kcal/mol), and 9 PI3K inhibitors (Table 6), with 50291199 being the most relevant (5 hydrogen bonds and an affinity of –9.4 kcal/mol), met all the criteria and could be future drugs (Fig. 2). XL388 inhibits the survival and proliferation of certain cell lines and blocks activation of the mTORC1 and mTORC2 complex [22].
Table 5
AKT inhibitors meeting Lipinski and Veber criteria
Table 6
PI3K inhibitors meeting Lipinski and Veber criteria
Fig. 2
Visualization of the different interactions between the compounds and the active site of mTOR via the hydrogen bonds. AZD8055 (A) and XL388 (B) respectively have 3 and 4 linkages with the catalytic site of mTOR whereas 51061496 inhibitor of AKT (C) and 50291199 inhibitor of PI3K (D) both have 5 hydrogen bonds
Red zones – oxygen atom, blue zones – nitrogen atom, green zones – other. Hydrogen bonds are represented by a dashed yellow line. Numbers represent the size of the hydrogen bonds established between the ligand and the receptor.
Conclusions
The hyperactivation of the PI3K/AKT/mTOR pathway in cancer, in association with the crucial role of mTOR signaling in tumorigenesis, has led to considerable efforts to generate inhibitors to target this pathway. Using a QSAR model, we were able to predict the activity of the powerful AKT and PI3K inhibitors towards mTOR, select the best ones and analyze their interaction with mTOR by docking while comparing them to a reference mTOR inhibitor. Promising results were obtained, and the dual inhibitors AKT/mTOR and PI3K/mTOR were predicted, pending the testing of these compounds directly on cancer cell lines in our next study.