Introduction
Atmospheric air pollution is one of the most significant problems affecting human health and quality of life. This problem occurs in both large urban areas and small towns. Pollutants emitted at low altitudes by various sources, such as municipal boilers, domestic coal-fired furnaces, and road transportation are particularly harmful. Due to the low altitude (up to 40 m) of harmful substances in polluted air, they pose a direct threat to humans through inhalation. They are a leading cause of respiratory and circulatory system diseases. Poland, in terms of particulate matter PM10 concentration, is the third most polluted country in Europe (after Bulgaria and Cyprus). Environmental pollution, including atmospheric air pollution, caused 940,000 deaths in children worldwide in 2020, two-thirds of whom were under the age of 5. The majority of these deaths, as many as 543,000, were caused by respiratory infections [1].
Nine out of 10 people worldwide breathe polluted air, which causes approximately 7 million deaths annually. Over 90% of children worldwide breathe polluted air. Over 300 million live in areas with pollution levels six times higher than the norm. Nearly 1.8 million of them die from smog, including 1 in 10 children under the age of 5 [2].
Air pollution is an often overlooked health threat to children worldwide. They are exposed to various substances not only outdoors but also within their homes and enclosed public spaces. The risk associated with breathing polluted air in a household can be as great as that associated with being outdoors. Children are significantly more likely to develop illnesses due to this condition than adults and this can result in a reduced quality of life in adulthood. Factors contributing to disease susceptibility include an underdeveloped respiratory system and a higher respiratory rate. Younger children ingest higher doses of pollutants during breathing and air exchange. At the same time, children’s underdeveloped immune systems contribute to greater susceptibility to the negative health effects of pollutants. It has been found that children born to women exposed to air pollution during pregnancy have a lower birth weight – on average by 9 g for every 10 μg/m3 increase in PM10 concentration [3, 4].
The response to breathing polluted air is assessed in both short- and long-term exposure. Short-term exposure, i.e., exposure from several hours to several days, causes an acute response, with consequences including adverse effects on lung function, especially in individuals belonging to groups sensitive to air pollution; exacerbation of symptoms of existing diseases, primarily circulatory and respiratory ones; and premature deaths, particularly those related to respiratory and cardiovascular diseases. The occurrence of health problems is associated with an increased number of doctor visits and hospitalizations due to respiratory and circulatory system diseases, increased medication consumption, and an increase in the number of days absent from school and work [5–8].
Long-term exposure to air pollution, which can last from several months to even years, is closely linked to the incidence of conditions such as asthma, food and skin allergies, chronic obstructive pulmonary disease, lung cancer, and cardiovascular disease, and thus increased mortality from cardiovascular and respiratory diseases. Furthermore, long-term exposure to certain chemicals typically causes chronic changes in the physiological functions of other organs. Women exposed to long-term air pollution experience fetal developmental disorders during pregnancy, including intrauterine abnormalities, low birth weight at term, and inadequate fetal growth [9–13].
The problem of air pollution is closely linked to the circular economy (CE), which aims to reduce air pollution by minimizing waste, reducing raw material consumption, and promoting more sustainable production processes. Circular economy achieves this by reusing and recycling products, designing more efficient and repairable goods, and using sustainable materials and packaging, which reduces the amount of waste going to landfills and incinerators [14–19].
The main source of sulfur dioxide emissions is the combustion of fuels (primarily coal) in stationary sources, which together account for 95% of national emissions. 45% of these emissions come from fuel combustion, primarily in households, and approximately 38% from electricity and heat production in utility and industrial power plants and combined heat and power plants, as well as heating plants, refineries, and solid fuel production. 12% of these gas emissions come from fuel combustion in industry (primarily manufacturing and construction). SO2 emissions are systematically decreasing, primarily due to the gradual decline in the share of hard coal and lignite in fuels used for heat and electricity production, as well as a reduction in emissions from the power industry, which resulted from operators’ compliance with the requirements of Directive 2010/75/EU on industrial emissions (IED) regarding stricter emission standards for SO2, NOx, and total dust, as since January 1, 2016. In 2023, estimated emissions of this pollutant were almost 13% lower compared to 2022. This decrease is due to reduced fuel consumption, particularly solid fuels, in households and the energy industry.
Transportation is the largest source of nitrogen oxide emissions in Poland – 32% of national NOx emissions (of which road transportation is responsible for the majority), households account for approximately 22%, and the energy industry for 19%. As with sulfur dioxide, nitrogen oxide emissions are also declining significantly. These changes were initiated by the collapse of heavy industry in the late 1980s and early 1990s. Since the late 1990s, the largest source of nitrogen oxide emissions has been fuel combustion in road transport, from which emissions systematically increased until 2017. This was mainly caused by an increase in the number of vehicles by approximately 183% since 1990 and the associated increase in transportation performance and fuel consumption (including petrol, diesel and LPG).
The decline in NOx emissions since 2017 is due to the increasing share of vehicles meeting the latest emission standards in the vehicle fleet and a reduction in emissions of this pollutant from the commercial power industry. Total nitrogen oxide emissions in 2023 decreased by over 5% compared to 2022. This was primarily due to a reduction in NOx emissions from the energy and road transportation sectors. In 2023, emissions from the transportation sector decreased compared to 2022 due to the renewal of the vehicle age structure (an increasing share of vehicles meeting the latest emission standards and a decreasing number of vehicles meeting lower environmental requirements), as well as the increasing share of hybrid and electric vehicles. The decline in emissions from the energy industry was due to a decrease in fuel consumption (primarily hard coal and lignite) for energy and heat production.
The main source of PM2.5 fine particulate matter emissions is fuel combustion, which accounts for approximately 90% of the total emissions of this pollutant. The largest share of emissions (approximately 85%) is primarily related to the combustion of hard coal and biomass in households. Emissions of this pollutant have been declining for several years. In 2023, a 10% decrease was recorded compared to the previous year. PM2.5 is a pollutant covered by the emission limits specified in the NEC Directive. According to this directive, by 2020, Poland should have reduced PM2.5 emissions by 16% compared to 2005. In 2020, the reduction compared to 2005 was 5.5%, in 2021 8.4%, in 2022 19.5%, and in 2023 27.7%. Poland only failed to meet the PM2.5 emission reduction target set by the National Emission Ceiling (NEC) Directive in 2020-2021, but the emission trend is downward, and the limit was met in 2022 and 2023.
The main source of PM10 emissions in Poland, as for total particulate matter, are stationary combustion processes, the majority of which (approximately 70%) comes from household fuel combustion. Agriculture (12%) and industrial processes (9%) are the next largest contributors to PM10 emissions. PM10 emissions in 2023 decreased by 9% compared to the previous year.
The main source of total particulate matter (TSP) emissions in Poland are stationary combustion processes, which account for the majority of domestic emissions, with approximately 60% coming from fuel combustion. Industrial processes account for 21% of total emissions, with the largest share coming from mineral production (mining of minerals other than coal, cement, lime, glass, etc.). Compared to 2022, TSP emissions in 2023 decreased by 8% (as a result of changes in activity in individual sectors, particularly lower fuel consumption in the energy sector and road transportation, as well as a decrease in mineral extraction). The main source of black carbon emissions in Poland is fuel combustion in the household sector, which accounts for 63% of total black carbon emissions. The second largest source of black carbon emissions is transportation, with a 24% share (emissions mainly from road transportation). Emissions of this pollutant in 2023 decreased by 7% compared to the previous year. The decrease in black carbon (BC) emissions compared to 2022 was mainly due to lower biomass consumption, especially in households.
The majority of polycyclic aromatic hydrocarbon (PAH) emissions (nearly 93%) come from fuel combustion in households (89%). These pollutants include benzo(a)pyrene, benzo(b)fluoranthene, benzo(k)fluoranthene, and indeno(1,2,3cd)pyrene. PAH emissions in 2023 have decreased by 40% since 1990, and by 8% compared to the emission level in 2022. The largest contributor to the change in national PAH emissions in 2023 was the decrease in PAH emissions from the household sector, which is related to the reduced consumption of wood biomass and the introduction of modern heating devices designed for its combustion [20–22].
Material and methods
In October 2025, data on the incidence of bronchial asthma (J-45), allergic contact dermatitis caused by substances introduced into the body (L 27), and allergic gastroenteritis and colitis (K 52.2) among children and adolescents in Poland aged 0 to 18 years were obtained from the Health Department of the Silesian Voivodeship Office in Katowice. Data also came from the National Center for Emission Balancing and Management in Warsaw (KOBIZE) regarding emissions of sulfur dioxide, nitrogen oxides, PM2.5 and PM10 particulate matter, PAHs, and total particulate matter (TSP). Data on average annual concentrations of selected air pollutants (sulfur dioxide, nitrogen dioxide, benzo[a]pyrene, PM2.5 particulate matter, and PM10 particulate matter) were obtained from the Chief Inspectorate for Environmental Protection in Warsaw. All of the above data cover all of Poland for the period from 2018 to 2024. Classic Pearson correlation and Spearman’s rank correlation coefficient were used to correlate average annual concentrations of selected air pollutants and pollutant emissions with the incidence of allergic diseases.
Results
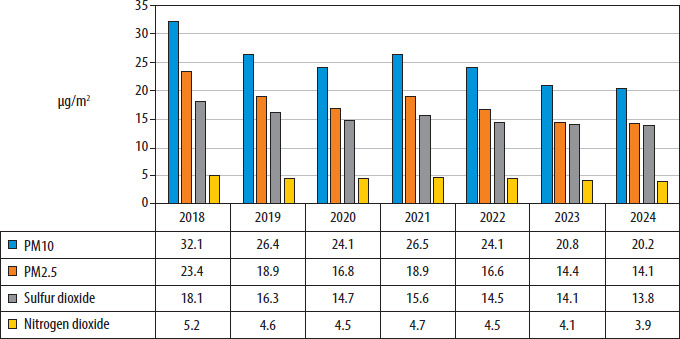
During the analyzed period from 2018 to 2024, there was a decrease in average annual concentrations of selected air pollutants in Poland (except for 2021, where they increased compared to 2020). In the case of PM10 particulate matter, these concentrations reduced from 32.1 μg/m3 in 2018 to 20.2 μg/m3 in 2024. The average annual concentration of PM2.5 particulate matter was 23.4 μg/m3 in 2018 and 14.1 μg/m3 in 2024. With regard to sulfur dioxide, these concentrations were 18.1 μg/m3 in 2018 and 13.8 μg/m3 in 2024. The average annual concentration of nitrogen dioxide was 5.2 μg/m3 in 2018 and 3.9 μg/m3 in 2024 (Figure 1).
FIGURE 1
Average annual concentrations of PM10 and PM2.5 particulate matter, nitrogen dioxide, and sulfur dioxide in Poland from 2018 to 2024. Source: authors’ own study based on data from the Chief Inspectorate for Environmental Protection (GIOŚ)
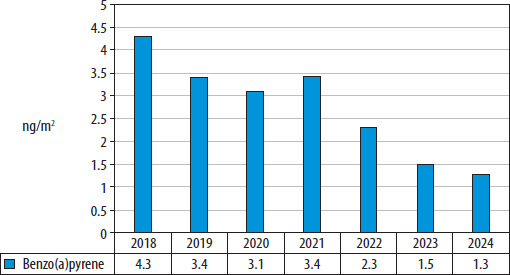
Also, in the analyzed period from 2018 to 2024, the average annual concentrations of benzo(a)pyrene in Poland decreased (except for 2021, when it increased compared to 2020), reaching 4.3 ng/m3 in 2018 and 1.3 ng/m3 in 2024 (Figure 2).
FIGURE 2
Average annual concentrations of benzo(a)pyrene in Poland in 2018-2024. Source: authors’ own study based on data from the Chief Inspectorate for Environmental Protection (GIOŚ)
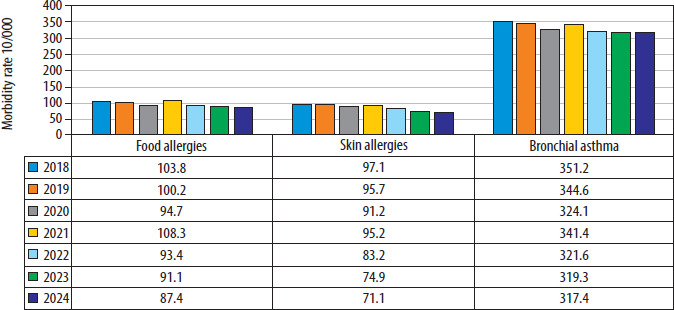
The analysis of new cases (incidence) of bronchial asthma in the population of 10,000 children and adolescents in the studied age group in Poland for the period from 2018 to 2024 shows a downward trend and amounted to 351.2/10,000 in 2018 and 317.4/10,000 in 2024. The increase in the number of cases occurred in 2021, when this rate amounted to 341.4/10,000. The incidence of food and skin allergies is decreasing (except for 2021, when there was an increase in the incidence to 108.3/10,000 for food allergies and 95.2/10,000 for skin allergies) and amounts to 103.8/10,.000 in 2018 and 95.2/10,000 in 2018, respectively, and 97.1/10,000 in 2018 and 87.4/10,000 and 71.1/10,000 in 2024 (Figure 3).
FIGURE 3
Incidence of selected allergic diseases among children and adolescents in Poland from 2018 to 2024. Source: authors’ own study based on data from the Health Department of the Silesian Voivodeship Office in Katowice
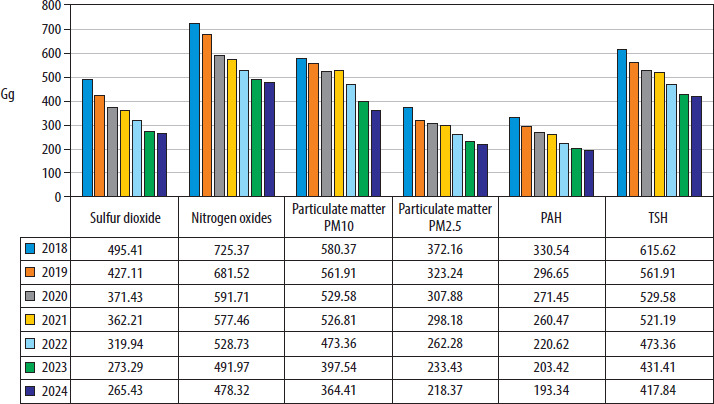
During the analyzed period from 2018 to 2024, emissions of all analyzed air pollutants decreased in Poland. Sulfur dioxide emissions decreased from 495.41 Gg (1000 tons) in 2018 to 265.43 Gg in 2024. In 2018, nitrogen oxide emissions reached 725.37 Gg, and in 2024, they decreased to 478.32 Gg. For PM10 and PM2.5 particulate matter, the emission was 580.37 Gg and 372.16 Gg in 2018 and 364.41 Gg and 218.37 Gg in 2024, respectively. PAH emission in 2018 was 330.54 Gg and 193.34 Gg in 2024. For TSP, this value was 615.62 Gg in 2018 and 417.84 Gg in 2024 (Figure 4).
FIGURE 4
Total air pollutant emissions in Poland in 2018–2024. Source: authors’ own study based on data from the KOBIZE
To assess the relationship between the emission levels of selected pollutants and the incidence of allergic diseases in Poland, a correlation analysis was conducted covering the years 2018–2024. Data on morbidity were compared with annual emission values and average annual concentrations of major air pollutants. Although the basic assumptions enabling the use of classical Pearson correlation (including normality of distribution) were met for some variables, the small sample size (n = 7) limits the reliable use of parametric methods. Therefore, the Spearman’s rank correlation coefficient was used, which is more stable over short time series (Table 1).
TABLE 1
Relationship between the emission of specific pollutants and the incidence of food allergies. Source: authors’ own study
| Pollution | N | R Spearman | t(N – 2) | P-value |
|---|---|---|---|---|
| SO2 | 7 | 0.786 | 2.840 | 0.036 |
| NOx | 7 | 0.786 | 2.840 | 0.036 |
| PM10 | 7 | 0.714 | 2.282 | 0.071 |
| PM2.5 | 7 | 0.786 | 2.840 | 0.036 |
| PAH | 7 | 0.786 | 2.840 | 0.036 |
| TSP | 7 | 0.786 | 2.840 | 0.036 |
For sulfur dioxide, nitrogen oxides, PM2.5, PAHs, and TSP, positive correlation coefficients of similar magnitude (R = 0.786) were obtained, and they were statistically significant (p = 0.036), indicating a strong and positive relationship between the analyzed quantities. For PM10, the coefficient was also moderately positive (R = 0.714), but statistically non-significant (p = 0.071). During the analyzed period, changes in emissions of most pollutants were in the same direction as changes in the incidence of food allergies. Higher emissions were accompanied by higher disease incidence rates, while decreases in emissions were accompanied by decreases in disease incidence. These relationships were positive and unidirectional, as reflected by the high values of the correlation coefficients (Table 2).
TABLE 2
Relationship between emissions of individual pollutants and the incidence of skin allergies. Source: authors’ own study
| Pollution | N | R Spearman | t(N – 2) | P-value |
|---|---|---|---|---|
| SO2 | 7 | 0.964 | 8.141 | < 0.001 |
| NOx | 7 | 0.964 | 8.141 | < 0.001 |
| PM10 | 7 | 0.750 | 2.535 | 0.052 |
| PM2.5 | 7 | 0.964 | 8.141 | < 0.001 |
| PAH | 7 | 0.964 | 8.141 | < 0.001 |
| TSP | 7 | 0.964 | 8.141 | < 0.001 |
For sulfur dioxide, nitrogen oxides, PM2.5, PAHs, and TSP, very high positive correlation coefficients (R = 0.964) were obtained, and they were statistically significant (p < 0.001). These indicate a strong and stable monotonic relationship between the analyzed variables. For PM10, the correlation coefficient was positive and moderate (R = 0.750), but did not reach statistical significance (p = 0.052). As with food allergies, the direction of covariation remained consistent. Increases in emissions of most pollutants were associated with a significant increase in the incidence of skin allergies. Very high coefficient values suggest a strong, unidirectional relationship, but interpretation should be made with caution due to limited data (Table 3).
TABLE 3
Relationship between emissions of individual pollutants and asthma incidence. Source: authors’ own study
| Pollution | N | R Spearman | t(N – 2) | P-value |
|---|---|---|---|---|
| SO2 | 7 | 0.964 | 8.141 | < 0.001 |
| NOx | 7 | 0.964 | 8.141 | < 0.001 |
| PM10 | 7 | 0.750 | 2.535 | 0.052 |
| PM2.5 | 7 | 0.964 | 8.141 | < 0.001 |
| PAH | 7 | 0.964 | 8.141 | < 0.001 |
| TSP | 7 | 0.964 | 8.141 | < 0.001 |
For sulfur dioxide, nitrogen oxides, PM2.5, PAHs, and TSP, very high positive correlation coefficients (R = 0.964) were obtained, and they were statistically significant (p < 0.001). The results indicate a strong relationship between the analyzed variables. As with allergies, the correlation coefficient for PM10 was R = 0.750, which was positive and moderate, but did not reach statistical significance (p = 0.052). Changes in emissions of most pollutants were in the same direction as changes in the incidence of bronchial asthma. Both increases and decreases in emissions were accompanied by similar changes in the incidence rate, as confirmed by the high values of correlation coefficients. These results confirm the consistent, unidirectional nature of the covariation between emission levels and asthma incidence, reflected in the high values of correlation coefficients. However, the interpretation of these relationships should take into account the limitations resulting from the small number of observations (Table 4).
TABLE 4
Relationship between the concentration of individual pollutants and the incidence of food allergies. Source: authors’ own study
| Pollution | N | R Spearman | t(N – 2) | P-value |
|---|---|---|---|---|
| PM10 | 7 | 0.955 | 7.199 | 0.001 |
| PM2.5 | 7 | 0.937 | 5.996 | 0.002 |
| SO2 | 7 | 0.786 | 2.840 | 0.036 |
| NO2 | 7 | 0.955 | 7.199 | 0.001 |
| Benzo(a)pyrene | 7 | 0.937 | 5.996 | 0.002 |
For PM10, PM2.5, nitrogen dioxide, and benzo(a)pyrene, very high positive correlation coefficients were obtained (R = 0.937 and R = 0.955, respectively), and they were statistically significant (p = 0.001 and p = 0.002). This indicates a strong, unidirectional nature of covariation. Increases in pollutant concentrations were accompanied by higher rates of food allergies. For sulfur dioxide, the correlation coefficient was slightly lower (R = 0.786), but still positive and statistically significant (p = 0.036), confirming the same direction of correlation. Despite the small number of observations, the obtained results create a consistent picture of strong relationships between air pollutant concentrations and the incidence of food allergies (Table 5).
TABLE 5
Relationship between the concentration of individual pollutants and the incidence of skin allergies. Source: authors’ own study
| Pollution | N | R Spearman | t(N – 2) | P-value |
|---|---|---|---|---|
| PM10 | 7 | 0.955 | 7.199 | 0.001 |
| PM2.5 | 7 | 0.991 | 16.583 | < 0.001 |
| SO2 | 7 | 0.964 | 8.141 | < 0.001 |
| NO2 | 7 | 0.955 | 7.199 | 0.001 |
| Benzo(a)pyrene | 7 | 0.991 | 16.583 | < 0.001 |
For all analyzed pollutant concentrations, very high positive correlation coefficients were obtained, and there were all statistically significant (p ≤ 0.001). This indicates a unidirectional, strong covariation pattern. Increases in average annual concentrations were accompanied by significant increases in the incidence rate, while decreases in concentrations were accompanied by decreases in the number of cases. Due to the very high coefficient values and their consistency, these relationships can be considered clear, although interpretation must take into account the limited sample size (Table 6).
TABLE 6
Relationship between the concentration of individual pollutants and the incidence of asthma. Source: authors’ own study
| Pollution | N | R Spearman | t(N – 2) | P-value |
|---|---|---|---|---|
| PM10 | 7 | 0.955 | 7.199 | 0.001 |
| PM2.5 | 7 | 0.991 | 16.583 | < 0.001 |
| SO2 | 7 | 0.964 | 8.141 | < 0.001 |
| NO2 | 7 | 0.955 | 7.199 | 0.001 |
| Benzo(a)pyrene | 7 | 0.991 | 16.583 | < 0.001 |
Very high, statistically significant positive correlation coefficients were obtained for all pollutants (p ≤ 0.001). Increases in air pollutant concentrations were associated with a significant increase in the incidence of asthma, while decreases in concentrations were accompanied by lower disease indicator values. The obtained correlations, although based on a short data series, indicate a consistent and stable direction of the relationship (Table 6).
Conclusions and discussion
The analysis of average annual air concentrations showed that air quality has been improving since 2018. Furthermore, there has also been a significant decrease in overall air pollutant emissions. Along with the decrease in both pollutant emissions and average annual air pollutant concentrations, a decrease in the incidence of allergic diseases among children and adolescents in Poland was also noted. Reports from the Chief Inspectorate for Environmental Protection (GIOŚ) indicate an improvement in air quality in Poland between 2018 and 2023, especially in the case of PM10 particulate matter, although the problem of exceedances of benzo(a)pyrene and PM2.5 particulate matter remains, with low-level emissions from municipal and residential sectors (home heating) being the main causes. Currently, the entire territory of Poland has been classified as class A, meaning areas with pollution levels remaining below the highest threshold, including for substances such as sulfur dioxide, carbon monoxide, benzene, and lead, cadmium, and nickel in PM10 particulate matter [23].
Ambient air pollution is associated with the occurrence and exacerbation of allergic diseases. Whether air quality improves due to reduced emissions of specific air pollutants (PM2.5 and PM10, benzo(a)pyrene, nitrogen dioxide, sulfur dioxide, and heavy metals contained in particulate matter) influences overall health outcomes, such as asthma, food allergies, and skin allergies [24–26].
Epidemiological studies demonstrate significant links between air pollutant emissions from industrial plants and emerging cases of asthma and other allergic diseases in children. Recent data from the Dutch Prevention and Incidence of Asthma and Allergies (PIAMA) birth cohort linked the occurrence of asthma up to the age of 17 with concentrations of NOx, SO2, PM2.5, PM10, and benzo(a)pyrene at children’s places of residence and school. They showed that exposure to air pollution over an 8-year period, especially early in life, can have long-term consequences for the development of asthma and other allergic diseases. Improved air quality also reduced the incidence of these diseases [27]. This is confirmed by other studies conducted in Brazil, China, the Netherlands, Germany, and Australia [28–33]. Improving air quality in Poland and other regions remains a significant and multifaceted challenge. The educational challenge is the first to be addressed. Despite numerous extensive information and educational campaigns, there is still a noticeable lack of knowledge regarding the negative impact of air pollution on health. Society does not perceive this problem as a deferred cost for which, to a greater or lesser extent, we will all be financially responsible. Therefore, the problem of air pollution can be considered one of the most important problems facing our civilization. To improve air quality, decisive action should be taken to further improve it, which may include: eliminating coal-fired boilers and replacing them with environmentally friendly energy sources (e.g., by providing subsidies equal to 100% of investment costs), reducing emissions from individual home heating systems, environmental education, reducing car traffic in city centers by implementing appropriate solutions, such as building urban rail lines, constructing bus-only lanes, and deploying fast-charging stations for electric cars.