Purpose
High-dose-rate (HDR) brachytherapy is an essential treatment component for gynecological malignancies, and accurate dose calculation is fundamental to its safe and effective delivery [1, 2]. In current clinical practice, the TG-43 formalism remains the standard dose calculation approach in brachytherapy, providing a standardized dosimetric framework based on the assumption of a homogeneous water medium [3-5]. However, it does not account for tissue heterogeneities, applicator material, or patient-specific geometry, limiting its accuracy in clinically relevant treatment situations [6, 7].
Model-based dose calculation algorithms (MBDCAs) were developed to overcome these limitations [6]. TG-186 established a framework for their clinical implementation, while TG-372 further addressed commissioning aspects [6, 7]. Previous studies have generally shown that TG-43 tends to overestimate dose relative to model-based approaches in gynecological brachytherapy, although the reported magnitude of this effect varies across studies [8-19].
Direct numerical comparison of published research remains challenging due to variations in treatment planning systems (TPSs), dose calculation algorithms, source models, applicator designs, patient cohorts, and dosimetric endpoints analyzed [8-19]. Furthermore, few reports have compared multiple gynecological applicator classes within a single methodological framework, and most published studies have focused on a single applicator type or a narrower clinical configuration [11, 18]. This issue is particularly relevant for applicator setups, where source loading and dose shaping differ across clinical configurations.
While tandem and ring (T&R), tandem and ovoid (T&O), and segmented cylinder (SC) applicators have been compared in previous studies [8-16], data on multi-channel cylinder configurations remain limited. A recent study included multi-channel cylinder applicators in both phantom and clinical analyses; however, specific clinical comparisons are rare, especially for universal multi-channel cylinder (UMC), which was evaluated as a sub-group within a broader framework [18].
The present study therefore addressed this gap by systematically evaluating how TG-43-to-Acuros® BV differences vary across clinically used gynecological applicator geometries within a single-institution planning and recalculation framework. This is relevant because applicator material, source loading, dwell time distribution, and local patient heterogeneity may interact differently across applicator classes, making a single average TG-43-to-MBDCA conversion factor inappropriate.
This study aimed to compare TG-43 and Acuros® BV dosimetry across four gynecological HDR brachytherapy applicator types, focusing on target and organ-at-risk (OAR) dose metrics and on physical factors that may explain the non-uniform magnitude of algorithm-related differences. Hence, the study was designed as an applicator-dependent dosimetric analysis, while clinical significance of these differences in cumulative external beam radiotherapy plus brachytherapy (EBRT + BT) equivalent dose in 2 Gy fractions (EQD2) reporting was considered outside the primary scope of the present work.
Material and methods
A retrospective dosimetric analysis included 40 patients and 121 HDR brachytherapy treatment plans for gynecological cancers. Most patients had cervical cancer (25 patients, C53/C53.9), followed by corpus uteri malignancies (8 patients, C54.1/C54.3/C54.9), vaginal cancer (5 patients, C52), vulvar cancer (1 patient, C51.9), and one other gynecological cancer. Patients were grouped by applicator type: tandem and ring (T&R; 10 patients, 34 plans), tandem and ovoid (T&O; 12 patients, 38 plans), segmented cylinder (SC; 10 patients, 23 plans), and universal multi-channel cylinder (UMC; 8 patients, 26 plans). Corresponding Varian applicator systems were ring and tandem titanium applicator (AL13017000), Fletcher-Suit Delclos-style tandem and ovoid titanium applicator (AL13030000), segmented cylinder (GM11004150), and universal multi-channel cylinder set (GM11011400) used with universal titanium cervix probe set (GM11013100, GM11013200). Computed tomography (CT) imaging was performed with a slice thickness of 2.5 mm.
All treatment plans were created in BrachyVision™ version 15.6 using the TG-43 formalism [3-5]. Applicator reconstruction was performed manually using models from the Varian solid applicator library. For algorithm comparison, each plan was duplicated and recalculated with Acuros® BV using identical dwell positions and dwell times. Acuros® BV dose was reported as dose to medium in medium (Dm,m), whereas TG-43 represented a water-based reference formalism based on the assumption of a homogeneous water medium. None of the evaluated plans included applicator shielding. The applicators contain clinically relevant non-water-equivalent materials, such as titanium, stainless steel, polyether ether ketone (PEEK), and polyphenylsulfone (PPSU), which affect attenuation and scatter, and are therefore relevant in model-based dose calculation [6, 7].
Acuros® BV was clinically commissioned according to TG-186 and TG-372 recommendations and vendor guidance [6, 7, 20, 21]. For the main comparison of TG-43 vs. Acuros® BV, re-calculations used CT-based density information and an image-based maximum mass density cap of 8.0 g/cm3. According to the BrachyVision workflow documentation, image-based density cap affects CT-derived voxels and artifact-related high density values, whereas solid applicator component materials are mapped separately onto the Acuros® BV computational grid [20, 21]. Therefore, changing the image-based cap does not re-define the intrinsic material composition of the applicator model. No dedicated metal-artifact reduction workflow, manual Hounsfield unit (HU) override, or manual material assignment was applied, while re-calculations reflected the original planning CT datasets and routine applicator reconstructions.
A supplementary density-cap quality assurance (QA) audit was performed using matched Acuros® BV recalculations at 2.25, 4.5, and 8.0 g/cm3, representing the lower/default image-based cap setting, a titanium-like intermediate setting, and the highest available image-based cap setting, respectively. Signed pairwise cap-to-cap differences (2.25-8.0, 4.5-8.0, and 2.25-4.5 g/cm3) were summarized for high-risk clinical target volume (HR-CTV) D90/D98 and pooled OAR D0.1cc, D1cc, and D2cc endpoints. The largest individual absolute cap-to-cap difference was retained only as a conservative QA indicator. This audit served as a sensitivity check of image-based cap selection, not as a separate clinical endpoint analysis.
All analyzed BT plans used a prescription of 7 Gy per fraction, consistent with the institutional gynecological HDR brachytherapy protocol. The total analyzed BT prescription per patient was therefore determined by the number of analyzed BT applications in the clinical course. Planning aimed to achieve adequate HR-CTV coverage while keeping OAR doses as low as reasonably achievable and within institutional constraints as per ICRU 89 and EMBRACE II planning aims and limits [1, 2].
The primary dosimetric evaluation focused on HR-CTV D90, D98, and V100, along with OAR D2cc values for the bladder, rectum, sigmoid colon, and small bowel. For T&R and T&O applicators, Point A dose was also evaluated, while for the SC group, the position of the 100% prescription isodose was assessed relative to the nominal 5 mm prescription depth. For the SC group, the target-related structure used for DVH analysis corresponded to the 5-mm prescription-depth surrogate used in the cylinder workflow; therefore, the reported SC target DVH parameters refer to this surrogate structure. Additional HR-CTV parameters (D50, D95, D100, V150, and V200) and OAR high-dose metrics (D0.1cc and D1cc) were also analyzed and are included in Supplementary Material.
For target endpoints, Dx denoted the minimum dose received by x% of the target volume, whereas Vx was the percentage target volume receiving at least x% of the prescription dose. For OAR endpoints, D0.1cc, D1cc, and D2cc denoted the minimum dose to the most exposed 0.1 cm3, 1 cm3, and 2 cm3, respectively.
The relative difference (RD) for each paired dosimetric parameter was calculated as:
where XTG-43 and XAcuros® BV represent the values obtained with TG-43 and Acuros® BV, respectively. Positive RD values indicated higher dose estimates with TG-43 relative to Acuros® BV. Dose-volume histogram (DVH) data were exported and processed using a Python-based script designed for structured paired comparison of TG-43 and Acuros® BV plan metrics. D90, D98, and V100 were the primary target coverage endpoints. An additional DVH-shape analysis was performed within a 90-110% prescription-dose interval to provide a standardized summary of curve separation around these coverage endpoints. The area between paired HR-CTV cumulative DVH curves and the maximum absolute local volume difference were calculated as complementary descriptors, not as replacements for standard DVH endpoints. These descriptors were included to assess whether differences in individual DVH endpoints were accompanied by broader separation of the paired target DVH curves across the prescription region.
A supplementary exploratory dwell-loading audit was conducted to support the physical interpretation of applicator-dependent differences and to illustrate inter-applicator variation in loading patterns. For each matched plan, active channel count, active dwell-position count, total dwell time, dominant-channel dwell-time fraction, dwell-time concentration metrics, and active dwell-position span were extracted from the exported dwell-time data. These descriptors were summarized across all applicator groups and correlated with selected TG-43-to-Acuros® BV differences. UMC-related associations were additionally highlighted because this subgroup exhibited the largest and most variable dosimetric deviations.
Statistical analysis
Statistical analyses were performed separately for each applicator group and reported parameter. Data distributions were assessed using the Shapiro-Wilk test before paired comparisons, and results were summarized as mean ± standard deviation or as median with interquartile range, as appropriate. Paired comparisons between TG-43 and Acuros® BV were conducted using the paired t-test for normally distributed data and the Wilcoxon signed-rank test for non-normally distributed data. The analysis was primarily descriptive and comparative, focusing on the magnitude and direction of algorithm-related differences across applicator groups rather than on isolated hypothesis testing.
For the exploratory dwell-loading audit, Spearman’s rank correlation was used descriptively to assess monotonic associations between loading-pattern descriptors and selected TG-43-to-Acuros® BV differences. Because several BT plans could originate from the same patient, these correlations were treated as exploratory descriptors of loading pattern behavior rather than as independent patient-level observations or as a multivariable predictive model.
Statistical and data analyses were performed using IBM SPSS Statistics v. 23.0 (IBM Corp., Armonk, NY, USA), OriginPro v. 9.0 (OriginLab Corporation, Northampton, MA, USA), and Python v. 3.13 (Python Software Foundation, Wilmington, DE, USA).
Results
HR-CTV dose differences
TG-43 consistently produced higher HR-CTV dose estimates than Acuros® BV across all applicator groups. The most pronounced differences among applicators were observed in D90, with the smallest relative differences for T&R (2.9 ±0.5%), followed by SC (3.2 ±0.4%) and T&O (3.7 ±0.8%), while UMC showed the largest differences and the broadest distribution of values (4.9 ±2.2%) (Figure 1A, Table 1). For D98, the overall trend remained the same, although the order between T&O and SC differed from that seen for D90. Regarding V100, relative differences were small for T&R, T&O, and SC, but larger for UMC (Figure 1B, C, Table 1).
Fig. 1
Relative differences (RD) in HR-CTV dosimetric parameters between TG-43 and Acuros® BV according to applicator type: A) D90, B) D98, and C) V100. Box plots show the distribution of relative differences for tandem and ring (T&R), tandem and ovoid (T&O), segmented cylinder (SC), and universal multi-channel cylinder (UMC). The central line indicates the median, the box the interquartile range, the whiskers the non-outlier range, and circles denote outliers. Positive values indicate higher estimates with TG-43
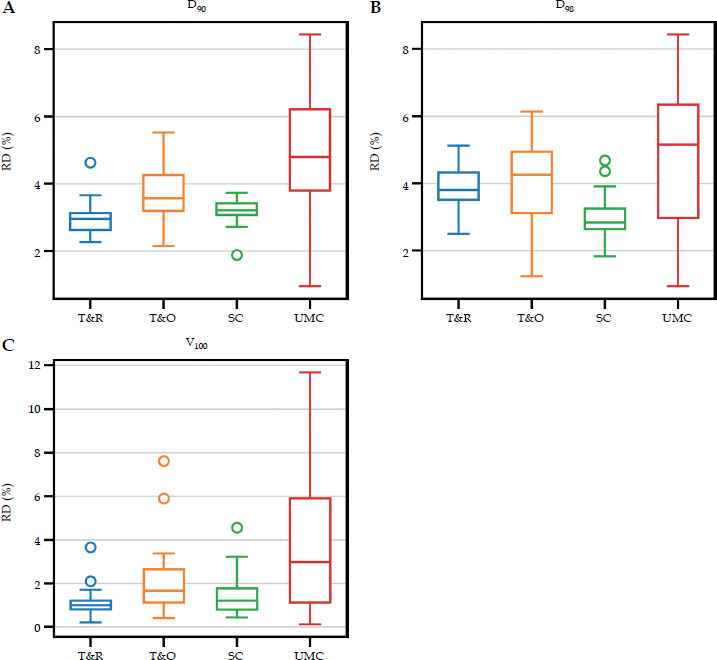
Table 1
HR-CTV dosimetric comparison between TG-43 and Acuros® BV by applicator type
[i] Values are reported as mean ± standard deviation or median (interquartile range), as appropriate; HR-CTV – high-risk clinical target volume, T&R – tandem and ring, T&O – tandem and ovoid, SC – segmented cylinder, UMC – universal multi-channel cylinder, RD – relative difference. All paired comparisons: p < 0.001.
Differences at Point A for tandem-based applicators remained minor in absolute terms. The mean absolute difference between TG-43 and Acuros® BV was 15.3 ±5.4 cGy for T&R and 19.9 ±2.8 cGy for T&O. The corresponding relative differences were 2.2 ±0.8% and 2.3 ±0.8% for the right and left Point A in T&R, and 2.9 ±0.3% and 3.2 ±0.8% in T&O, respectively.
The additional HR-CTV parameters are listed in Supplementary Table 1. These metrics revealed a consistent trend, with higher TG-43 values for D50, D95, D100, V150, and V200 across all applicator groups. The largest differences among these supplementary endpoints were observed in UMC, particularly for V150 and V200.
OAR dose differences
For OAR D2cc values, TG-43 consistently yielded higher dose estimates than Acuros® BV for the bladder, rectum, sigmoid colon, and small bowel (Figure 2, Table 2). Quantitatively, the bladder D2cc RD was 3.3 ±0.6%, 3.2 ±0.6%, 3.5 ±0.9%, and 4.3% (3.4-7.1%) for T&R, T&O, SC, and UMC, respectively. The corresponding values for T&R, T&O, SC, and UMC were 2.8 ±1.2%, 4.1 ±0.9%, 2.8 ±0.6%, and 5.2 ±2.3% for the rectum; 3.1 ±0.5%, 4.0 ±0.9%, 4.7 ±1.3%, and 5.6% (4.9-7.2%) for the sigmoid colon; and 3.1 ±1.3%, 3.4 ±0.8%, 4.3% (3.8-4.9%), and 6.1 ±2.2% for the small bowel. UMC showed the largest overall deviations, while the ranking of intermediate applicator groups varied across OARs.
Fig. 2
Relative differences (RD) in OAR D2cc values between TG-43 and Acuros® BV according to applicator type: A) bladder, B) rectum, C) sigmoid, and D) small bowel. Box plots show the distribution of relative differences for tandem and ring (T&R), tandem and ovoid (T&O), segmented cylinder (SC), and universal multi-channel cylinder (UMC). The central line indicates the median, the box the interquartile range, the whiskers the non-outlier range, and circles denote outliers. Positive values indicate higher estimates with TG-43
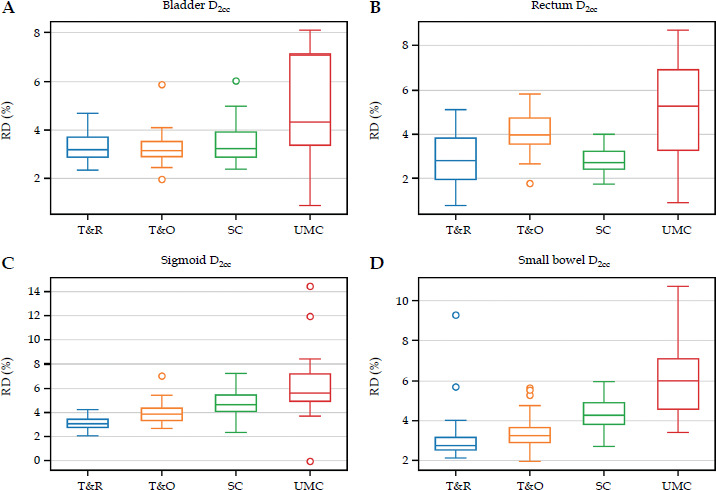
Table 2
OAR D2cc dosimetric comparison between TG-43 and Acuros® BV by applicator type
The D1cc and D0.1cc data are presented in Supplementary Table 2. These higher-dose OAR metrics showed a pattern consistent with D2cc, with the smallest differences observed for T&R and the largest for UMC.
Additional DVH-shape, prescription-isodose, and dwell-loading analyses
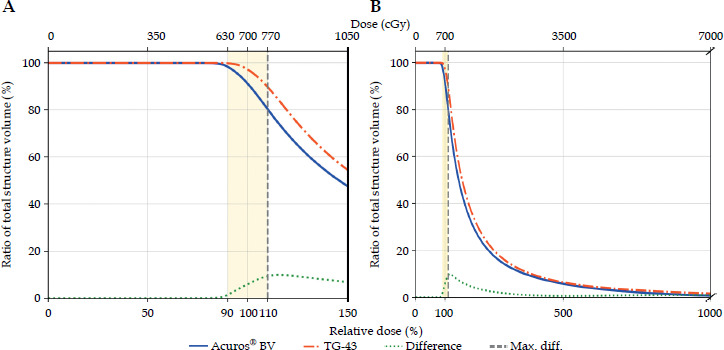
The additional DVH-shape descriptors showed that the prescription-region divergence between paired TG-43 and Acuros® BV HR-CTV cumulative curves was lowest for T&R and higher for T&O, SC, and UMC. The corresponding absolute areas between the paired curves within the 90-110% interval were 0.556 (0.496-0.747), 0.769 (0.495-1.382), 0.693 (0.572-1.143), and 0.797 (0.288-3.161) cc Gy, respectively. The maximum absolute local volume differences within the same interval were 0.489 (0.394-0.608) cc for T&R, 0.765 (0.501-1.222) cc for T&O, 0.952 (0.904-1.385) cc for SC, and 0.947 (0.372-3.025) cc for UMC. Figure 3 illustrates these complementary prescription region descriptors in a representative case.
Fig. 3
Representative example of HR-CTV cumulative DVH curve divergence between TG-43 and Acuros® BV. A) Zoomed view of the prescription region, with 90-110% interval used for additional DVH shape analysis. B) Broader view of the cumulative DVH curves, shown with an axis break, including the point of maximum local volume difference. For visualization, volumes are shown as a percentage of total structure volume; the quantitative area-between-curves and maximum local volume-difference metrics reported in the text were calculated using absolute volume (cm3)
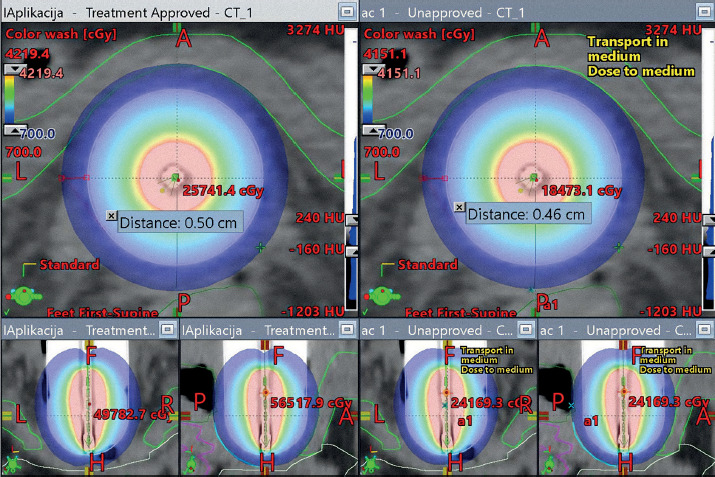
For SC, when the TG-43 100% prescription isodose was normalized to 5 mm from the applicator surface, the corresponding Acuros® BV 100% isodose position was 4.6 ± 0.1 mm, indicating an inward shift of 0.4 ±0.1 mm. The geometric illustration of this contraction is shown in Figure 4.
Fig. 4
Geometric illustration of prescription isodose contraction for the segmented cylinder (SC). When the TG-43 100% prescription isodose was normalized to 5 mm from the applicator surface, the corresponding Acuros® BV isodose was located at 4.6 ± 0.1 mm, indicating an inward shift of 0.4 ±0.1 mm
The exploratory dwell-loading audit used matched plan-level dosimetric comparisons and demonstrated clear inter-applicator differences in loading patterns (Supplementary Figure 1). UMC plans showed a broader, more heterogeneous loading profile than conventional tandem-based configurations, with greater variability in the active dwell-position span, a higher dominant-channel fraction, and a greater dwell-time coefficient of variation. The strongest and most physically specific descriptive correlations were observed in UMC, where larger target D90 and selected OAR D2cc differences were associated with longer active dwell position span and stronger dominant channel loading (Supplementary Table 3, Supplementary Figure 2). These findings support the interpretation that UMC variability reflects the combined influence of multi-channel geometry, asymmetric dwell time distribution, applicator material modeling, and heterogeneity-aware dose transport.
The density cap QA audit showed negligible cap-to-cap sensitivity relative to the TG-43-to-Acuros® BV differences. When summarized using HR-CTV target D90/D98 and pooled OAR high-dose endpoints, the signed pairwise cap-to-cap changes remained near zero for almost all evaluated endpoints (Supplementary Table 4). Across target D90/D98 endpoints, the largest individual cap-to-cap differences were 0.01 Gy for T&R, 0.12 Gy for T&O, 0.00 Gy for SC, and 0.03 Gy for UMC. For pooled OAR endpoints, the largest observed value was 0.18 Gy for T&O D0.1cc, while D2cc remained ≤ 0.07 Gy across all applicator groups. Overall, the cap-to-cap differences were much smaller than the observed TG-43-to-Acuros® BV differences.
Discussion
The present study demonstrated that TG-43 systematically yielded higher dose estimates than Acuros® BV across all evaluated applicator groups. However, the magnitude of this effect was not uniform. The smallest and most consistent deviations were observed for T&R, the largest and most variable for UMC, while T&O and SC showed intermediate patterns that varied by parameter. The main contribution of this study is therefore the systematic, applicator-dependent evaluation of TG-43-to-Acuros® BV differences within a consistent institutional workflow, rather than the general observation that TG-43 and model-based dose calculation differ.
For T&R, our findings are in good agreement with previously published tandem and ring data. Jacob et al. [13] reported reductions of about 2.1-2.2% for point A, 2.6-2.7% for target D90, and 2.1-2.7% for OAR dose when moving from TG-43 to a model-based approach. Hofbauer et al. [9] reported even smaller differences in cervix cases treated with tandem-ring applicators, with target deviations of approximately 0.1% to 0.5%, and OAR deviations of approximately 1% to 2%. Furthermore, Sinnatamby et al. [8] indicated relatively small ring-based differences, including a 1.63% reduction in HR-CTV D90 and a 0.13% difference at point A. Our T&R results therefore fall within the range of previously reported modest TG-43 overestimation.
For T&O, the magnitude of differences was generally higher than for T&R, especially for rectum and sigmoid D2cc. This is consistent with Bi et al. [11], who compared T&O, T&R, and cylinder applicators and reported the largest model-based reduction in the T&O group. Other studies have also shown variable TG-43-to-MBDCA differences in ovoid-based or more complex gynecological brachytherapy configurations [12, 15, 16]. Overall, these findings suggest that TG-43-to-Acuros® BV differences should be interpreted in relation to applicator geometry, source loading configuration, and the complete recalculation workflow, rather than being attributed solely to applicator type.
The SC findings were parameter-dependent rather than following a simple linear hierarchy between tandem-based applicators and UMC. Target differences were moderate, whereas sigmoid and small bowel D2cc differences were more pronounced than in tandem-based groups. The observed inward displacement of the Acuros® BV 100% prescription isodose provides a spatial explanation for this behavior. It is qualitatively consistent with the Monte Carlo cylinder study by Meftahi et al. [17], who showed that cylinder heterogeneity can reduce peripheral dose and cause inward contraction of isodose distributions. Although that study used a different methodology, it supports interpreting SC differences in terms of both DVH changes and spatial prescription isodose behavior.
The dwell-loading audit supports this interpretation by showing that, within the UMC group, larger relative differences were associated with longer active dwell-position spans and stronger dominant-channel weighting. These exploratory associations reinforce the physical interpretation that both multi-channel source loading complexity and asymmetric dwell time distribution contribute to the larger TG-43-to-Acuros® BV deviations observed for UMC.
The OAR findings should also be interpreted in relation to local density conditions. Abe et al. [14] observed that rectal D2cc differences became markedly larger when rectal air was explicitly modeled compared with water assignment, supporting that OAR differences depend on both applicator geometry and local density conditions near adjacent organs.
The supplementary endpoints further support this endpoint-dependent interpretation and reinforce that a single universal TG-43-to-Acuros® BV correction factor should not be assumed. From a practical perspective, the present study reflects the workflow used in this analysis: plans were generated under TG-43 and then recalculated with Acuros® BV using identical dwell positions and dwell times. Therefore, the observed differences represent the dosimetric shift revealed by model-based recalculation of clinically realistic TG-43-shaped plans rather than the effect of full re-optimization with Acuros® BV. This distinction is important. In the current clinical workflow, interactive dose shaping with tools such as Dose Shaper is performed on TG-43-based dose distributions, while equivalent interactive shaping is not directly available for Acuros® BV. Consequently, when plans are shaped under TG-43, subsequent recalculation with Acuros® BV may provide a practical way to assess whether clinically relevant DVH changes emerge, especially for more complex applicator configurations. This should not be interpreted as an argument against broader implementation of model-based planning, but rather as a reflection of the present planning environment and its current TPS implementation limitations.
Clinically, these algorithm-related differences are most relevant when target or OAR values are near institutional planning aims or limits, particularly in materially heterogeneous or complex multi-channel configurations. A full evaluation of clinical significance in the context of cumulative EBRT + BT EQD2 reporting would require a separate endpoint-level methodology, which was outside the primary aim of this applicator-dependent dosimetric study.
Several uncertainties should be considered. Acuros® BV dose values depend on CT number-to-material conversion and density assignment, whereas residual local uncertainty from metal artifacts cannot be fully excluded. Applicator reconstruction, source position modeling, CT slice thickness, contouring variability, DVH sampling, and the absence of Acuros® BV re-optimization may also influence paired differences. The density cap QA audit revealed negligible cap-to-cap sensitivity, supporting the conclusion that cap selection is not a major explanation for the observed applicator-dependent pattern. Consequently, the reported trends should be interpreted as the results of the complete clinical recalculation workflow rather than as isolated measurements of applicator material attenuation.
Conclusions
TG-43 systematically overestimated dose relative to Acuros® BV across all evaluated applicator groups in iridium-192 HDR gynecological brachytherapy. The magnitude of this effect depended on applicator geometry, with the smallest and most consistent deviations observed for T&R, generally higher differences for T&O, an intermediate pattern for SC with a measurable inward shift of the 100% prescription isodose, and the largest and most variable deviations for UMC. The variability in UMC appears related to multi-channel source loading, dwell time asymmetry, active dwell position span, and heterogeneity-aware modeling of material and density effects. These findings demonstrate that algorithm-related dose differences should be interpreted in an applicator-specific manner, particularly in more complex treatment configurations.