Purpose
Brachytherapy (BT) remains a cornerstone of curative treatment for gynecologic cancers, particularly cervical cancer. ICRU Report 38 [1] defined dose reporting for intracavitary gynecologic brachytherapy using Manchester point A, bladder and rectum reference points, and total reference air kerma. The emergence of cross-sectional imaging (computed tomography [CT], magnetic resonance imaging [MRI]) and 3D treatment planning capabilities, enabled a transition from point-based dosimetry to volumetric, dose-volume histogram (DVH)-based dose reporting, supported by previous clinical studies [2-4]. The Groupe Européen de Curiethérapie/European Society for Radiotherapy and Oncology (GEC-ESTRO) recommendations [5] established key concepts and DVH dose-volume parameters for cervix brachytherapy, providing a practical framework for modern 3D reporting. ICRU Report 89 [6] later formalized this by defining three reporting levels for cervix brachytherapy. In this context, GEC-ESTRO conducted an international study on MRI-based brachytherapy in locally advanced cervical cancer (EMBRACE) [7]. The EMBRACE II [8] trial established a multicenter protocol with precise DVH-based planning aims and constraints for EBRT and BT. To aid clinical implementation, the GEC-ESTRO network [7] and the American Brachytherapy Society (ABS) Physics Corner [9] provided standardized Excel-based templates [9, 10] for gynecologic HDR-BT dose reporting as well as BED and EQD2 calculations. Nevertheless, many clinics rely on workflows, which require manual transcription of DVH parameters from a treatment planning system (TPS) into worksheets. This workflow is time-consuming and prone to transcription errors.
Several technical solutions have been developed to automate dose reporting in gynecologic brachytherapy.
In the Varian Eclipse™ TPS environment, Faught et al. [11] developed an ESAPI script that runs within a TPS. It generates a pop-up report in accordance with the ABS guidelines for cervical cancer. This tool combines EBRT prescription information with patient-specific HDR-BT doses, and computes BED and EQD2 for targets and organs at risk (OARs). Salerno et al. [12] designed and validated a similar ESAPI script that conforms to the EMBRACE II protocol. Also, Cheng et al. [13] developed an ESAPI script that takes a list of patient IDs to generate a comma-separated values (CSV; Excel-compatible file format) dataset. It collects dosimetric and demographic data for intracavitary and hybrid BT plans. This batch process speeds up cohort-level data export, reducing data collection time by up to 98%.
Cheng et al. [14] developed an in-house application for the Oncentra® Brachy TPS (Elekta Brachytherapy Solutions, Veenendaal, The Netherlands) that automatically extracts dose parameters from cervical cancer brachytherapy plans using a “screen-scraping” process. The extracted data are processed in Excel spreadsheets to calculate EQD2 and predict whether treatment goals will be met, enabling clinicians to balance tumor coverage with organ protection during adaptive brachytherapy.
Mroué et al. [15] reported a MATLAB-based application for automated EQD2 accumulation. This solution works with any TPS by importing dose values from standard ASCII files. The program integrates EBRT and HDR data through a graphical interface and provides real-time feedback during plan review. In their study, the reporting time was reduced to less than five seconds, and manual transcription errors were eliminated.
In the commercial sector, planning platforms, such as SagiPlan® (BEBIG Medical GmbH), include a native BED/EQD2 module. This module automates dose summation for EBRT and HDR-BT, supporting inverse planning with BED/EQD2 objectives and real-time dose accumulation. A study by Siavashpour et al. [16] used SagiPlan® to compare OAR dose calculations between automated and manual EQD2 summation methods. They found systematic and clinically significant differences, underscoring the importance of automated cumulative DVH evaluation.
Building on previous developments and addressing the need for further workflow improvement, this study developed and validated a standalone ESAPI-based application for automated DVH-based EQD2 reporting in combined EBRT and cervical cancer HDR-BT. The primary objectives were to eliminate manual DVH transcription, prevent reporting errors, and improve reporting efficiency in routine clinical practice.
Material and methods
Application implementation and workflow
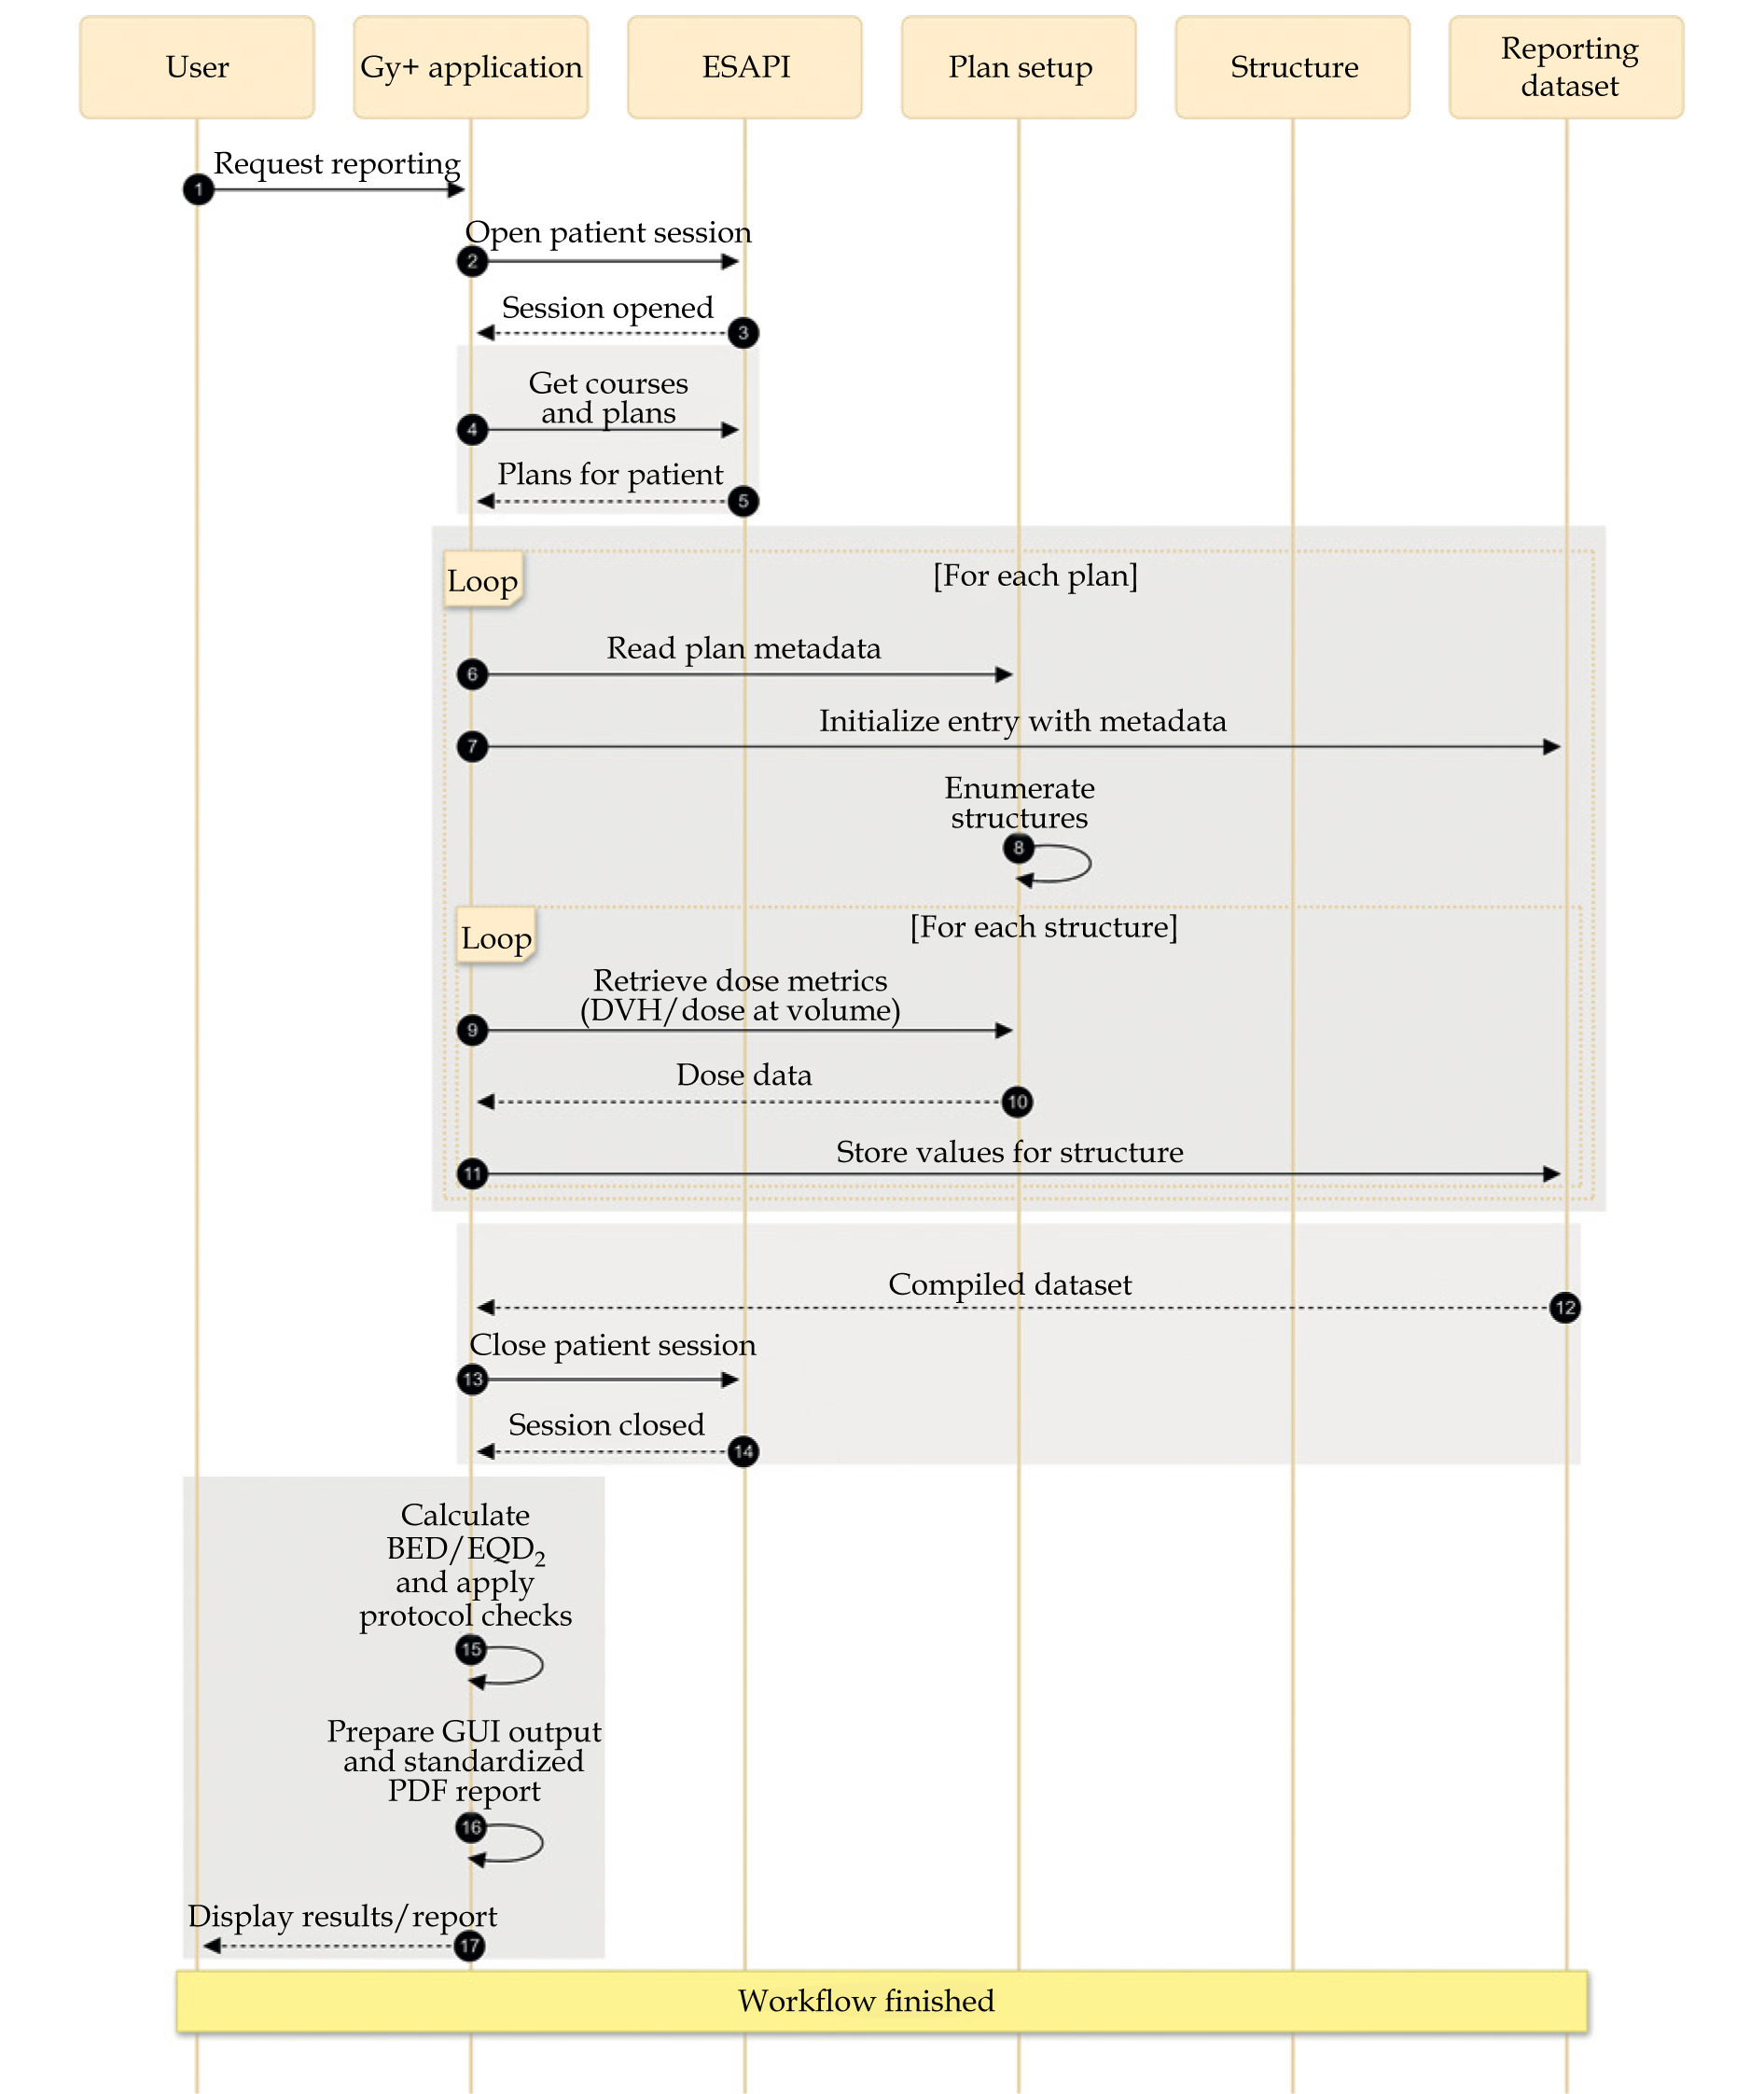
An application (Gy+) was developed in C# using ESAPI [17] (Eclipse Scripting application programming interface, Varian Medical Systems, Palo Alto, CA, USA, v. 15.5). It accesses the Eclipse™ TPS database in read-only mode. After initialization, the application establishes an ESAPI session. When a patient’s ID is entered, it retrieves all EBRT and HDR-BT treatment plans, including calculated doses and approved status. By default, the application includes high-risk clinical target volume (HR-CTV) and bladder, rectum, sigmoid, and small bowel in its reports. If a bowel bag structure is present, it is automatically detected and reported instead of separate sigmoid and small bowel structures. DVH information is extracted directly from the dose grid for each reported structure in both EBRT and HDR-BT plans. Target parameters include D50, D90, D95, and D98, while OARs parameters comprise D2cc, D1cc, and D0.1cc. Plan-level metadata are extracted directly from the TPS. These consist of patient’s identifiers, course ID, plan name, prescribed dose, dose per fraction, number of fractions, approval status, and number of planned and treated sessions. If an EBRT course contains a sequential boost, Gy+ displays a warning in the user’s interface. The boost plan’s DVH data are automatically retrieved and included in cumulative calculations. Gy+ uses parameter-wise summation, and does not perform image registration or account for spatial overlap between the boost and BT anatomy. The operator must verify anatomical relevance in the TPS. During reporting, the operator may exclude or adjust a boost contribution as clinically appropriate. The application interface also allows users to define custom α/β values, which allows the application to accommodate research-specific settings or protocol changes. Numerical integrity is ensured through redundant internal calculations. An independent DVH evaluation routine serves as a cross-check. Any deviation exceeding 0.1% triggers an internal exception. All computations use an internal precision of 0.001 Gy, and results are reported to 0.1 Gy in accordance with routine practice. Outputs follow Level 2 of the ICRU Report 89 [6] DVH-based reporting framework, with EMBRACE II [8] planning aims and dose constraints implemented as configurable reference checks for targets and OARs. The overall workflow is summarized in Figure 1. The core ESAPI back-end module for plan metadata retrieval, DVH extraction, end-point calculation, and reporting dataset preparation is provided in Supplementary Code S1. The package also includes a minimal console wrapper that returns selected outputs in a machine-readable JSON format.
Radiobiological modeling
Radiobiological parameters were calculated using the linear-quadratic (LQ) model [6, 18-20]. Biologically effective dose (BED) was calculated as:
where d is the dose per fraction, n is the number of fractions, and α/β is the tissue-specific ratio. Default α/β values of 10 Gy for tumors and 3 Gy for OARs were employed, as recommended [6, 8, 9].
The equivalent dose in 2 Gy fractions was calculated as:
Cumulative BED and EQD2 were obtained by summing each parameter across treatment plans for each reported structure, which followed the DVH parameter-based accumulation recommended in current guidelines [5, 6, 20, 21]. Summation was performed separately for EBRT and HDR-BT courses. Then, the two totals were combined to obtain the overall EBRT plus HDR-BT cumulative EQD2.
Output display and report generation
After computation, results are presented in a graphical user interface (Figure 2) before report generation. The interface shows patient identifiers (ID and name) and α/β values for tumors and OARs. A selectable list of available EBRT and BT plans is provided. Plans can be included or excluded from the cumulative calculation using selection controls. For each included plan, the results table displays course ID, plan name, prescribed physical dose, dose per fraction, and number of fractions. Corresponding DVH parameters for the target and OARs are also listed. Cumulative EQD2 values appear with separate sub-totals for EBRT and BT, followed by a final combined EBRT plus HDR-BT summary (Figure 2).
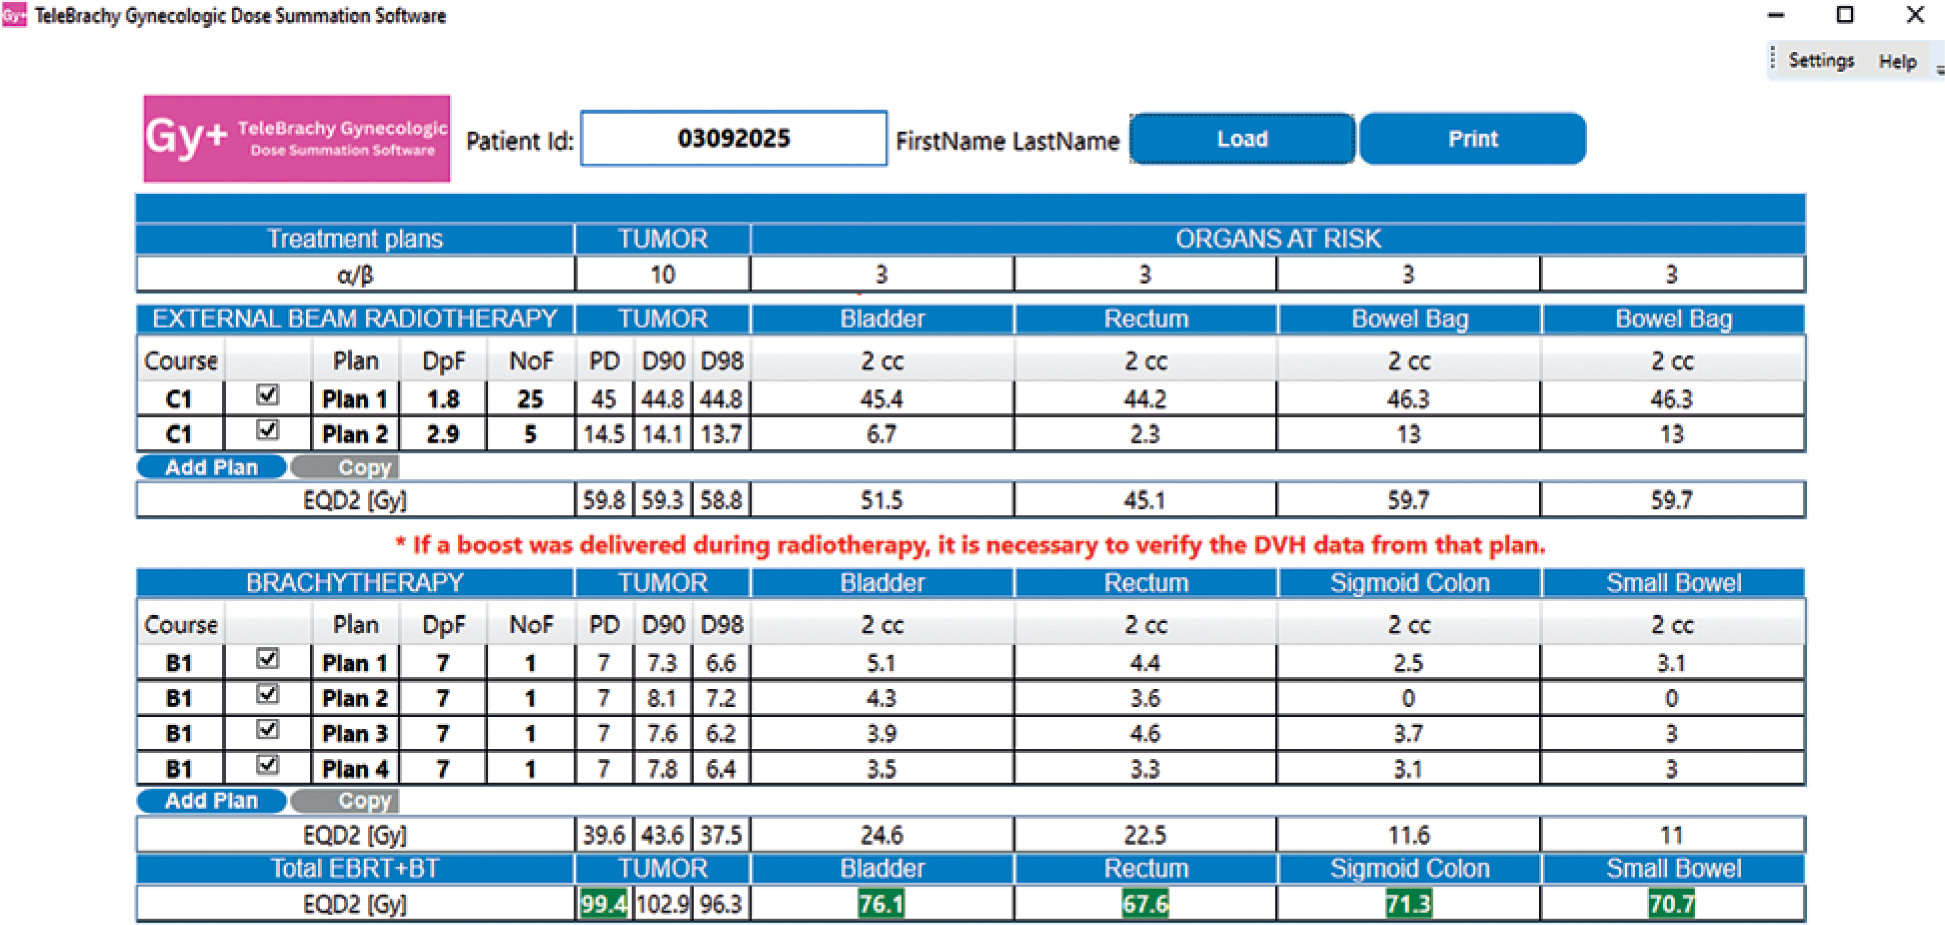
Protocol compliance is displayed in real-time with color-coded cues. Scenario functions (‘Copy plan’ and ‘Add plan’) allow users to test cumulative EQD2 by duplicating an entry or adding a hypothetical plan, without changing TPS data.
Once reviewed as part of integrated workflow, a standardized PDF report is automatically generated in a single-step, with automated file naming and saved locally (Supplementary Figure 1). The on-screen results table can be copied from the user interface for local usage. A dedicated one-click numeric export from the graphical interface (e.g., CSV or TXT) is not available in the current version, but is planned for a future update.
Technical verification and clinical validation
Technical verification and clinical validation comprised two components, both conducted on the same retrospective cohort of 40 patients. First, technical verification was performed. Key plan metadata, including course ID, plan name, prescribed dose, dose per fraction, and number of fractions, were verified by direct visual comparison, with values displayed in the Eclipse™ TPS interface for all evaluated cases. For bladder and rectum D2cc, DVH values reported by Gy+ were independently retrieved using Varian’s publicly available ‘DVH Lookups’ ESAPI script [22], and compared per patient. The ESAPI-derived values were then manually transcribed into the ABS/GEC-ESTRO-hosted reporting GYN HDR-BT worksheet [9, 10] to verify EQD2 calculation and radiobiological modeling by comparing cumulative doses with Gy+ outputs. No statistical analysis was performed, because this was a deterministic numerical verification.
Second, clinical validation against the existing clinical workflow (manual workflow) was performed. For these 40 patients (154 HDR-BT plans), Gy+ reports were generated for this study and compared with the pre-existing brachytherapy reporting worksheets completed in routine clinical practice. In the existing clinical workflow, bladder and rectum D2cc values were read directly from DVH curves in Eclipse™ using cursor-based point selection for each plan, and manually entered into a local Excel worksheet. DVH parameters for sigmoid and small bowel were not recorded, because these structures were not included in the worksheet template. For HR-CTV, no DVH-based target metrics (e.g., D90 or D98) were documented; only the prescribed brachytherapy dose per fraction was recorded.
Runtime measurement
Runtime was measured from application’s launch to on-screen display of results, to completion of PDF generation, and to file save. The test system was a clinical workstation (Dell Precision 7820 XL Tower, with dual Intel Xeon Silver 4110 processors and 32 GB of RAM) used for Eclipse™ TPS operations.
Statistical analysis
Statistical analysis was performed to compare Gy+ against the existing clinical workflow. Based on Gy+ reports (n = 40 patients) and the pre-existing manual reporting worksheets (n = 40 patients), two datasets were created. The first dataset contained patient-level cumulative brachytherapy D2cc EQD2 values for bladder and rectum, summed across all brachytherapy fractions per patient (n = 40 per OAR). The second dataset included plan-level D2cc EQD2 values for bladder and rectum for all brachytherapy plans (n = 154 per OAR). In both datasets, signed differences in D2cc EQD2 values were defined as ΔD2cc = (existing clinical workflow − Gy+).
For both datasets, normality was tested using Shapiro-Wilk test. Descriptive statistics included mean ± standard deviation (SD), median, interquartile range (IQR), mean absolute deviation (MAD), and range (minimum to maximum). Agreement was assessed by calculating the proportion of cases with absolute differences within ±0.1 Gy, ±0.01 Gy, and ±0.001 Gy. Wilcoxon’s signed-rank test was used to compare D2cc EQD2 values between the existing workflow and Gy+. Signed differences (ΔD2cc) were visualized with box-and-whisker plots. Statistical analyses were performed using Origin® 2021 (OriginLab, Northampton, MA, USA)and IBM® SPSS® Statistics 23 (IBM Corp., Armonk, NY, USA).
Results
Figure 2 shows a representative on-screen display generated by Gy+, and Supplementary Figure 1 presents an example of exportable PDF report.
Technical verification against reference script
No discrepancies were observed in plan metadata verification. For all 40 patients in the validation cohort, Gy+ reported DVH parameters identical to those obtained independently using the DVH Lookups script [22], with precision levels of ±0.1 Gy, ±0.01 Gy, and ±0.001 Gy. Manually entering the same DVH input into the ABS worksheet [9, 10] produced results matching Gy+ at the ±0.1 Gy threshold.
Clinical validation against existing clinical workflow
The Shapiro-Wilk test indicated that D2cc EQD2 values and their differences (ΔD2cc) were not normally distributed at both the patient level and the plan level, justifying the use of non-parametric statistical methods.
Table 1 compares ΔD2cc EQD2 values between the existing clinical workflow and Gy+ for the bladder and rectum at two levels: 1. Patient-level cumulative brachytherapy values across 40 patients, and 2. Plan-level values across 154 HDR-BT plans.
Table 1
Differences in the bladder and rectum D2cc EQD2 values between the existing clinical workflow and Gy+
At the patient level (n = 40), median differences were −0.061 Gy (IQR: 0.176 Gy) for the bladder and −0.066 Gy (IQR: 0.170 Gy) for the rectum, with 52.5% and 47.5% of values agreeing within ±0.1 Gy, respectively.
At the plan level (n = 154), median differences were −0.013 Gy (IQR: 0.172 Gy) for the bladder and −0.012 Gy (IQR: 0.069 Gy) for the rectum, with 87.0% and 89.6% agreeing within ±0.1 Gy, respectively.
All the medians were negative, while the mean values were negative for the bladder and positive for the rectum. The percentage of cases with |ΔD2cc| within the specified threshold decreased as the sensitivity increased from ±0.1 to ±0.001 Gy.
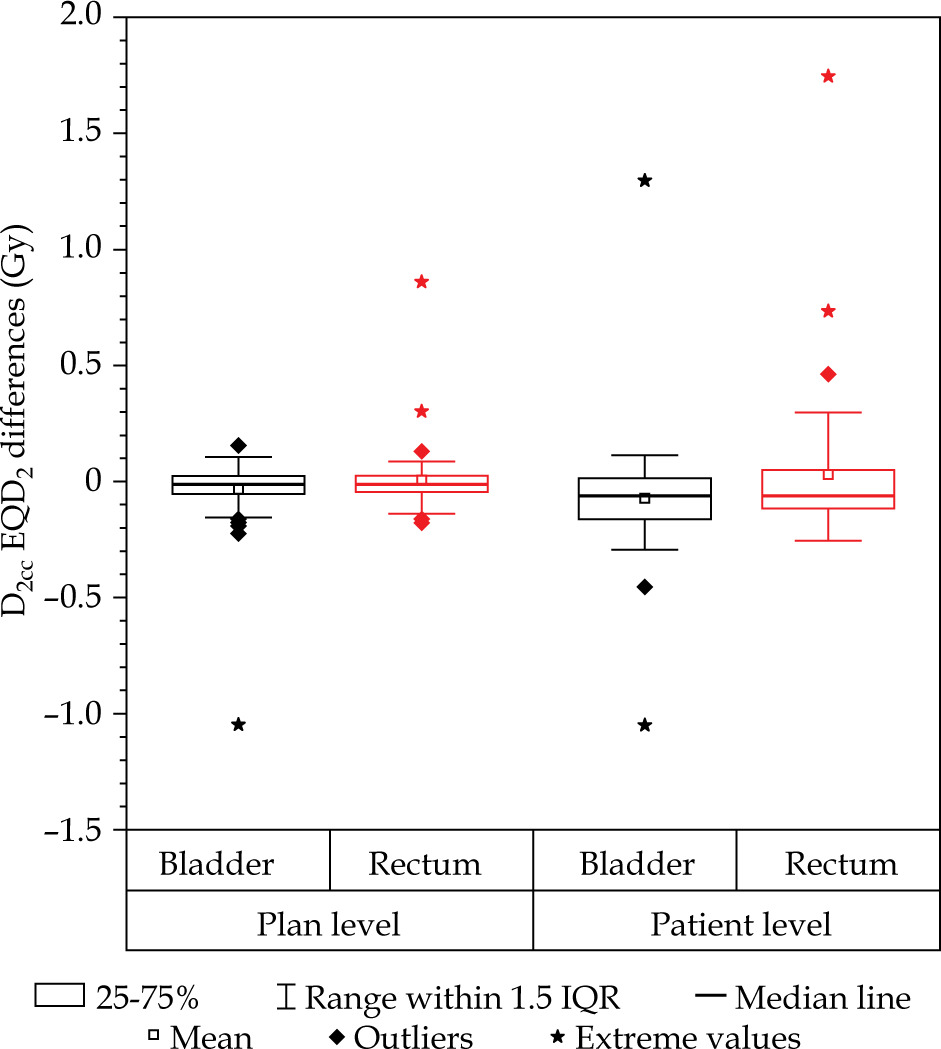
Box plots (Figure 3) indicated the presence of a significant number of outliers (◆), including extreme outliers (★). Also, among extreme outliers, positive values occurred more frequently.
Fig. 3
Box plots of signed differences in D2cc EQD2 values between the existing clinical workflow and Gy+. Left panel shows plan-level differences (n = 154 plans per OAR). Right panel shows patient-level cumulative brachytherapy differences (n = 40 patients per OAR)
The Wilcoxon signed-rank test indicated that the D2cc EQD2 values for both the organs and levels differed significantly at the 0.05 confidence level. According to this test, the effect size (r) was 0.30 at the plan level and 0.42 at the patient level.
Reporting efficiency
From application launch, Gy+ required an average of 25 seconds to display on-screen results, and 35 seconds to generate and save the PDF. The existing clinical workflow, which involved manually reading DVH values from Eclipse™ TPS and entering them into the Excel worksheet, required approximately 6 minutes per patient.
Discussion
The results demonstrate that automated DVH-based EQD2 reporting can achieve high accuracy, reduce clinical workload substantially, and eliminate transcription errors associated with manual data handling.
The verification process confirmed the accuracy and precision of DVH data extraction from the TPS as well as the correctness of the subsequent BED and EQD2 calculations. Gy+ produced DVH parameters identical to those from a trusted ESAPI reference script [22]. Furthermore, when these verified inputs were propagated through the established ABS-hosted reporting worksheet [9, 10], the resulting EQD2 values matched Gy+’s outputs within ±0.1 Gy. This strong alignment at every verification stage demonstrates that the automation introduces no errors in both data retrieval and radiobiological modeling, a critical requirement for safe clinical implementation.
Table 1 shows that mean differences are small at both levels, indicating strong agreement between doses obtained using the manual workflow and Gy+. However, box plots (Figure 3) reveal several outliers, including extreme cases. These outliers stem from systematic errors in the manual workflow, such as misreading DVH cursor values, transposing bladder and rectum values during data entry, and unexplained phantom values in the Excel worksheet. Eliminating these errors is a primary motivation for adopting Gy+ over manual workflows.
The statistically significant differences (p < 0.05) observed at both levels are attributed to systematic inconsistencies in the manual data handling. According to Cohen’s [23] criterion for effect size, Wilcoxon test values (r = 0.30-0.42) indicate a small to moderate effect. This result highlights a key advantage of automation, namely the elimination of operator-dependent variability in high-precision domains, such as brachytherapy dose reporting.
Our findings are in line with those reported by Siavashpour et al. [16], who identified systematic and clinically significant differences between manual and automated EQD2 summation using SagiPlan®, further supporting the importance of automated cumulative DVH evaluation. These findings also align with the principles of AAPM TG-100 [24], which emphasize the importance of error-mitigating workflows in radiotherapy.
Reducing reporting time from approximately 6 minutes to 35 seconds represents an approximately ten-fold improvement in efficiency. This time saving enables medical physicists to focus on higher value tasks, including plan optimization, quality assurance, and patient-specific quality control. The standardized PDF output ensures consistent documentation, which is essential for institutional audits, multi-institutional trials, and long-term outcome analysis.
Compared with existing automation approaches, the standalone architecture of Gy+ offers several practical benefits. In-TPS ESAPI scripts, such as those reported by Faught et al. [11] and Salerno et al. [12], provide near-instantaneous on-screen feedback, but remain limited to the Eclipse™ environment and do not generate exportable reports. The semi-automated solution shown by Cheng et al. [14] for Oncentra® Brachy uses screen scraping to capture DVH data. Cross-platform solutions, such as the MATLAB application in Mroué et al. [15], achieve reporting times under 5 seconds, but require manual file export. The 35-second reporting time of Gy+ includes both PDF generation and protocol validation checks, representing a balance between speed and comprehensive documentation. The current implementation is specific to Varian Eclipse™ via ESAPI. The modular standalone architecture separates reporting and radiobiological calculations from the TPS user’s interface, which may facilitate future adaptation to other TPS environments, if suitable programmatic interfaces and validation resources become available.
The clinical relevance of automated reporting extends beyond workflow efficiency. Real-time feedback on protocol compliance can support adaptive decision-making during fractionated brachytherapy, facilitating optimization of target coverage, while respecting OAR constraints in line with EMBRACE II [8] objectives. Moreover, error-free documentation enhances the reliability of data used for outcome modeling and quality improvement initiatives.
The dose summation approach implemented in Gy+ follows the DVH parameter-based EQD2 accumulation used in current clinical reporting frameworks. However, this approach has recognized limitations, particularly because high-dose sub-volumes from EBRT and BT may not be spatially co-localized within the same organ. Kim et al. [21] described linear DVH parameter addition as the global standard for composite dose reporting; however its accuracy decreases when EBRT dose distributions are heterogeneous, especially when high-dose EBRT gradients occur in a BT treatment region. This issue was also demonstrated by Fröhlich et al. [25], who manually identified the most exposed 2 cm3 OAR volumes from BT on EBRT CT images, and showed that uniform dose conception may overestimate OAR doses, because the most exposed EBRT and BT sub-volumes are not necessarily identical.
Gy+ partially addresses EBRT dose heterogeneity by extracting structure-specific DVH parameters directly from the calculated EBRT dose grid rather than assuming uniform EBRT contribution. Nevertheless, it remains a parameter-wise summation method, and does not perform spatial dose accumulation or image registration. Therefore, potential mismatches between EBRT and BT high-dose sub-volumes as well as between successive BT fractions due to applicator displacement and organ deformation, remain an inherent limitation. Voxel-wise accumulation using deformable image registration could theoretically reduce this uncertainty, but its clinical use in cervix brachytherapy remains challenging due to applicator-induced anatomical changes, algorithm dependence, and incomplete validation, as also noted in the ICRU Report 89 [6] and discussed by Kim et al. [21]. For this reason, Gy+ uses the clinically established parameter-wise approach while providing user’s alerts for complex boost scenarios, in which anatomical relevance should be verified in the TPS.
Several limitations should be acknowledged. Although technical verification confirmed accurate DVH extraction and EQD2 calculation for all reported structures and parameters, clinical validation against the existing workflow was limited to D2cc for the bladder and rectum due to the availability of historical clinical records. Prospective validation incorporating all reported parameters and structures in clinical practice would further strengthen the evidence base.
For cases involving sequential EBRT boosts, Gy+ alerts the user to verify anatomical relevance, supporting clinical judgment in dose interpretation.
Adapting to institutional variations in structure naming conventions and reporting requirements would improve portability across clinical settings. Further optimizing application performance to reduce reporting time would facilitate integration with clinical workflows. Maintaining compatibility with new Eclipse™ releases will be essential to ensure seamless integration into evolving clinical workflows. Although the current implementation is specific to Varian Eclipse™ via ESAPI, future work may explore adaptation to other TPS environments, if suitable programmatic interfaces and sufficient validation resources become available.
Conclusions
This study demonstrates that Gy+ provides accurate, efficient, and reproducible automated EQD2 reporting for cervical cancer brachytherapy in accordance with the ABS/GEC-ESTRO guidelines. Technical verification confirmed the exact agreement with independent calculations for all DVH parameters and EQD2 values. Clinical validation revealed systematic errors in the existing manual workflow, evidenced by outliers and statistically significant differences attributable to operator-dependent errors. By eliminating these errors and reducing reporting time from 6 minutes to 35 seconds, Gy+ enhances both patient safety and workflow efficiency. The tool appears suitable for clinical implementation within the Eclipse™ environment, with future development focused on multi-platform compatibility to support diverse treatment planning environments.