
Introduction
Del Nido cardioplegia (DN) is a depolarising cardioplegic solution containing the patient’s blood in a 4 : 1 ratio. Developed by Pedro del Nido’s team for paediatric cardiac surgery, it has also been successfully introduced into adult cardiac surgery across various procedures [1–4]. The DN protocol ensures 60 minutes of protection without requiring additional doses. However, if the surgeon can complete the procedure within 90 minutes of the initial administration, no further infusion is necessary. Compared with cold-blood cardioplegia (CBC), DN provides good cardioprotection while significantly reducing cardiopulmonary bypass (CPB) and aortic cross-clamp (XC) times [5–7].
Bretschneider-HTK cardioplegia (HTK), on the other hand, is a crystalloid hyperpolarising solution. After a single dose, the surgeon has 120 minutes to complete the procedure without needing a re-dose. This timeframe allows for uninterrupted performance of cardiac procedures. However, the high cost and inconclusive results from studies comparing HTK with CBC are notable disadvantages [8, 9].
The HTK was the primary cardioplegia type at our institution until 2018, when DN was introduced as an alternative in routine practice.
In the era of minimally invasive cardiac surgery, the importance of single-dose cardioplegia solutions is increasing. Despite numerous studies, there is no consensus on which solution is most effective in protecting adult cardiomyocytes. Most studies, however, focus on comparing DN with CBC [10]. Additionally, the type and composition of cardioplegia may influence postoperative outcomes and laboratory results. Given the limited number of randomised controlled trials comparing HTK and DN, we were inspired to conduct this study. We chose elective aortic valve replacement (AVR) for our research, as it is a standard procedure in cardiac surgery and is performed under well-controlled cardioprotection conditions.
Aim
This study aimed to compare the cardioprotective properties and in-hospital clinical outcomes of the two most widely used single-dose cardioplegic solutions, DN and HTK.
Material and methods
Trial design
The study was conducted in accordance with the principles outlined in the Declaration of Helsinki. The study protocol received approval from the institutional ethics committee and the hospital’s research commission (NKBBN/203/2018). It was a single-centre, parallel randomised study with a 1 : 1 allocation ratio, involving 100 patients. All participants provided obligatory informed written consent before surgery. The manuscript was prepared in accordance with the CONSORT statement guidelines.
Eligibility
We enrolled patients aged 18 and over who were scheduled for elective isolated AVR, either for stenosis, insufficiency or mixed aortic valve disease. Patients with significant coronary artery disease, urgent cases, and those requiring additional cardiac procedures were excluded.
Randomisation
Randomisation was conducted using the envelope method. One hundred sealed envelopes containing the name of cardioplegia (either DN or HTK) were prepared. An envelope was randomly drawn at the time of anaesthesia induction.
Interventions
Surgery was performed under general anaesthesia through a standard full sternotomy. The choice of implanted valve prosthesis was made collaboratively by the surgeon and the patient, following established guidelines and considering typical indications. After heparin administration, CPB was initiated using standard cannulation techniques. The operation was conducted under moderate to mild hypothermia. Continuous CO2 insufflation was used during the procedure. Cardioplegia was delivered antegrade, retrograde, or via both methods, depending on the surgeons’ preferences. The compositions of both cardioplegic solutions are well documented and have been described in the literature previously [11]. The total cardioplegia dose varies depending on the type used. At our institution, the standard initial dose of the DN cardioplegia is 1000 ml, delivered under a system pressure of 90–150 mm Hg. The hospital pharmacy prepares the crystalloid solution, which is then mixed with the patient’s blood in the operating room. If the XC is expected to exceed 90 minutes, an additional dose of 500 ml is administered at the 60-minute mark. The temperature of the delivered DN is set at 4°C.
For the HTK, the dosage is calculated using the rule of 20 ml/kg. This solution is also delivered under a system pressure of 90–150 mm Hg. If the XC exceeds 120 minutes, an additional dose is given, calculated at 10 ml/kg. The temperature for the delivered HTK cardioplegia is also maintained at 4°C.
The primary endpoints
The primary endpoints of the study were the concentrations of serum high-sensitivity cardiac troponin I (hsTnI) and creatine kinase–myocardial band (CK-MB), which were measured at the 6th, 24th, and 48th hour postoperatively. The secondary outcomes included details on CPB and cardioplegia delivery, the type of heart rhythm observed after XC, the need for defibrillation, intraoperative blood gas results, and the postoperative vasoactive-inotropic score (VIS). Additionally, postoperative complications were monitored, including bleeding that required re-sternotomy, pericardial drainage, stroke or transient ischaemic attack (TIA), acute kidney injury (AKI), new atrial fibrillation (AF), new heart block, and in-hospital mortality.
Statistical analysis
Statistical analyses were conducted using the R program, version 4.1.2. (R Core Team 2022). For categorical variables, Fisher’s exact test was used to assess group differences. The normality of quantitative variables was evaluated using the Shapiro-Wilk test. For continuous variables that conformed to a normal distribution, Student’s t-test was used for group comparisons. If the distribution significantly deviated from normality, the Mann-Whitney U test was used for comparisons between two samples, and the Kruskal-Wallis test for comparisons involving multiple samples. Correlations between variables were assessed using the Pearson or Spearman method, depending on the data distribution. In all analyses, a p-value of < 0.05 was considered statistically significant.
Results
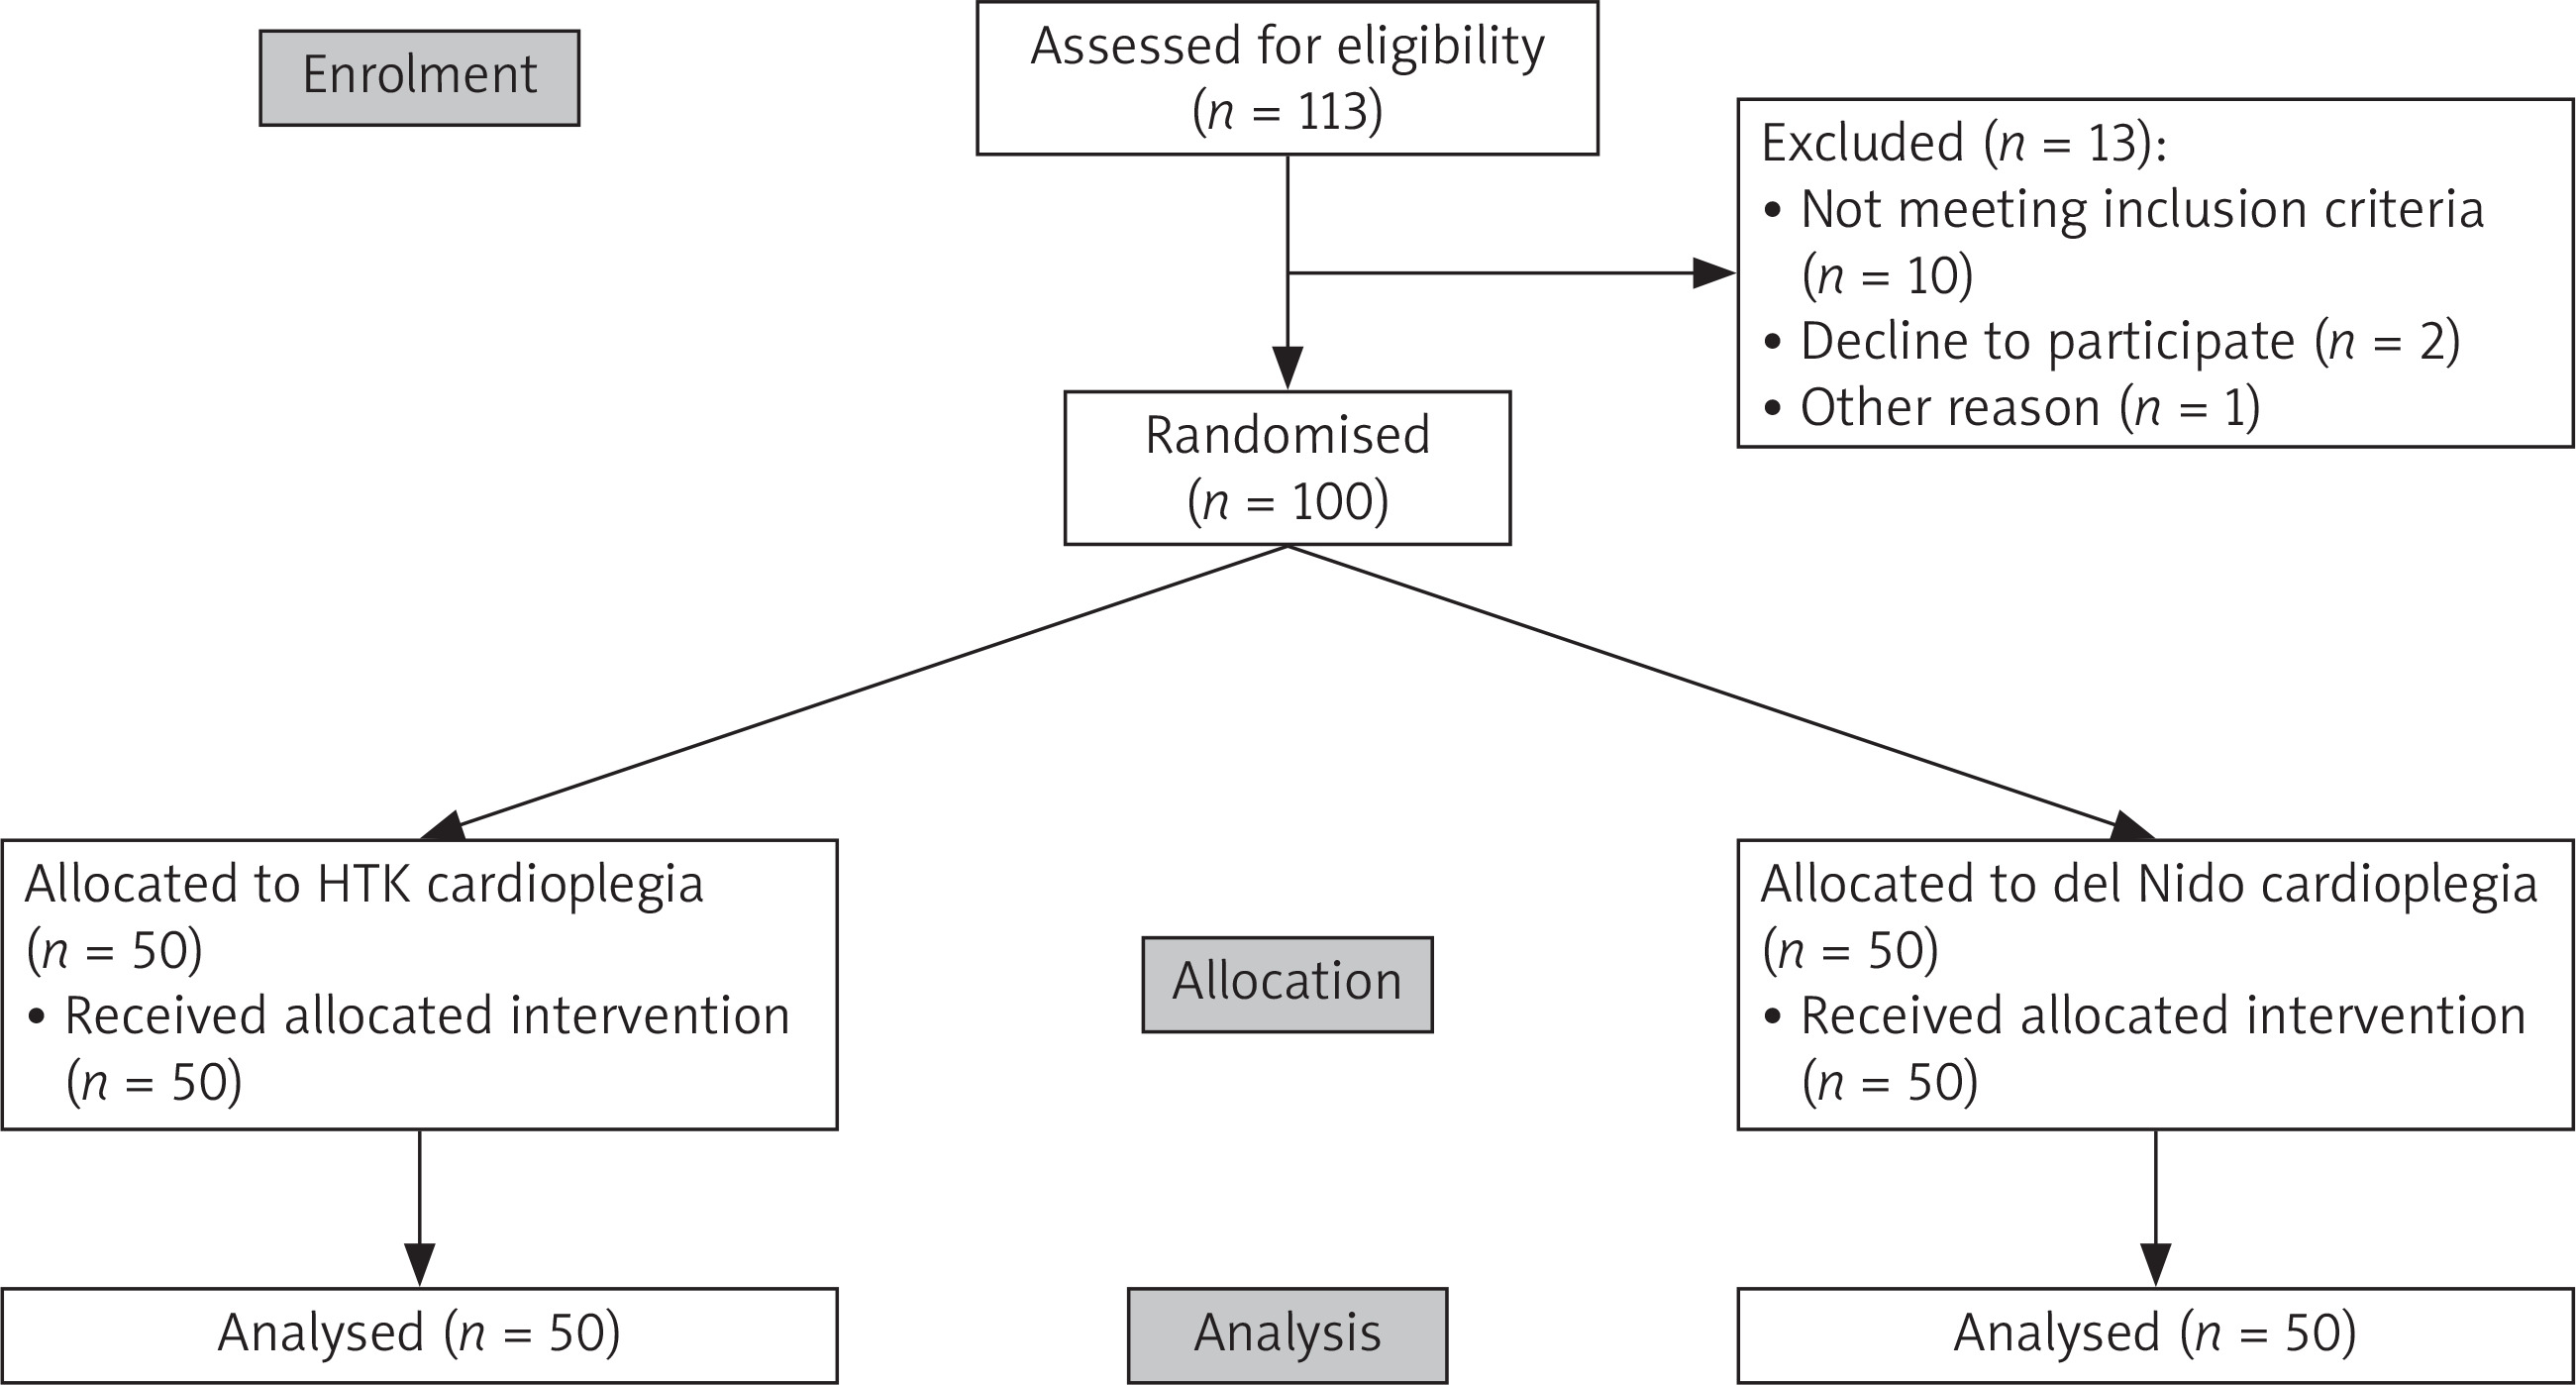
Recruitment started in October 2018 and continued until April 2022. As intended, we included 100 cases. The flowchart is illustrated in Figure 1.
Baseline data
Baseline data are presented in Table I. The groups were similar in terms of demographic information, comorbidities, and baseline laboratory results, except for preoperative sodium levels, which were higher in the HTK group. Additionally, preoperative levels of hsTnI and CK-MB were comparable between the groups.
Table I
Baseline data
| Characteristics | DN (n = 50) | HTK (n = 50) | P-value |
|---|---|---|---|
| Demographics | |||
| Age [years] | 66.33 (39.28–79.65) [N = 50] | 67.78 (40.08–81.12) [N = 50] | 0.38a |
| Female | 26% (13/50) | 36% (18/50) | 0.39c |
| Weight [kg] | 82.34 (15.24) [N = 50] | 84.22 (14.44) [N = 50] | 0.53b |
| Height [m] | 1.7 (1.52–1.9) [N = 50] | 1.69 (1.51–2.03) [N = 50] | 0.65a |
| BMI | 28.69 (4.52) [N = 50] | 29.74 (4.87) [N = 50] | 0.28b |
| BSA | 1.93 (0.2) [N = 50] | 1.94 (0.19) [N = 50] | 0.74b |
| EuroSCORE II | 1.08 (0.56–3.85) [N = 48] | 1.08 (0.5–3.5) [N = 48] | 0.51a |
| Type of aortic valve disease | |||
| Stenosis | 90% (45/50) | 88% (44/50) | 0.72c |
| Regurgitation | 4% (2/50) | 2% (1/50) | |
| Mixed | 6% (3/50) | 10% (5/50) | |
| Comorbidities | |||
| Cardiovascular disease | 20% (10/50) | 28% (14/50) | 0.48c |
| Peripheral vascular disease | 6% (3/50) | 6% (3/50) | > 0.99c |
| Post–myocardial infarction | 4% (2/50) | 10% (5/50) | 0.44c |
| Diabetes mellitus | 26% (13/50) | 26% (13/50) | > 0.99c |
| Insulin–dependent | 6% (3/50) | 2% (1/50) | 0.62c |
| Arterial hypertension | 58% (29/50) | 70% (35/50) | 0.30c |
| Pulmonary vascular disease | 0% (0/50) | 2% (1/50) | > 0.99c |
| Chronic obstructive pulmonary disease | 4% (2/50) | 2% (1/50) | > 0.99c |
| Heart failure | 16% (8/50) | 14% (7/50) | > 0.99c |
| Chronic kidney disease | 2% (1/50) | 4% (2/50) | > 0.99c |
| Hypothyroidism | 2% (1/50) | 10% (5/50) | 0.20c |
| Atrial fibrillation | 8% (4/50) | 20% (10/50) | 0.15c |
| Preoperative laboratory results | |||
| Creatinine [mg/dl] | 0.93 (0.57–2.27) [N = 49] | 0.9 (0.55–1.85) [N = 49] | 0.80a |
| Lowered eGFR (< 60%) | 18.37% (9/49) | 24% (12/50) | 0.54c |
| [K+] [mmol/l] | 4.3 (3.8–5.2) [N = 50] | 4.3 (3.5–5.4) [N = 49] | 0.94a |
| [Na+] [mmol/l] | 140 (130–147) [N = 50] | 141 (135–147) [N = 49] | 0.0121a |
| hsTnI [µg/l] | 0.012 (0.005–1.300) [N = 43] | 0.010 (0.005–0.359) [N = 43] | 0.97a |
| CK-MB [µg/l] | 1.4 (0.01–8.6) [N = 43] | 1.25 (0.7–59.3) [N = 44] | 0.84a |
| Hb [g/dl] | 13.82 (1.38) [N = 50] | 13.32 (1.53) [N = 50] | 0.09b |
| Hct [%] | 40.66 (3.85) [N = 50] | 39.49 (4.33) [N = 50] | 0.16b |
| White blood cells [× 109/l] | 7.38 (1.85) [N = 50] | 7.44 (1.6) [N = 50] | 0.87b |
| Platelets [× 109/l] | 204 (127–373) [N = 50] | 208 (96–400) [N = 50] | 0.63a |
Primary outcomes
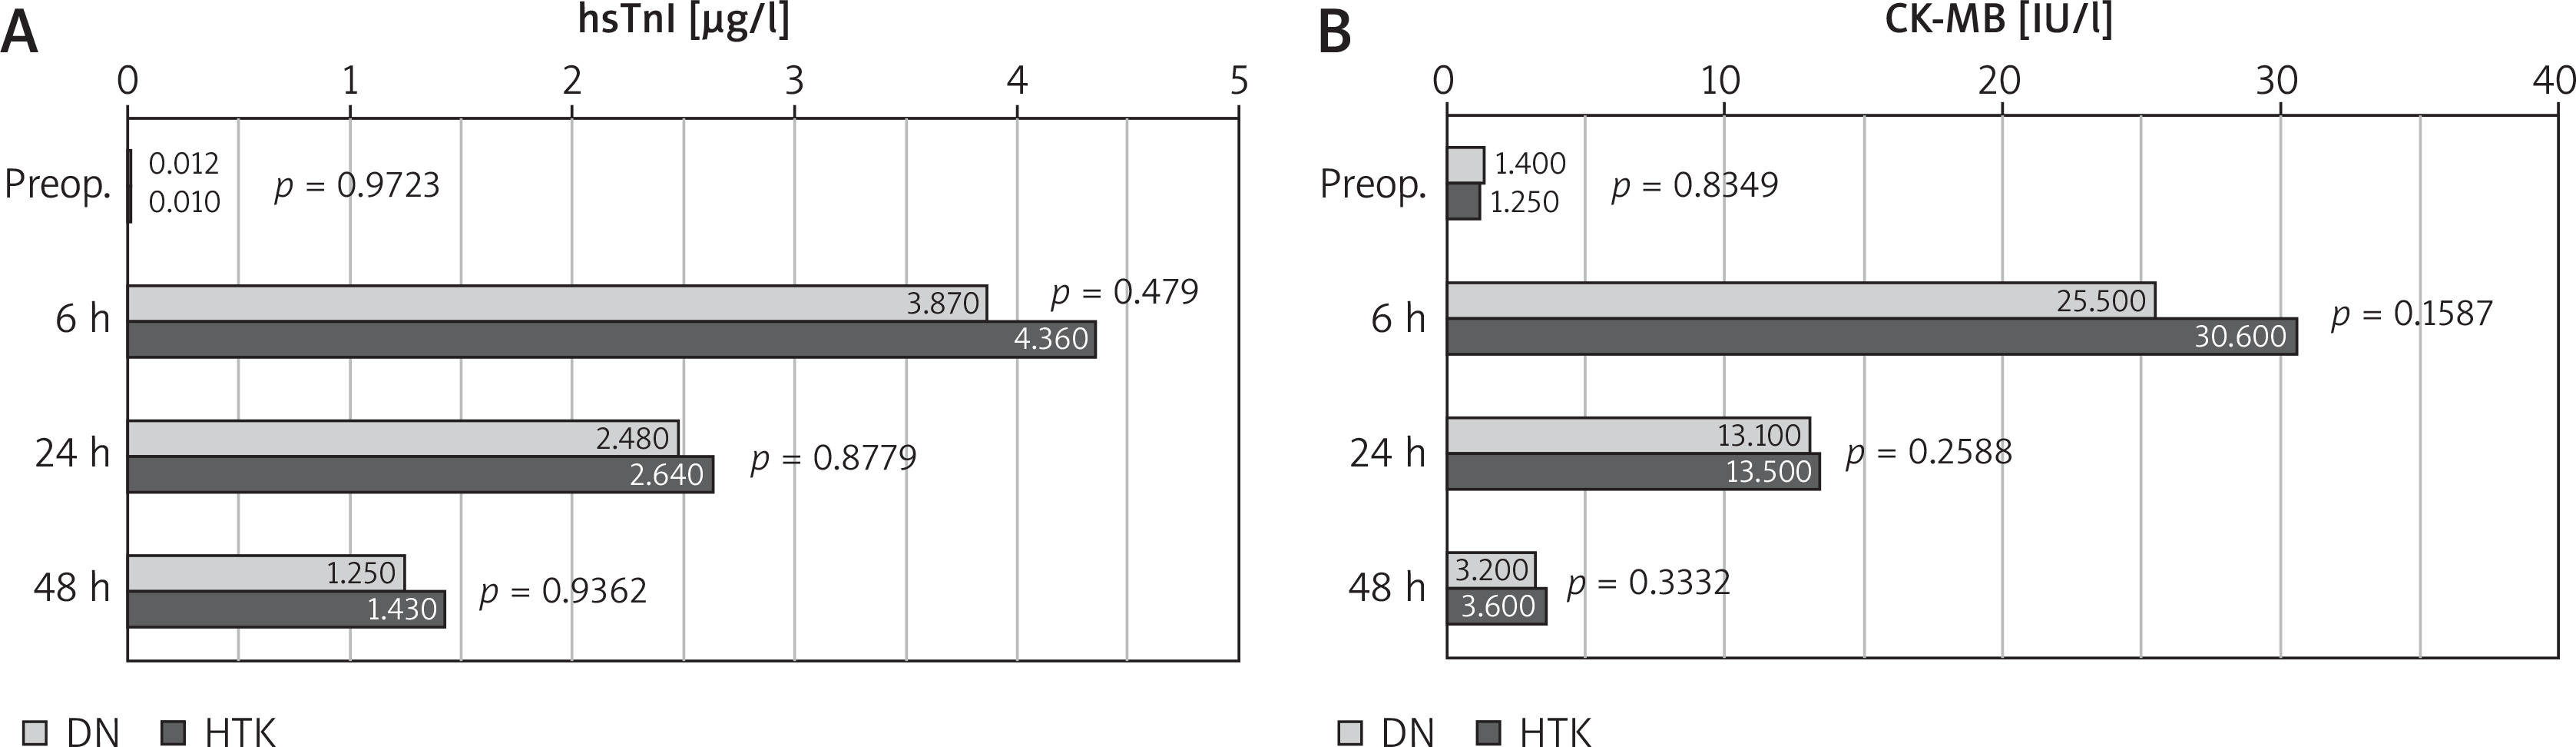
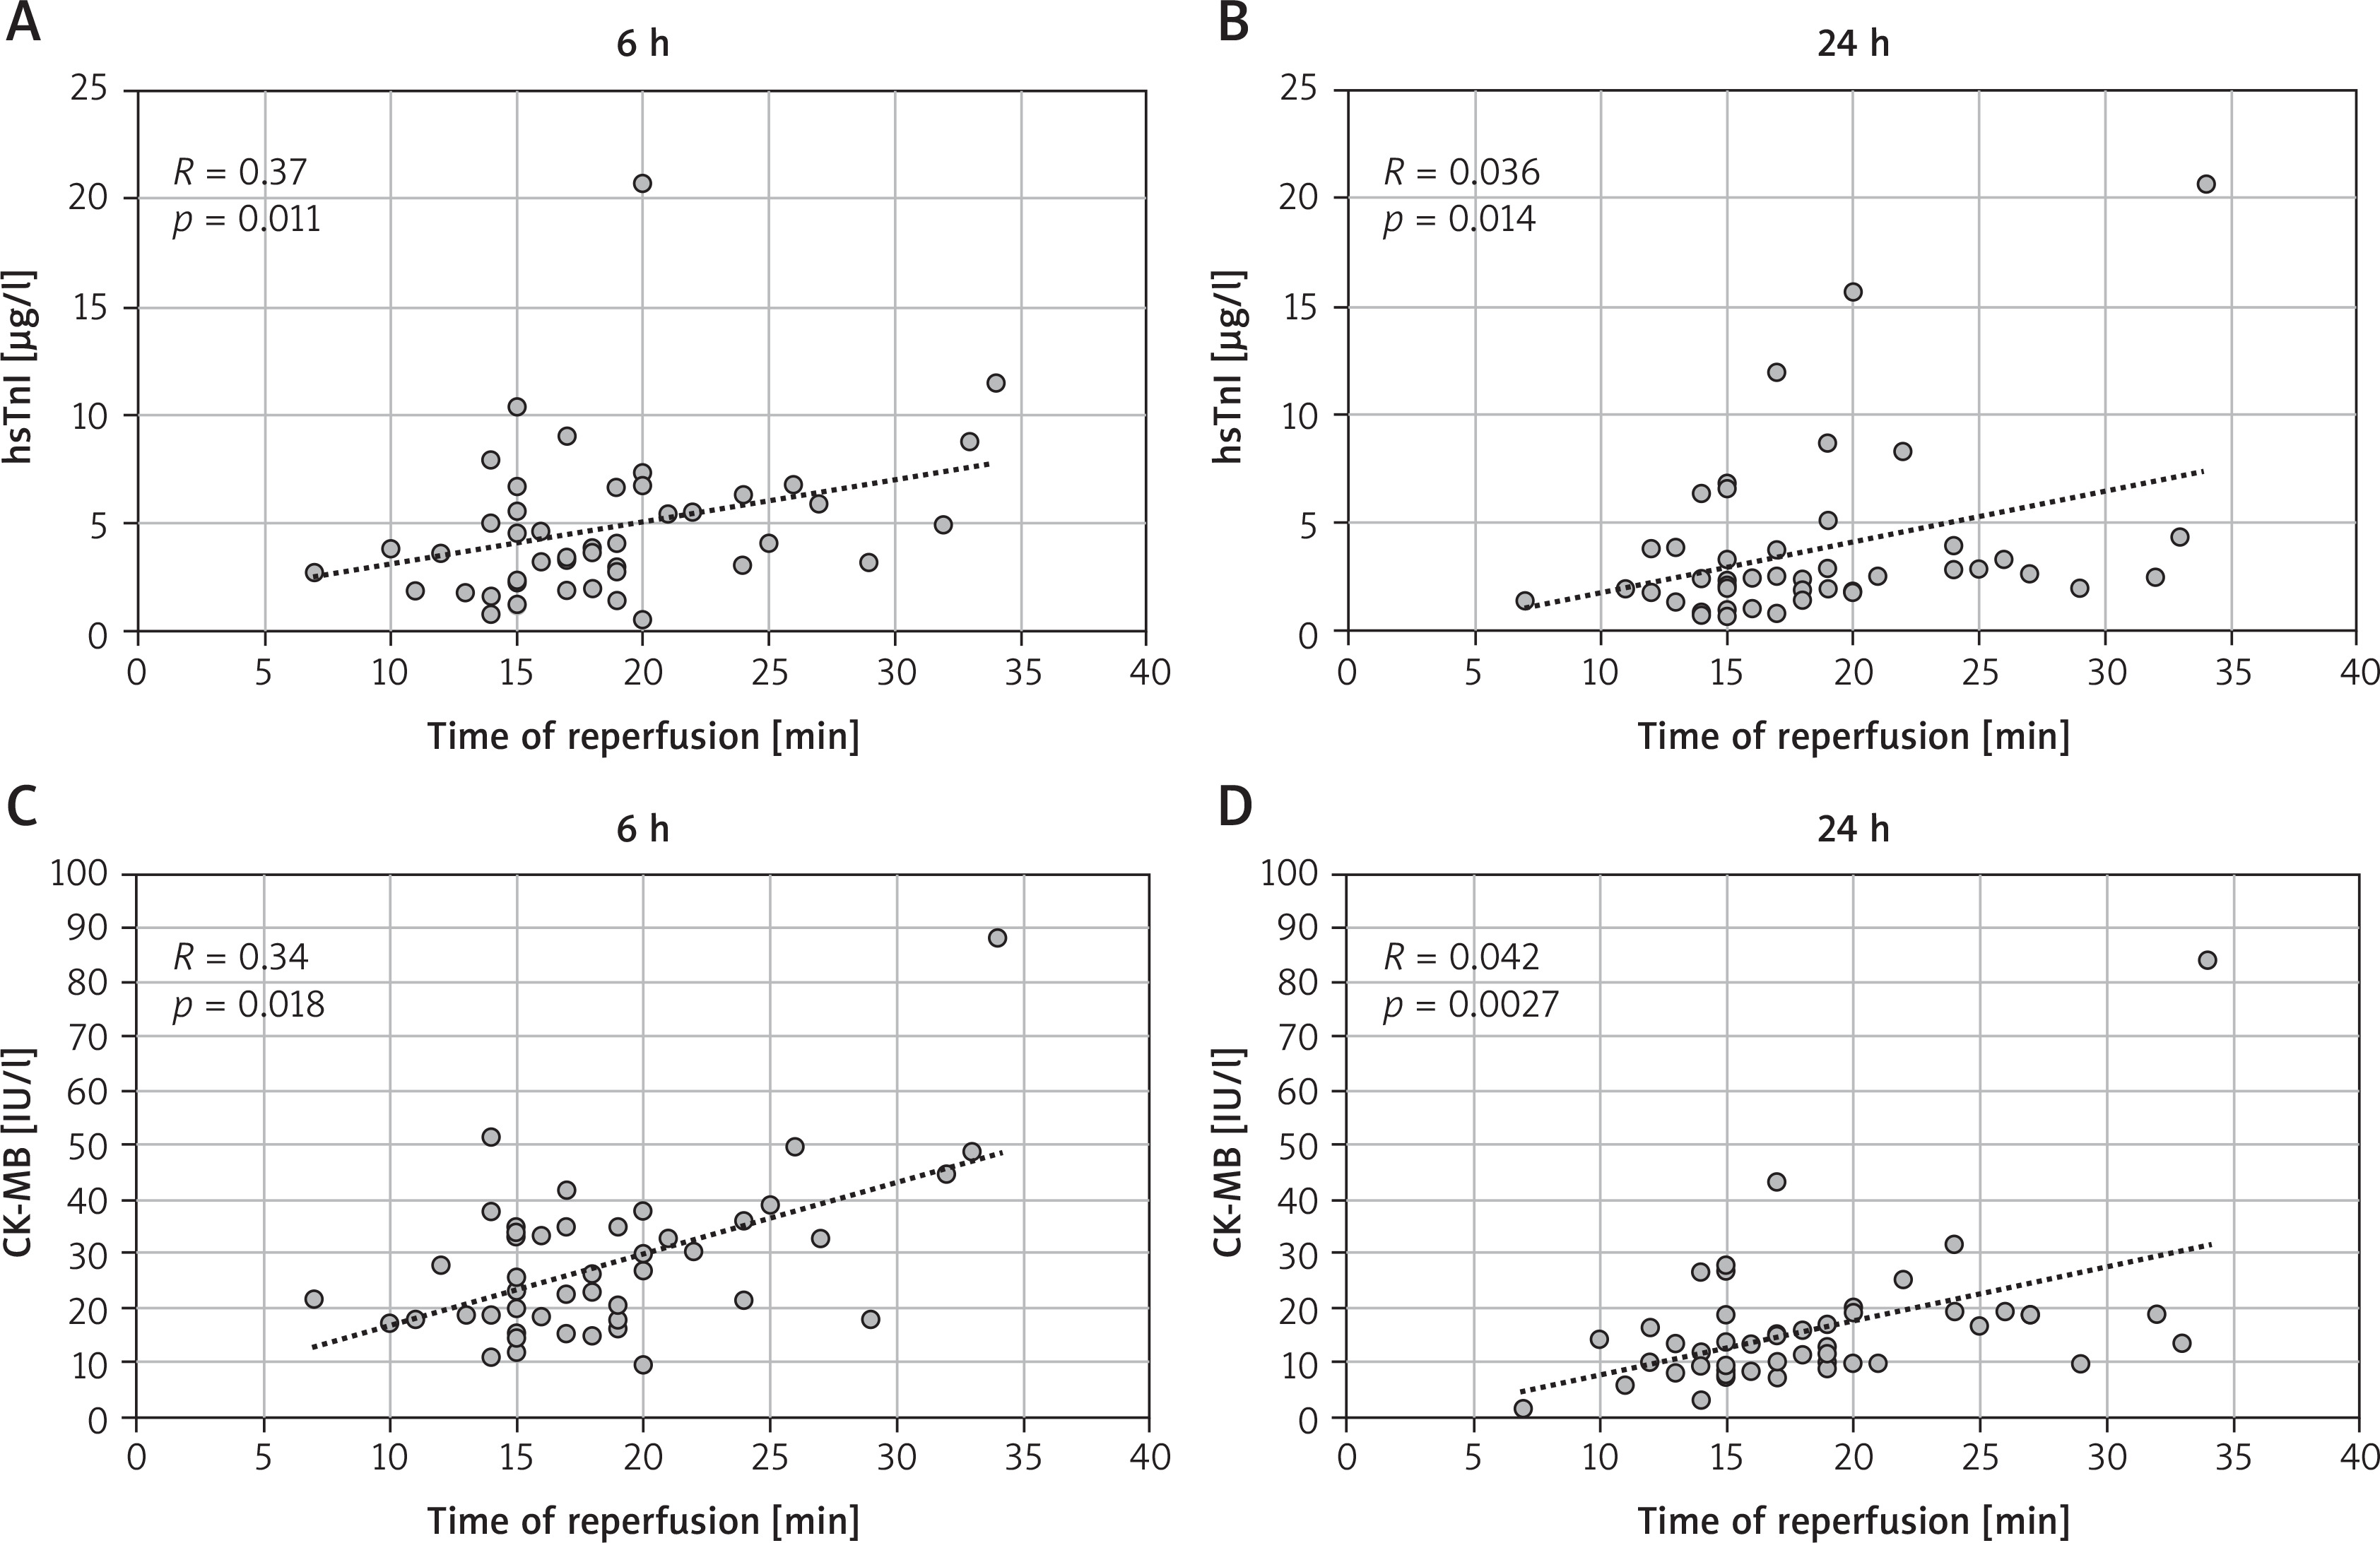
The levels of hsTnI and CK-MB at all three postoperative time points were similar between the groups, with the highest values observed 6 hours after surgery for both cardiac markers (Figure 2). We identified a positive correlation between reperfusion time and both hsTnI and CK-MB levels in the DN group at both the 6th and 24th postoperative hours (Figure 3). However, no correlation was found between the XC and any cardiac marker levels in either group.
Secondary outcomes
Intraoperative characteristics
Intraoperative characteristics, including details on bypass and cardioplegia, are summarised in Table II. The method of cardioplegia delivery was consistent across both groups. However, both the initial and total cardioplegia doses were significantly higher in the HTK group (p < 0.001). The times for CPB and XC were comparable between the groups. A significant difference in reperfusion time was observed, with longer time in the HTK group (p = 0.001).
Table II
Intraoperative data
| Characteristic | DN (n = 50) | HTK (n = 50) | P-value |
|---|---|---|---|
| Cardioplegia | |||
| Way of delivery | Ante: 36% (18/50) | Ante: 24% (12/50) | 0.20c |
| Ante + retro: 60% (30/50) | Ante + retro: 76% (38/50) | ||
| Retro: 4% (2/50) | Retro: 0% (0/50) | ||
| First dose [ml] | 1000 (900–2000) [N = 50] | 1875 (1300–2800) [N = 50] | < 0.001a |
| Second dose [ml] | 450 (400–900) [N = 4] | 500 (500–1300) [N = 3] | 0.35a |
| Total volume of cardioplegia [ml] | 1000 (1000–2000) [N = 50] | 1900 (1300–3900) [N = 50] | < 0.001a |
| Bypass data | |||
| Duration of CPB [min] | 100.5 (75–160) [N = 50] | 101 (72–179) [N = 50] | 0.52a |
| Duration of XC [min] | 72 (50–118) [N = 50] | 74.5 (50–144) [N = 50] | 0.82a |
| Duration of reperfusion [min] | 17 (7–34) [N = 50] | 20 (10–32) [N = 50] | 0.001a |
| Core temperature on XC [°C] | 32 (30–36) [N = 50] | 32 (28–36) [N = 50] | 0.13a |
| Cardiac rhythm | |||
| VF after removing the XC | 20% (10/50) | 68% (34/50) | < 0.001c |
| Need for defibrillation | 18% (9/50) | 64% (32/50) | < 0.001c |
| Intraoperative RBC transfusion | 0 (0–4) [N = 50] | 0 (0–3) [N = 50] | 0.39a |
Ventricular fibrillation (VF) occurred after the removal of the cross-clamp in 10 (20%) patients in the DN group and 34 (68%) patients in the HTK group (p < 0.001). In the HTK group, defibrillation was required in 32 (64%) patients, while 2 patients experienced spontaneous return to sinus rhythm. In the DN group, 1 patient returned to sinus rhythm spontaneously, and the remaining patients required defibrillation.
Intraoperative arterial blood gases and electrolytes
The blood gas test results were similar at the beginning of the operation, except for calcium (Ca²+) levels (Table III). During the peak of haemodilution on CPB, significant differences were observed in pH, pCO2, [HCO3 –], and base excess (BE), indicating more pronounced metabolic acidosis associated with greater haemodilution in the HTK group compared to the DN group. Specifically, haemoglobin (Hb) levels were 8 ±0.95 g/dl in the DN group versus 7.09 ±0.83 g/dl in the HTK group (p < 0.001), and haematocrit (Hct) levels were 24.6% (range: 19–30.2) for DN compared to 22.45% (range: 13.6–43.5) for HTK (p < 0.001). At the time of exact measurement, lactate levels were higher in the DN group, with values of 0.9 mmol/l (range: 0.4–1.8) for DN and 0.7 mmol/l (range: 0.4–2) for HTK (p = 0.003). After the completion of CPB, blood gas normalisation was observed, although a persistent difference remained between the bicarbonate and BE levels. Additionally, [K+] and [Na+] were significantly higher in the DN group during the peak haemodilution. After cessation of CPB, [K+] decreased, while [Na+] increased in the DN group.
Table III
Intraoperative blood gas results
| Characteristic | Before CPB | Peak haemodilution | After CPB | ||||||
|---|---|---|---|---|---|---|---|---|---|
| DN (n = 50) | HTK (n = 50) | P-value | DN (n = 50) | HTK (n = 50) | P-value | DN (n = 50) | HTK (n = 50) | P-value | |
| pH | 7.39 (0.04) [N = 50] | 7.39 (0.04) [N = 50] | 0.43b | 7.4 (0.05) [N = 50] | 7.32 (0.04) [N = 50] | < 0.001b | 7.36 (7.29–7.5) [N = 50] | 7.35 (7.18–7.45) [N = 50] | 0.07a |
| pO2 | 137.5 (53.7–492) [N = 48] | 136.5 (65.7–368) [N =50] | 0.82a | 176 (86.6–391) [N = 48] | 204 (88.2–313) [N = 47] | 0.43a | 128.5 (74.5–250) [N = 50] | 128 (69.2–454) [N = 50] | 0.89a |
| [pCO2 –] | 41.96 (5.15) [N = 50] | 40.6 (4.52) [N = 50] | 0.16b | 38.75 (31.4–52.9) [N = 50] | 41.05 (32.5–54) [N = 50] | 0.0113a | 39.75 (5.12) [N = 50] | 40.03 (5.72) [N = 50] | 0.80b |
| [HCO3 –] | 24.85 (18.1–32.2) [N = 50] | 24.3 (21.1–29.3) [N = 50] | 0.22a | 23.83 (1.61) [N = 50] | 21.11 (2.09) [N = 50] | < 0.001b | 22.6 (19.5–29.7) [N = 50] | 21.55 (16.9–26.6) [N = 50] | 0.01a |
| Base excess | 0.75 (–6.9–6.5) [N = 50] | –0.15 (–2.9–5.3) [N = 50] | 0.28a | –0.33 (1.94) [N = 50] | –3.97 (2.43) [N = 50] | < 0.001b | –2.2 (–5.1–4.1) [N = 50] | –3.1 (–10.6–3.5) [N = 50] | 0.008a |
| SpO2 | 98.3 (84.7–99.8) [N = 50] | 98.65 (90–99.6) [N = 50] | 0.83a | 99.05 (95.7–100) [N = 50] | 99.05 (94.4–99.9) [N = 50] | 0.70a | 98.5 (92.8–99.8) [N = 50] | 98.25 (88.8–99.6) [N = 50] | 0.57a |
| Hemoglobin | 12.8 (8.7–15.9) [N = 50] | 12.5 (6.1–15.3) [N = 50] | 0.20a | 8 (0.95) [N = 50] | 7.09 (0.83) [N = 50] | < 0.001b | 10.04 (1.1) [N = 50] | 10.06 (1) [N = 50] | 0.89b |
| Hematocrit | 39.2 (26.9–48.7) [N = 49] | 38.8 (29.3–46.8) [N = 48] | 0.38a | 24.6 (19–30.2) [N = 49] | 22.45 (13.6–43.5) [N = 48] | < 0.001a | 31.02 (3.3) [N = 49] | 30.99 (3.21) [N = 48] | 0.95b |
| [K+] | 3.8 (3.2–5.2) [N = 50] | 3.8 (3–4.3) [N = 50] | 0.27a | 4.7 (3.6–6.1) [N = 50] | 4.4 (3.9–6.3) [N = 50] | < 0.001a | 4.2 (3.2–5.6) [N = 50] | 4.4 (3.6–6.3) [N = 50] | 0.007a |
| [Na+] | 141 (130–146) [N = 50] | 142 (139–146) [N = 50] | 0.12a | 137 (127–141) [N = 50] | 131 (118–156) [N = 50] | < 0.001a | 140 (132–145) [N = 50] | 138 (131–146) [N = 50] | < 0.001a |
| [Ca2+] | 1.21 (1.09–1.31) [N = 50] | 1.18 (1.06–1.4) [N = 50] | 0.0115a | 1.06 (0.94–1.26) [N = 50] | 1.04 (0.48–1.17) [N = 50] | 0.06a | 1.11 (0.13) [N = 50] | 1.11 (0.1) [N = 50] | 0.86b |
| Lactate | 0.8 (0.4–1.8) [N = 50] | 0.8 (0.4–1.4) [N = 50] | 0.46a | 0.9 (0.4–1.8) [N = 50] | 0.7 (0.4–2) [N = 50] | 0.003a | 1.15 (0.5–2.1) [N = 50] | 1.1 (0.4–3.3) [N = 50] | 0.32a |
| Glucose | 107.5 (75–318) [N = 50] | 101.5 (74–161) [N = 50] | 0.16a | 118.5 (89–184) [N = 50] | 113 (75–205) [N = 50] | 0.14a | 158.64 (21.54) [N = 50] | 159.38 (26.69) [N = 50] | 0.88b |
Postoperative data
There were no significant differences in pharmacological circulatory support during the postoperative period, as shown in VIS (Table IV). The incidence of postoperative complications, such as new AF, pericardial drainage, resternotomy, AKI, TIA, stroke, and in-hospital mortality, was similar between the groups. Additionally, the number of transfused blood products was comparable. Mechanical ventilation duration, ICU length of stay, overall hospital length of stay, and discharge direction (home or medical facility) were also similar in both groups.
Table IV
Postoperative data
| Characteristic | DN (n = 50) | HTK (n = 50) | P-value |
|---|---|---|---|
| VIS | |||
| 6 h | 1 (0–106) [N = 49] | 1 (0–2915) [N = 48] | 0.76a |
| 24 h | 0 (0–114) [N = 49] | 0 (0–2133) [N = 47] | 0.33a |
| 48 h | 0 (0–12) [N = 49] | 0 (0–2130) [N = 48] | 0.47a |
| Complications | |||
| New pacemaker | 6% (3/50) | 2.17% (1/46) | 0.62c |
| New AF | 42% (21/50) | 36% (18/50) | 0.68c |
| Pericardial drainage | 4% (2/50) | 2% (1/50) | > 0.99c |
| Resternotomy | 6% (3/50) | 6% (3/50) | > 0.99c |
| Stroke | 0% (0/50) | 0% (0/50) | > 0.99c |
| TIA | 0% (0/50) | 0% (0/50) | > 0.99c |
| AKI (any stage) | 10% (5/50) | 14% (7/50) | 0.76c |
| In-hospital death | 0% (0/50) | 0% (0/50) | > 0.99c |
| RBC transfusions | 26% (13/50) | 18% (9/50) | 0.47c |
| MV time [h] | 5.92 (1.67-28.5) [N = 43] | 6.67 (1.45–339.92) [N = 46] | 0.41a |
| ICU length of stay | 1 (1-7) [N = 50] | 1 (1–15) [N = 50] | 0.16a |
| Hospital length of stay | 6 (5-37) [N = 50] | 6 (6–20) [N = 50] | 0.34a |
| Discharge direction | hospital 14% (7/50) | hospital 14% (7/50) | > 0.99c |
| Postoperative laboratory results | |||
| Creatinine | 0.74 (0.49–2.41) [N = 50] | 0.74 (0.5–2.14) [N = 50] | 0.52a |
| Creatinine max | 0.92 (0.57–3.13) [N = 46] | 0.91 (0.64–4.31) [N = 43] | 0.37a |
| CRP | 69.89 (5.61–176.74) [N = 49] | 76.47 (8.48–226.83) [N = 50] | 0.77a |
| CRP max | 130.54 (52.52) [N = 50] | 128.26 (60.71) [N = 50] | 0.84b |
| [K+] | 4.22 (0.31) [N = 49] | 4.11 (0.31) [N = 50] | 0.09b |
| [Na+] | 140 (134–145) [N = 49] | 141 (135–149) [N = 50] | 0.07a |
| Hb | 9.99 (0.82) [N = 50] | 10.03 (1.15) [N = 50] | 0.81b |
| Hct | 29.76 (2.7) [N = 50] | 30.06 (3.01) [N = 50] | 0.60b |
| White blood cells | 6.94 (4.23–14) [N = 50] | 7.85 (3.96–23.03) [N = 50] | 0.0196a |
| Platelets | 199 (95–442) [N = 50] | 213 (67–383) [N = 50] | 0.41a |
Discussion
Our study indicates that both DN and HTK cardioplegic solutions provide comparable levels of cardioprotection and in-hospital outcomes. We found no significant differences in CK-MB and hsTnI levels, which is consistent with findings from other studies [12–14]. Our results showed similar values between the groups at all time points, with the highest levels recorded at 6 hours postoperatively, reflecting the typical pattern of elevation in these markers following ischaemia.
A study conducted by Lee [15] indicated lower peak CK-MB and hsTnI levels in the DN group. They also found a correlation of peak CK-MB and hsTnI levels with ischaemic time, noting a crossover point at 100 minutes of cardiac ischaemia. This suggests that HTK may be more beneficial for XC times longer than 100 minutes. In our database, we identified 12 patients with XC times exceeding 100 minutes (7 in the HTK group and 5 in the DN group) but found no relationship between ischaemia markers and XC time.
Additionally, the number of VF cases requiring defibrillation was significantly higher in the HTK group. This may indicate worse protection and greater disturbances in cardiac cell homeostasis. VF following cardioplegic arrest is a sign of intracellular calcium accumulation, which is the primary mechanism behind ischaemia/reperfusion injury [16].
The content of lidocaine, a well-known antiarrhythmic drug, may contribute to the lower number of VF episodes observed in the DN group. A study by Duan et al. reported similar findings, noting that the number of spontaneous defibrillations was significantly higher in the DN group compared to the HTK group [13]. This effect was even more pronounced in studies comparing DN with CBC [2, 3, 17, 18].
The cardioplegia doses, calculated using a specific method, differ between the DN and HTK groups. We showed that the HTK doses were significantly higher for both the initial and total cardioplegia volumes. The increased volume of cardioplegia raises concerns about haemodilution, which significantly affects Hb and Hct levels during CPB. However, these differences are typically balanced by the actions of the perfusionist and anaesthesiologist later on. Additionally, we found no significant differences in blood product transfusions, which is consistent with other studies [12–15].
The HTK solution also significantly affects systemic ion concentrations. In the HTK group, sodium levels were significantly lower than in the DN group, with levels falling below the normal range in 80% of cases compared to only 12% in the DN group during peak haemodilution. However, after the cessation of CPB, ion levels tended to return to almost normal ranges.
Based on our results, the HTK solution alters the acid-base balance during CPB, leading to increased systemic blood acidity. Before CPB, 12% of patients receiving HTK had a pH below 7.35. During the peak haemodilution, this percentage rose dramatically to 74%, whereas it remained constant at 18% for those receiving DN treatment at both time points. Normal pCO2 levels combined with lowered [HCO3 –] indicate the presence of uncompensated metabolic acidosis. Although lactate levels during CPB were significantly higher in the DN group, values for both groups remained within the normal range. The metabolic acidosis observed after HTK administration is likely dilutional [19, 20], which can lead to systemic vasodilation and catecholamine resistance. This effect is typically transient and generally compensated by various counterbalancing mechanisms. Mehrebanian et al. also reported lower [HCO3 –] concentrations in the HTK group, but no significant differences in pH values [12]. Furthermore, a study by Sanetra et al. [4] comparing DN with CBC found that pH and [Na+] were significantly lower in the DN group; however, these differences were not clinically significant.
Reperfusion time, defined as the period between the removal of the XC and weaning from CPB, reflects the duration required for the heart to resume functioning under full load. A shorter reperfusion time in the DN group may suggest easier recovery of heart function, indicating better cardioprotection. There are no specific guidelines dictating the optimal duration of reperfusion. The decision to wean from CPB is based on the normalisation of the ECG, deep core temperature, and laboratory results. Our findings demonstrated a positive correlation between reperfusion time and hsTnI and CK-MB levels in the DN group at 6th and 24th hours postoperatively. This raises several questions: Did the ischaemic injury cause the longer reperfusion time, or did the extended reperfusion time lead to increased reactive oxygen species (ROS) release, resulting in greater cardiac injury? Additionally, why is this correlation observed only in the DN group, given that the reperfusion duration rules were identical for both groups? Could the characteristics of the DN group have influenced this outcome?
The rising popularity of minimally invasive procedures is propelling the use of “single-dose” cardioplegia solutions. Compared with multidose CBC, “single-dose” solutions save time and result in significantly reduced CPB and XC times [5–7]. In our study, the CPB and XC times were comparable between the groups, consistent with other studies comparing DN and HTK [12, 13, 15].
Overall, the type of cardioplegia does not appear to affect the postoperative period in terms of complications or the need for pharmacological circulatory support, corroborating findings from another study [12–15].
This was a single-centre study with a limited sample size, which restricts our ability to draw conclusions about rare postoperative complications or the clinical significance of changes in homeostasis during CPB.
Conclusions
Both types of cardioplegia provide similar levels of cardioprotection, as indicated by postoperative cardiac enzyme concentrations, specifically hsTnI and CK-MB. However, the higher incidence of VF in the HTK group may suggest intracellular calcium accumulation. There were also notable differences in acid-base balance, with the HTK group exhibiting higher systemic acidity. Additionally, significant variations in [Na+] and [K+] concentrations occurred during CPB. However, these changes are typically managed through standard interventions by the end of the surgery. The differences noted are considered irrelevant in the typical management of an AVR patient. Nevertheless, the impact at the intracellular level remains unclear, suggesting that further biochemical studies are needed to understand cardioprotection better and develop an optimal cardioplegic solution.