Purpose
Brachytherapy plays an essential role in the treatment of locally advanced cervical cancer [1, 2]. Three-dimensional image-guided adaptive brachytherapy (IGABT) based on computed tomography (CT) or magnetic resonance imaging (MRI) has been introduced into clinical practice worldwide, as it conforms dose distribution to target volume while sparing organs at risk (OARs) [3-10]. While MRI offers superior tissue contrast for target contouring, CT remains the most widely used modality worldwide due to its availability, lower cost, and well-established workflow. Although less effective in identifying parametrial invasion, CT provides clear visualization of adjacent OARs and enables direct use for dose calculation, making it a practical choice for IGABT in many centers [3, 5, 7, 11-14].
Dosimetric characteristics of brachytherapy, including high fractional dose and steep dose gradient, render it highly sensitive to geometric uncertainties. Even minor deviations in source position can mimic clinically significant dose variations for target volumes and OARs [15-18]. Within the total clinical uncertainty framework for IGABT [19], imaging-related factors constitute a substantial component, where applicator reconstruction uncertainty is particularly crucial as it directly determines the spatial relationship between the prescribed dose distribution and patient anatomy. Accurate reconstruction, with correct identification of the applicator tip (defining the first dwell position) and true representation of the source path, is therefore essential for IGABT [15].
Currently, accurate applicator reconstruction methods include semi-automated library-based techniques and, more recently developed, automatic methods based on digitization algorithms or predominantly artificial intelligence (AI) training [20], with both achieving sub-millimeter accuracy in controlled settings [21-25]. However, library-based methods are limited to pre-modeled applicators, and require manual alignment of the applicator model with CT image. This alignment process is highly dependent on image quality, particularly the spatial resolution needed to accurately identify the applicator tip in the superior-inferior direction, a resolution directly determined by CT slice thickness [26, 27]. Although promising, automatic methods are not universally available in all centers. Moreover, the accuracy of AI models may vary depending on slice thickness of images used for training, as thinner CT slices are associated with lower uncertainty in AI-based applicator reconstruction [21, 22, 28]. However, acquiring thinner slices would degrade a low-contrast resolution of images due to amplified noise, substantially increasing the contouring workload for physicians. Thus, balancing reconstruction accuracy with clinical practicality remains an ongoing challenge.
Systematically investigating the influence of slice thickness on dose delivery in a real patient cohort and thereby defining an optimal trade-off, has emerged as a matter of clinical significance. Therefore, this study aimed to evaluate the impact of varying CT slice thickness on applicator reconstruction accuracy for stainless steel tandem-ovoid applicators in cervical cancer brachytherapy, to assess the subsequent dosimetric consequences for target volumes and OARs, and to propose a clinically feasible CT reconstruction protocol that minimizes these uncertainties without disrupting clinical workflow.
Material and methods
Patients
Seventeen patients with locally advanced cervical cancer, who underwent CT-based high-dose-rate (HDR) brachytherapy were retrospectively enrolled in this study between November 2023 and March 2024. Disease stages included IIA (n = 5), IIB (n = 5), IIIA (n = 4), IIIB (n = 2), and IVA (n = 1). Median patient age was 54 years (range, 28-74 years). All patients received external beam radiotherapy (EBRT) followed by intracavitary brachytherapy. EBRT was delivered using volumetric modulated arc therapy with a median dose of 50.4 Gy (range, 48.0-50.4 Gy). Brachytherapy was started three weeks after EBRT initiation, with a median total treatment duration of 51 days (range, 40-83 days). Stainless steel tandem-ovoid applicators were used for 192Ir HDR brachytherapy, with tandem angles of 30° (n = 11) or 45° (n = 6). Both ovoids were capped with 20 mm polyether-ether-ketone (PEEK) caps without shielding.
CT imaging and treatment planning
Images were acquired by a 16-slice CT simulator (Discovery CT, GE Healthcare, Wauwatosa, WI, USA) with applicators in situ; CT scanning protocol was 120 kV and 250 mA. Images with a 2.50 mm slice thickness (standard for our center) were reconstructed and transferred to a treatment planning system (Eclipse, version 15.6, Varian Medical Systems, Palo Alto, CA, USA) for target volumes and OARs delineation. High-risk clinical target volumes (HR-CTVs) were contoured by radiation oncologists, integrating information from gynecologic examinations, pre-treatment T2-weighted MRI, and the most recent MRI scans. HR-CTV encompassed the entire cervix and presumed extra-cervical extensions into the parametrium, uterus, and vagina. Outer walls of OARs, including the bladder, rectum, and sigmoid colon, were contoured. A prescription dose of 6.0 Gy per fraction was applied to HR-CTV. Ten patients received four fractions, and seven patients received five fractions, ensuring that the total equivalent dose in 2 Gy fractions (EQD2) from EBRT and brachytherapy combined for HR-CTV D90 was ≥ 85 Gy.
Applicator reconstruction was performed using a standardized library-based method by an experienced medical physicist. The image was rotated to display the applicator central axis in sagittal and coronal planes. The applicator tip was then located on the transverse image, and the corresponding applicator model was selected from the library. The model was manually moved and rotated to align the applicator position in transverse, sagittal, and coronal planes. Uncertainties in applicator definition, such as selecting the exact tip location or the curvature of tandem on thick slices, directly propagated to the reconstructed source positions, affecting dwell position determination and the resulting dose distribution. Following reconstruction, source dwell positions and times were optimized with the TG-43 dose calculation algorithm [29]. Dose constraints for OARs were applied according to departmental protocols, balancing target coverage with OARs sparing. The final plan was reviewed and approved by a second qualified physicist.
Image re-slicing and experimental plan generation
To investigate the impact of slice thickness, three additional image sets were retrospectively reconstructed from raw CT data for each patient at thicknesses of 0.625 mm, 1.25 mm, and 5.00 mm. To isolate reconstruction uncertainties, outer walls of HR-CTVs and OARs were contoured solely on the original 2.50 mm images, and then rigidly registered and duplicated to the 0.625 mm, 1.25 mm, and 5.00 mm image sets, ensuring identical volumes across all thicknesses.
For each experimental image set, the same physicist performed applicator reconstruction by visually identifying the applicator tip and geometry based on its appearance in the image, following the clinical protocol. Source dwell times from the original plan were then applied to the newly reconstructed applicators, and brachytherapy dose was re-calculated, generating corresponding experimental plans for analysis.
Evaluation parameters
Applicator coordinates and dose-volume metrics were evaluated across all slice thicknesses. Coordinate parameters included the X (left-right), Y (anterior-posterior), and Z (superior-inferior) coordinates of the first dwell position for each applicator. Dose-volume metrics consisted of D90 for HR-CTV and D2cc (minimum dose to the most exposed 2 cm3 volume) for the bladder, rectum, and sigmoid colon. The 0.625 mm slice thickness plan served as the reference. Applicator displacements and dose deviations at 1.25 mm, 2.50 mm, and 5.00 mm were statistically compared with the 0.625 mm reference. Reconstruction uncertainties were calculated using the following formula:
where X0, Y0, and Z0 represent the X, Y, and Z coordinates of the first dwell position for each applicator in the 0.625 mm slice thickness CT images. X-X0 represents the applicator displacement along X axis.
Statistical analysis
Statistical analyses were performed using SPSS v. 19.0. Normality and homogeneity of variance were assessed using Shapiro-Wilk test and one-way ANOVA, respectively. Paired sample t-tests were employed to compare applicator displacements, reconstruction uncertainties, and dose deviations in brachytherapy plans across slice thicknesses. Mann-Whitney U test was used for sub-group comparisons when the data did not satisfy normality. Pearson correlation analysis was conducted to assess the relationship between applicator displacements and corresponding dose deviations. Applicator displacements with significant correlations were incorporated into a multiple linear regression model to examine their associations with dose deviations. All data were presented as mean ± standard deviation, while p-value ≤ 0.05 indicated statistical significance.
Results
Figure 1 illustrates the variation in applicator appearance with CT slice thickness (window width: 1,000 HU, level 0 HU). At 0.625 mm, the tandem appeared slightly enlarged compared with its physical dimensions (Figure 1A), whereas its overall geometry remained clearly visualized (Figure 1B). As slice thickness increased, particularly when the tandem was angled relative to the scanning plane, its curved segment exhibited a jagged appearance and apparent diameter enlargement (Figure 1C-E). CT value profiles across the inclined segment (45°) revealed apparent diameters of 5.0, 6.0, 9.0, and 12.0 mm for slice thicknesses of 0.625, 1.25, 2.50, and 5.00 mm, respectively, with 66.7%, 100%, 200%, and 300% increases over the true diameter of 3.0 mm.
Fig. 1
The display and reconstruction results of tandem-ovoid applicators at different computed tomography (CT) slice thicknesses. First row: A) Photograph of the tandem and its coronal CT images at B) 0.625 mm, C) 1.25 mm, D) 2.50 mm, E) and 5.00 mm. Second row: F) Photograph of standard ovoids and their coronal CT images at G) 0.625 mm, H) 1.25 mm, I) 2.50 mm, and J) 5.00 mm. Third row: K) Photograph of the ovoids with PEEK cap. Coronal CT images showing reconstruction results at L) 0.625 mm, M) 1.25 mm, N) 2.50 mm, and O) 5.00 mm
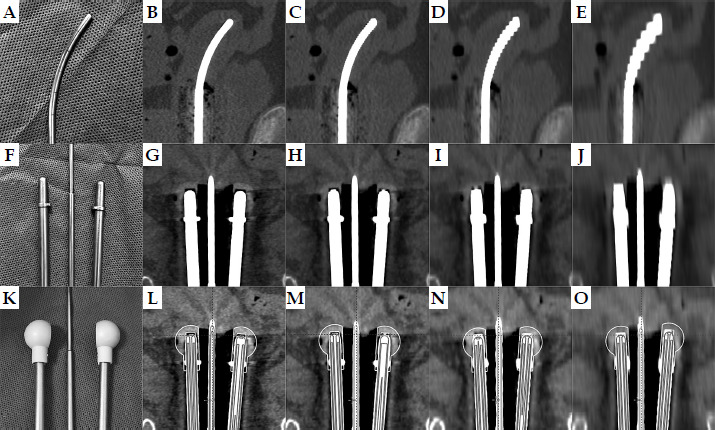
For the ovoids, deformation caused by varying CT slice thickness was mostly pronounced at the tips. At 0.625 mm slice thickness, the rounded ovoid tip was clearly defined, closely matching its true geometry (Figure 1F), with a visible low-density gap between the tip and the surrounding plastic cap (Figure 1G). As slice thickness increased, the tip appeared progressively squared, the low-attenuation region diminished, and the ovoid appeared artificially elongated on coronal images. At 1.25 mm slice thickness, tip deformation remained tolerable (Figure 1H). However, at 2.50 mm (Figure 1I) and 5.00 mm slice thicknesses (Figure 1J), the low-attenuation region could no longer be accurately identified, leading to substantial inaccuracies in the ovoid placement (Figures 1N-O).
All the X, Y, and Z coordinates of tandem-ovoid applicators reconstructed on CT images with varying slice thicknesses exhibited statistical normality and homogeneity. Relative to the 0.625 mm reference, displacements at 1.25 mm, 2.50 mm, and 5.00 mm predominantly occurred along the Z-axis (superior-inferior) for all applicators (Table 1), with significance for the tandem (p = 0.046) and both ovoids (p < 0.001). Displacement magnitudes increased with slice thickness. For the left ovoid, mean displacement increased from 0.25 ±0.37 mm (1.25 mm) to 0.78 ±0.69 mm (2.50 mm) and 2.72 ±1.51 mm (5.00 mm), with maximum displacement rising from 1.20 mm to 1.90 mm and 4.90 mm. The right ovoid showed a similar trend, with a slightly larger mean deviation of 3.21 ±1.35 mm at 5.00 mm.
Table 1
Applicators displacements and reconstruction uncertainties (in mm) for 1.25 mm, 2.50 mm, and 5.00 mm slice thickness images relative to the 0.625 mm reference
Notably, applicator reconstruction uncertainties, combining all three directional displacements, exceeded any single-direction displacement. In the 5.00 mm slice thickness images, mean uncertainties for the tandem, right ovoid, and left ovoid were 1.99 ±0.94 mm, 3.28 ±1.35 mm, and 2.92 ±1.36 mm, with maximum uncertainties of 3.67 mm, 4.91 mm, and 4.92 mm, respectively. These differences were statistically significant (p ≤ 0.001).
All dose-volume metrics in varying CT slice thickness groups met statistical normality and homogeneity. Thicker CT slices resulted in higher HR-CTV D90 coverage (Table 2). Compared with the 0.625 mm reference, HR-CTV D90 increased by 1.4% (0.09/6.30), 2.86% (0.18/6.30), and 11.11% (0.70/6.30) for the 1.25 mm, 2.50 mm, and 5.00 mm groups, respectively, with corresponding maximum individual increases of 6.25% (0.34/5.44), 7.06% (0.49/6.94), and 25.55% (1.39/5.44). In particular, the probability of dose deviations exceeding 5% in individual patients was 23.5% (4/17) for the 2.50 mm groups. While for the 5.00 mm groups, this probability increased dramatically to 88.2% (15/17), with 58.8% (10/17) of patients demonstrating dose deviations exceeding 10%. All pairwise comparisons for HR-CTV D90 were significant (p < 0.05), except between 1.25 mm and 2.50 mm (Table 3).
Table 2
Dose distribution for target volumes and OARs in brachytherapy plans based on CT images with different slice thicknesses (mean: 95% CI in Gy)
Conversely, rectal D2cc demonstrated an opposing trend: thicker CT slice thickness resulted in lower dose coverage (Table 2). The average reductions in rectal D2cc for the 1.25 mm, 2.50 mm, and 5.00 mm groups were 0.23% (0.01/4.29), 1.40% (0.06/4.29), and 4.43% (0.19/4.29), respectively. In individual patients, maximum reductions ranged from 2.74% (0.11/4.02) to 6.67% (0.31/4.65) and 8.39% (0.39/4.65). Pairwise comparisons for rectal D2cc were significant (p ≤ 0.05) for all groups, except between 0.625 mm and 1.25 mm (Table 3). For OARs, such as the bladder and sigmoid colon, no statistically significant differences were observed in their D2cc across varying CT slice thickness groups (p > 0.05).
Table 3
Comparison of dose-volume metrics (HR-CTV D90, bladder D2cc, rectum D2cc, sigmoid colon D2cc) in brachytherapy plans based on CT images at 0.625 mm, 1.25 mm, 2.50 mm, and 5.0 mm slice thicknesses
To assess whether tandem angle influenced dose deviations induced by CT slice thickness, a sub-group analysis was performed comparing 30° and 45° tandem groups. As shown in Supplementary Table 1, no statistically significant differences were observed between two angle groups for any dosimetric parameter (all p > 0.05), indicating that the impact of slice thickness on dose deviations was independent of tandem angle.
Table 4 demonstrates that dose deviations of target volumes and OARs correlated significantly with at least one displacement of tandem-ovoid applicators, and ovoid displacements were the most strongly correlated. HR-CTV D90, rectal D2cc, sigmoid colon D2cc, and bladder D2cc, were significantly correlated with Z-axis displacements of the right and left ovoids (p ≤ 0.05), except for bladder D2cc to the left ovoid.
Table 4
P-values in correlation analysis between dose deviations (cGy) of target volumes (HR-CTV D90) and OARs (bladder D2cc, rectum D2cc, sigmoid colon D2cc) and applicator displacements (mm)
Multivariate linear regression analysis between dose deviations (cGy) and significant applicator displacements (mm) revealed that HR-CTV D90 dose deviations were found predominantly influenced by Z-axis displacements of both ovoids in multivariate linear regression analysis, accounting for 84.4% of the variation (Figure 2A). Specifically, a 1 mm Z-axis displacement of the left ovoid increased HR-CTV D90 by 2.47% (15.56/630), while a 1 mm displacement of the right ovoid increased it by 1.23% (7.77/630).
Fig. 2
Multivariate linear regression analysis between dose deviations (cGy) for A) HR-CTV D90, B) bladder D2cc, C) rectum D2cc, D) sigmoid colon D2cc, and applicator displacements (mm)
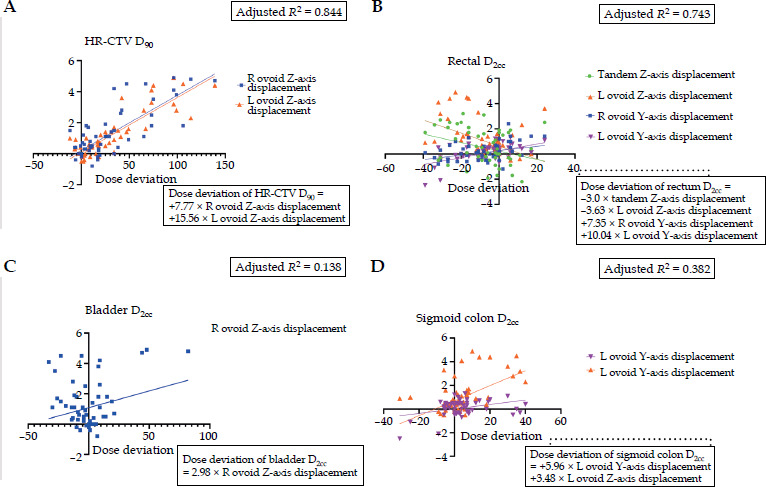
For OARs, rectal D2cc dose deviations were primarily influenced by Z-axis displacements of the tandem and left ovoid as well as Y-axis displacements of both ovoids, accounting for 74.3% of the variation (Figure 2B). Y-axis displacements of the right and left ovoids were the most significant factors, with each 1 mm displacement increasing rectal D2cc by 1.71% (7.35/429) and 2.34% (10.04/429), respectively. For the bladder, only Z-axis displacement of the right ovoid significantly affected D2cc dose deviations (Figure 2C). For the sigmoid colon, both Y-axis and Z-axis displacements of the left ovoid contributed to its D2cc dose deviations, with each 1 mm displacement increasing the dose by 5.96 cGy (Y-axis) and 3.48 cGy (Z-axis) (Figure 2D).
Discussion
In image-guided adaptive brachytherapy, the total uncertainty is affected by source strength, treatment planning, heterogeneity effects, dose delivery, and imaging [19]. Among these, imaging-induced applicator reconstruction uncertainties are the inevitable source of dose deviations for target volumes and OARs [15, 17, 18]. Previous studies have demonstrated the magnitude of this effect, showing that mispositioning of vaginal sources by 3 mm in the anterior-posterior direction can increase bladder and rectum doses by 20% in individual patients [15]. Similarly, ≥ 5 mm inferior displacements during patient transportation may reduce HR-CTV dose and increase rectal D2cc [17]. For ring applicators, 1 mm anterior-posterior reconstruction uncertainties can cause average dose deviations of up to 7% for rectum and bladder D2cc as well as 5% for HR-CTV D90 in individual cases [18]. Therefore, accurate applicator reconstruction is critical for effective brachytherapy.
In CT-guided 3D brachytherapy, applicator reconstruction accuracy is inherently linked to image resolution. Accurate identification of the applicator tip, a key component of reconstruction that defines the first dwell position, depends largely on CT spatial resolution in the superior-inferior direction [30]. This resolution is directly governed by slice thickness through partial volume effects (PVE). PVE occurs when a single voxel contains a mixture of materials with different attenuation coefficients, leading to averaging of CT values and degradation of spatial resolution [26]. Despite its fundamental importance, the influence of CT slice thickness on reconstruction accuracy and subsequent dosimetric outcomes, has not been systematically evaluated in a patient cohort. Therefore, this study addresses that gap by providing a detailed quantitative analysis of how slice thickness-induced reconstruction uncertainties propagate to dosimetric parameters in cervical cancer brachytherapy using stainless steel tandem-ovoid applicators.
In our study, the stark contrast between high-density (up to 3,071 HU) stainless steel applicators and surrounding soft tissue (< 100 HU), made PVE particularly pronounced. As slice thickness increased, this effect manifested as artificial “blooming” of the applicator, causing it to appear thicker and longer than its true physical dimensions. Our observations revealed that this deformation was especially challenging for curved structures, including the tandem, particularly when its axis was oblique to the scanning plane. At large curvatures (e.g., 45 degrees), the tandem’s diameter on transverse planes could appear doubled at thickness of ≥ 2.50 mm (thicknesses still commonly used clinically), complicating identification of the true source path. Fortunately, the use of a curvature-matching library method in our study substantially reduced reconstruction uncertainties along tandem’s superior-inferior axis (1.14 ±1.64 mm at 5.0 mm slices). However, for ovoids (straight-shaped components without inherent curvature to guide reconstruction), larger uncertainties (left ovoid: 2.72 ±1.51 mm, right ovoid: 3.21 ±1.35 mm at 5.0 mm slices) were observed, with maximum displacements reaching 4.90 mm. This implies that even geometrically simple components are susceptible to significant dose deviations when imaging parameters are sub-optimal.
These reconstruction uncertainty were translated directly into systematic dose deviations. Our multivariate analysis confirms that HR-CTV D90, a critical parameter for local control in cervical cancer brachytherapy [9, 14, 31, 32], was substantially affected. The probability of dose deviations exceeding 5% reached 88.2% (15/17) for the 5.0 mm slice thickness group, with 58.8% (10/17) exceeding 10%. For OARs, although dose deviations were smaller in magnitude, they remained clinically relevant. For rectal D2cc, a key predictor of radiation proctitis [33, 34], the probability of dose deviations exceeding 5% reached 52.9% (9/17) in the 5.0 mm group.
Ovoid reconstruction uncertainty emerged as the dominant contributor to these dose deviations. For HR-CTV D90, each 1 mm superior-inferior displacement of the right and left ovoids increased D90 by 1.23% and 2.47%, respectively. Thicker slices (2.50 mm and 5.00 mm) resulted in average HR-CTV D90 overestimations of 2.86% and 11.11%, with maximum increases of 7.06% and 25.55% in individual patients. Conversely, systematic underestimation of rectal D2cc occurred with 2.50 mm slices (average: 1.40%, maximum: 6.67%) and 5.0 mm slices (average: 4.43%, maximum: 8.39%), along ovoids’ anterior-posterior axis.
The substantial impact of ovoid reconstruction on HR-CTV D90 arises because the cervix as the primary component of HR-CTV, receives dose predominantly from the first few ovoid dwell positions. To achieve adequate target coverage, these dwell positions often require prolonged dwell times. Consequently, any reconstruction inaccuracy in ovoid position is amplified into clinically significant dose variations. For instance, in our study, although the left ovoid exhibited a smaller reconstruction error than the right ovoid at 5.0 mm slice thickness (2.92 ±1.36 mm vs. 3.28 ±1.35 mm), it demonstrated a greater impact on both HR-CTV D90 and rectal D2cc. This discrepancy can be attributed to the longer nominal dwell times for the first source position in the left ovoid (51.6 ±11 s) compared with the right ovoid (47.3 ±10.5 s) in our cohort. This meant that, under identical reconstruction uncertainties, longer dwell times amplified the resulting dose deviations.
Based on these findings, the thinnest available slice thickness (e.g., 0.625 mm) is appropriate for applicator reconstruction. With this approach, maximum reconstruction errors are bounded by the slice thickness itself, enabling sub-millimeter accuracy. However, we acknowledge the practical trade-offs, as thinner slices increase image noise and contouring workload. To address this conflict, we propose a practical dual-thickness reconstruction protocol that leverages modern CT capabilities without requiring additional patient scans. From a single standard CT acquisition, two image sets are reconstructed from the raw data: a thin-slice set (e.g., 0.625 mm) for precise applicator reconstruction, and a thick-slice set (e.g., 2.50 mm) for contouring and dose calculation. The thicker set offers better signal-to-noise ratio and acceptable contouring workload, while in line with guidelines for pelvic anatomy delineation (< 3 mm) [35]. The accurately reconstructed applicator from the thin-slice set is then transferred via rigid registration to the thick-slice set for final treatment planning.
This dual-thickness protocol offers several practical advantages. Since both image sets are reconstructed from the same raw CT data, applicator transfer between them is inherently accurate and requires no additional registration. This minimizes reconstruction uncertainty in the superior-inferior axis, reducing it to the sub-millimeter level defined by the thinnest clinically achievable slice thickness. Beyond this geometric precision, the protocol adds minimal workflow burden, it requires no additional reconstruction software, and applicator transfer between image sets takes only seconds. Therefore, it may be broadly applicable to all CT-guided brachytherapy procedures, including those using non-library applicators and potentially complex cases involving interstitial needles or hybrid applicators.
However, our study has several limitations to address. First, organ contours may vary with CT slice thickness in clinical practice. We intentionally kept contours identical to isolate reconstruction uncertainty, while acknowledging that both contouring and reconstruction errors contribute to total dose uncertainty in reality. Second, this analysis was confined to stainless steel tandem-ovoid applicators; the findings may not be directly generalizable to the increasingly popular plastic applicators, which produce fewer artifacts and may be less susceptible to partial volume effects. Third, our cohort did not include patients treated with hybrid intracavitary/interstitial applicators; the current state-of-the-art for large or asymmetric tumors warrants separate investigation. Fourth, our dose calculations used a homogeneous water-equivalent algorithm, which does not account for tissue heterogeneity or shielding/attenuation effects of the high-density applicator material itself. Future studies should therefore investigate the combined impact of contouring and reconstruction uncertainties as well as the use of model-based dose calculation algorithms, to better understand the interplay between imaging parameters, applicator material, and dosimetric outcomes.
Conclusions
CT slice thickness is a critical determinant of applicator reconstruction accuracy in stainless steel tandem-ovoid brachytherapy for cervical cancer. Thicker slice thicknesses can introduce systematic reconstruction uncertainties, which directly propagate to clinically meaningful dose deviations, overestimating HR-CTV D90 by up to 25% and underestimating rectal D2cc by up to 8% for individual patients in 5 mm slice thicknesses. A dual-thickness reconstruction protocol offers a safe and effective solution to mitigate these uncertainties without disrupting clinical workflow in IGABT.