Introduction
Air pollution is defined as contamination of the external (surroundings) and internal (household) environments by any chemical, physical, or biological agent that alters their natural properties. Air pollution affects many organ systems, including the cardiovascular system, causing heart and lung disease, lung cancer, food and skin allergies, chronic obstructive pulmonary disease, asthma, and respiratory infections. A higher incidence of strokes is attributed to involvement of the central nervous system, and it affects the reproductive system and the body’s integument [1].
A total of 99% of the world’s population in 2023 lived in areas where air quality did not meet World Health Organisation guidelines [2]. A report prepared by the European Commission on the impact of air pollution on the human body states that it causes 47,000 deaths in Poland each year, including 36,500 due to PM2.5 particulate matter [3].
Air pollution is a significant public health problem worldwide. Poland has the third most polluted capital city in Europe (after Bulgaria and Cyprus) in terms of average annual PM10 concentration. In 2020, environmental pollution caused 940,000 deaths among children worldwide, including two-thirds under the age of 5 years [4].
Nine out of ten people worldwide breathe polluted air, resulting in approximately 7 million deaths annually. Over 90% of children worldwide breathe polluted air. Over 300 million live in areas with pollution levels six times higher than the norm. Nearly 1.8 million of them die from smog, including 1 in 10 children under the age of 5 years [5, 6].
Air pollutants of global significance include particulate matter (PM), polycyclic aromatic hydrocarbons (PAHs), benzene, ground-level ozone (O3), and other gaseous pollutants such as carbon monoxide (CO2), nitrogen dioxide (NO2), sulphur dioxide (SO2), various heavy metals (lead, arsenic, cadmium), and volatile organic compounds (VOCs). Particulate matter is one of the most harmful pollutants, being a heterogeneous mixture of very small particles and liquid droplets consisting of organic chemicals, acids, metals, and soil or dust particles. Based on their size, they are divided into coarse particles with a diameter of 2.5 to 10 μm (PM10), fine particles with a diameter less than or equal to 2.5 μm (PM2.5), and ultrafine particulate matter (UFPM) with a diameter less than 100 nm (PM0.1), also known as nanoparticles [7]. Currently, UFPM is considered the most abundant particulate matter pollutant in the atmosphere of industrial, urban, and rural areas. By adhering to the skin surface, ambient particulate matter can reduce the epidermal barrier function, thus leading to the development of allergies [8]. The skin penetration of particulate matter depends on its size and shape, as well as the condition of the skin barrier. Nanoparticles larger than 45 nm cannot penetrate the skin. UFPM equal to or smaller than 4 nm can penetrate intact skin [9–11]. Fine and ultrafine particles (PM2.5 and PM0.1) are inhaled in polluted air and can affect lung function. These particles have a large surface area and the ability to adsorb PAHs, allowing them to reach the systemic circulation and deeper layers of the skin [12]. Food allergy (FA) is a specific immune response to specific foods. It is currently a serious public health problem worldwide, affecting 10–15% of the child population. FA is also a common cause of a potentially life-threatening hypersensitivity reaction, often called food anaphylaxis, which typically develops rapidly and can even lead to death. Furthermore, it contributes to increased medical expenses, placing a significant economic burden on patients and society, and it significantly impairs patients’ quality of life, from limited participation in social activities to differential treatment by peers, primarily anxiety and depression [13].
The prevalence of food and skin allergies varies based on many factors, including age, ethnic and geographic differences, access to healthcare, and infant feeding practices. The prevalence of food and skin allergies has increased over the past few decades, with this increase occurring primarily within a single generation [14–16].
Genetic factors have a significant impact on the development of allergic diseases. However, the rapid increase in the prevalence of food and skin allergies can also be attributed to environmental factors, including air pollution [17, 18].
Exposure to environmental factors, including air pollution, throughout life can lead to epigenetic changes that vary significantly depending on the type of air pollution [19]. Human skin and the lungs are the primary target organs affected by the harmful effects of air pollution, contributing significantly to the development of skin and food allergies [20].
The skin, along with the epidermal barrier, protects the body from harmful insults and environmental factors. Environmental factors trigger various skin changes that can damage immune cells, thus disrupting systemic homeostasis. Skin is often exposed to a mixture of air pollutants, the effects of which can vary depending on their properties, intensity, and duration of exposure. Air pollution induces an oxidative stress response in the skin [21]. It can also trigger or exacerbate various skin allergies and skin conditions, such as the following: premature skin aging, skin cancer (melanoma, squamous cell carcinoma [SCC], and basal cell carcinoma [BCC]), inflammatory skin diseases (e.g. atopic dermatitis [AD], airborne contact dermatitis [ABCD], allergic contact dermatitis, and psoriasis), acne, alopecia, including androgenetic alopecia, pigmentation disorders such as vitiligo, melasma, post-inflammatory pigmentation changes, various neurodermatoses, pruritic disorders, etc. [22]. Skin reactions to air pollution lead to the induction of oxidative stress [23]. Air pollutants, especially PAHs and particulate matter, which are highly lipophilic, can significantly disrupt cellular redox homeostasis [24, 25]. Furthermore, oxidative damage to mitochondrial DNA (mtDNA) coupled with dust particulate matter was recorded in maternal and cord blood in women exposed to particulate matter at various intervals during pregnancy, whose children later developed both food and skin allergies [26, 27].
Reports from the Chief Inspectorate of Environmental Protection (GIOŚ) indicate an improvement in air quality in Poland between 2018 and 2023, especially for particulate matter PM10. However, the problem of exceedances of benzo(a)pyrene and PM2.5 particulate matter remains, with low emissions from municipal and residential sectors (home heating) being the main causes. 2023 was the first year in which the permissible concentration level for PM2.5 particulate matter was not exceeded in Phase II, effective from 2020, which sets a maximum value of 20 μg/m3. The entire territory of Poland was classified as Class A, designating areas with pollution levels remaining below the highest threshold, including for substances such as sulphur dioxide, carbon monoxide, benzene, lead, cadmium, and nickel in suspended particulate matter PM10 [28].
Material and methods
In August 2025, data on the incidence of food allergies (K52.2) and skin allergies (L27.2) in children and adolescents aged 0 to 18 years (incidence rate 10,000; total number of individuals diagnosed with these conditions as of 31 December of the given calendar year) were received from the Ministry of Health – Department of Public Health and the Department of Analysis. Data from the Chief Inspectorate of Environmental Protection (GIO) regarding average annual selected atmospheric air concentrations (sulphur dioxide, nitrogen dioxide, benzo[a]pyrene, PM2.5 particulate matter, and PM10 particulate matter) were obtained. These data cover children and adolescents from all over Poland for the period from 2018 to 2024. Statistica 13.6.0.064 (0616) and Pearson correlation coefficients were used to correlate average annual concentrations of selected air pollutants with the incidence of bronchial asthma.
Results
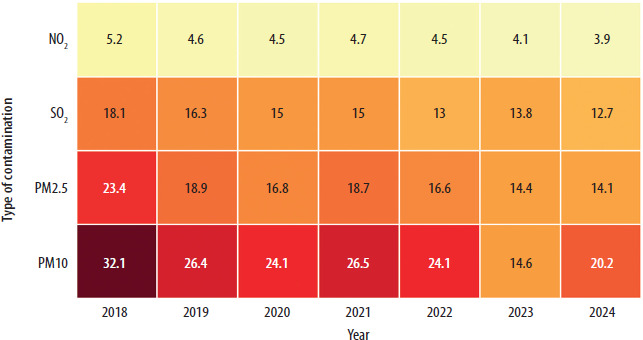
During the analysed period from 2018 to 2024, average annual concentrations of selected air pollutants decreased in Poland (except for 2021, where they increased compared to 2020). For PM10 particulate matter, these concentrations ranged from 32.1 μm3 in 2018 to 20.2 μm3 in 2024. The average annual concentration of PM2.5 particulate matter was 23.4 μm3 in 2018 and 14.1 μm3 in 2024. For sulphur dioxide, these concentrations were 18.1 μm3 in 2018 and 13.8 μm3 in 2014. The average annual concentration of nitrogen dioxide was 5.2 μm3 in 2018 and 3.9 μm3 in 2024 (Figure 1).
FIGURE 1
Heatmaps for average annual concentrations of PM10 and PM2.5 particulate matter, nitrogen dioxide, and sulphur dioxide in Poland from 2018 to 2024.Source: authors’ own study based on data from the Chief Inspectorate of Environmental Protection (GIOŚ)
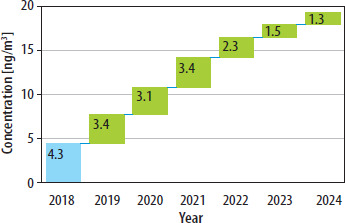
Regarding benzo(a)pyrene, the average annual concentrations of this compound in Poland decreased between 2018 and 2024 (except for 2021, where they increased compared to 2020), reaching 4.3 ng/m3 in 2018 and 1.3 ng/m3 in 2024 (Figure 2).
FIGURE 2
Average annual concentrations of benzo(a)pyrene in Poland in 2018–2024. Source: authors’ own study based on data from the Chief Inspectorate of Environmental Protection (GIOŚ)
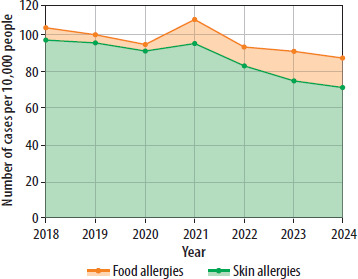
The incidence rate of food and skin allergies among children and adolescents in Poland showed a downward trend over the analysed period (except for 2021, when there was an increase compared to 2020). Analysis of new cases (incidence) in a population of 10,000 children and adolescents of the studied age group is 103.8/10,000 in 2018 and 87.4/10,000 in 2024 for food allergies, and 97.1/10,000 in 2018 and 71.1/10,000 in 2024 for skin allergies (Figure 3).
FIGURE 3
Incidence of food and skin allergies among children and adolescents aged 0–18 years in Poland in the period 2018–2024 (incidence rate 10/000). Source: authors’ own study based on data from the Ministry of Health – Department of Public Health and the Department of Analysis
The distribution of the studied variables was verified using the Shapiro–Wilk test (Table 1). In most cases, no significant deviations from the normal distribution were found (p > 0.05). However, it should be noted that with a small sample size (N = 7), the power of normality tests is limited, and in the case of the Food allergies variable, a significant deviation from normality was observed (p = 0.002).
TABLE 1
Results of the Shapiro–Wilk test for variables related to air pollution and allergy incidence. Source: authors’ own study
Taking these limitations into account, both the parametric Pearson correlation coefficient and the nonparametric Spearman rank correlation coefficient were used in the analysis. This approach allowed for a more reliable assessment of the relationship between air pollution levels and the prevalence of food and skin allergies.
For the food allergies variable, due to a significant deviation from the normal distribution (p = 0.002 in the Shapiro–Wilk test), only the nonparametric Spearman rank correlation coefficient was used in the analysis. The results presented in Table 2 indicate no significant correlations between the concentrations of the analysed air pollutants and the incidence of food allergies. All obtained correlation coefficients fell within the range of R = 0.21–0.23 and did not reach statistical significance (p > 0.05), meaning that no statistically significant associations were found between increased pollutant concentrations and the incidence of food allergies in the study sample.
TABLE 2
Spearman’s rank correlation coefficients between air pollution concentrations and the incidence of food allergies. Source: Authors’ own study
The results presented in Tables 3 and 4 indicate very strong positive relationships between the concentrations of the analysed air pollutants and the incidence of skin allergies. Pearson correlation coefficients showed statistically significant relationships for all studied variables (r = 0.816–0.972; p < 0.05), meaning that an increase in the concentrations of PM10 and PM2.5, benzo(a)pyrene, nitrogen dioxide, and sulphur dioxide was associated with a greater number of cases of skin allergies. The strongest correlation was observed for benzo(a)pyrene (r = 0.972; p = 0.0002) and the weakest for nitrogen dioxide (r = 0.816; p = 0.0251). The results obtained using the Spearman method confirmed this relationship, indicating even higher values of the rank correlation coefficients (R = 0.955–1.00; p < 0.01). The case of nitrogen dioxide is particularly significant, for which an R coefficient of 1.0 was obtained, indicating a perfectly monotonic relationship. In this case, neither a t-statistic nor a p-level of significance was determined, due to the lack of residual variability, which prevents the test from being conducted.
TABLE 3
Pearson correlation coefficients between air pollution indicators and skin allergies. Source: authors’ own study
TABLE 4
Spearman’s rank correlation coefficients between air pollution concentrations and the incidence of skin allergies. Source: Authors’ own study
The difference between the Pearson and Spearman coefficients for nitrogen dioxide results from the different nature of the two measures. Pearson correlation assesses the strength of the linear relationship between variables and is sensitive to small deviations from linearity and uneven spacing between values, which, with very small sample sizes, leads to a lower coefficient value. The Spearman coefficient, on the other hand, is based solely on rank agreement and reflects the monotonicity of the relationship. In the analysed data, the order of years in terms of NO2 concentration was completely consistent with the order of years in terms of the number of skin allergy cases, resulting in an R value of 1.0, even though the relationship was not perfectly linear.
Conclusions and Discussion
The analysis of average annual air quality values has shown an improvement since 2018. Along with the decrease in atmospheric air pollution concentrations, a decrease in the incidence of food and skin allergies among children and adolescents in Poland has also been observed.
Environmental pollution has become a more serious problem in recent years, along with increasingly advanced urbanisation technologies. Air and water pollution is closely linked to the symptoms of food and skin allergies. Due to industrialisation and urban development in many countries, contaminated soil or fine particles in the air can create an even more hazardous environment for humans [29].
Numerous studies conducted in the Netherlands have shown that long-term postnatal exposure to air pollution related to road traffic, including particulate matter with a diameter below 2.5 μm (PM2.5) and nitrogen dioxide (NO2), significantly increased sensitisation to food and skin allergens in 4-year-old children [30]. In recent years, epidemiological studies have shown that air pollution is associated with childhood allergies. A growing body of evidence suggests that early exposure to environmental pollutants, especially air pollution, is a significant factor in the later development of allergic diseases in children [31, 32]. Furthermore, other studies have observed a measurable, statistically significant increase in the risk of exacerbating food and skin allergies following exposure to NO2, SO2, and PM2.5, even at concentrations significantly below European limit values [33]. Similar results were observed in other studies conducted in Brazil [34–36].
The problem of air pollution can therefore be considered one of the most important challenges facing our civilisation. The impact of air pollution on the development of food and skin allergies should be considered in the broader context of exposure. Actions are needed to reduce exposure to air pollution to protect public health, particularly against emissions from both fossil fuel and biomass combustion.