
Introduction
Lung cancer is one of the main causes of cancer-related mortality [1]. Its treatment is highly stage-dependent; hence, accurate assessment of mediastinal lymph node involvement is of utmost importance for the therapeutic decision-making process. According to the current guidelines, preoperative work-up is based on imaging with computed tomography (CT) and positron emission tomography (PET), followed by combined endobronchial ultrasound (EBUS) and endoscopic ultrasound (EUS)-guided fine-needle aspiration biopsy, referred to as combined endobronchial and endoscopic ultrasound (CUS) [2, 3]. There is a large body of evidence showing high sensitivity and negative predictive value (NPV) of CUS for detecting mediastinal lymph node metastasis [4–8]. However, false negative (FN) results of CUS are of concern, because they may cause selection of suboptimal treatment strategies.
Aim
This study aimed to analyze the factors associated with FN CUS results in a large cohort of uniformly treated patients.
Material and methods
This study was conducted in accordance with the principles of the Declaration of Helsinki (as revised in 2013). The study was approved by the Ethical Committee of the Jagiellonian University (118.0043.1.288.2024), where the full protocol is available. We analyzed de-identified data obtained from medical records; therefore, patient consent was not required. This study did not receive any specific grants from funding agencies in the public, commercial, or non-profit sectors.
Clinical questions
This study investigated the risk of FN CUS results in mediastinal staging of lung cancer. Additionally, factors associated with FN results were determined.
Study design
This study adopted a retrospective cohort study design to analyze data from a prospective database.
Study setting
This study was undertaken in Department of Thoracic Surgery, Jagiellonian University Collegium Medicum, John Paul II Hospital, Krakow, Poland.
Patients
Data of consecutive patients with lung cancer who underwent complete resection were extracted from the database. We adopted the following inclusion criteria: 18–90 years of age; clinical stages I–IVA (including only oligometastatic stage IV cases); in all patients, preoperative work-up including PET-CT, EBUS, and EUS; and curative-intent anatomical lung resection. Patients’ data used for analysis included age, sex, body mass index (BMI), tumor histology and grade, lobar location, stage of the disease (assessed using CT, PET and CUS), and maximum standardized uptake values (SUVmax) of the primary tumor and lymph nodes. The reference test was pathological examination of the surgical specimen, which is generally considered the gold standard in lymph node assessment.
Intervention
The PET-CT scan was performed using a Discovery 690 scanner (General Electric Healthcare, Chicago, Illinois, USA). The technique used was described in detail elsewhere [9]. The PET-CT images were independently reviewed by a radiologist and a nuclear medicine specialist.
All CUS procedures were performed under conscious sedation using midazolam and fentanyl, with topical lidocaine for local anesthesia. Relevant clinical information was available to the endoscopists. For EBUS, a BF–UC160F–OL8 video bronchoscope (Olympus Medical Systems Corporation, Tokyo, Japan) was used, and for EUS, a GF–UCT160–OL5 video gastroscope (Olympus Medical Systems, Tokyo, Japan) was used. Fine–needle aspiration biopsies were performed using the NA–201SX–4022 (for EBUS) and NA–200H–8022 (for EUS) needles (Olympus Medical Systems Corporation, Tokyo, Japan). All mediastinal lymph nodes > 5 mm on the short axis, as well as all PET-positive nodes, regardless of size, were biopsied. Three needle passes were performed for each node, ensuring sufficient sample collection. All CUS procedures were performed by endoscopists with extensive experience in interventional bronchoscopy as well as esophagogastric endoscopy. Cytological smears were prepared separately for each nodal station and fixed with 96% ethanol for further analysis. A detailed description of the CUS technique has been presented previously [10].
Within 4 weeks following CUS, patients underwent anatomical lung resection with standard lymph node dissection, according to the European Society of Thoracic Surgeons guidelines [11]. Dissection involved lymph node stations: 2R, 4R, 3A, 7, 8, and 9 on the right side and stations 5, 6, 7, 8, and 9 on the left side. All removed lymph nodes were labelled by the operating surgeon. Lung and lymph node specimens were examined by an experienced pathologist who specialized in lung pathology, who had access to patients’ clinical records. Slices were stained with hematoxylin and eosin and examined using standard light microscopy.
Variables analyzed
The variables analyzed included FN CUS results. Also, associations of these results with clinical characteristics were analyzed, including patients’ age, sex, BMI, tumor histology and grade, lobar location, stage of the disease (assessed using TK, PET and CUS), and SUVmax of the primary tumor and lymph nodes.
Statistical analysis
All calculations were performed using MedCalc Software, Statistica (data analysis software system) version 13 (Tibco Software Inc. Palo Alto, California, USA). Baseline characteristics are presented as counts and proportions for categorical variables and means with standard deviations (SDs) for continuous variables. Additionally, medians and quartiles are provided. The odds ratio (OR) and 95% confidence interval were calculated according to Altman. Sensitivity, specificity, positive predictive value (PPV), and NPV were calculated for the entire patient cohort. The Akaike information criterion (AIC) was used to find the best model from the family of competing models. Statistical significance was set at p < 0.05.
Results
The final analysis included data of 775 patients aged 30–85 years. Of the participants, 532 (68.6%) were men. The basic clinical characteristics of the study group are presented in Table I. Parameters of the diagnostic yield of CUS that was calculated for the whole cohort of 775 patients are presented in Table II.
Table I
Baseline characteristics of the study group
[i] BMI – body mass index, SD – standard deviation, LCE – left central, LUL – left upper lobe, LLL – left lower lobe, RCE – right central, RLL – right lower lobe, RML – right middle lobe, RUL – right upper lobe, ADN – adenocarcinoma, SCC – squamous-cell carcinoma, ASC – adeno-squamous carcinoma, LCC – large-cell carcinoma, OTH – other histological types – CT – computed tomography, PET – positron-emission tomography.
Table II
Diagnostic yield of CUS in the whole cohort of 775 patients
| Parameter | Value (%) | 95% CI |
|---|---|---|
| Sensitivity | 22.52 | 15.14–31.43 |
| Specificity | 97.74 | 96.30–98.73 |
| Disease prevalence | 14.32 | 11.93–16.99 |
| PPV | 62.50 | 47.58–75.37 |
| NPV | 88.30 | 87.22–89.30 |
| Accuracy | 86.97 | 84.39–89.26 |
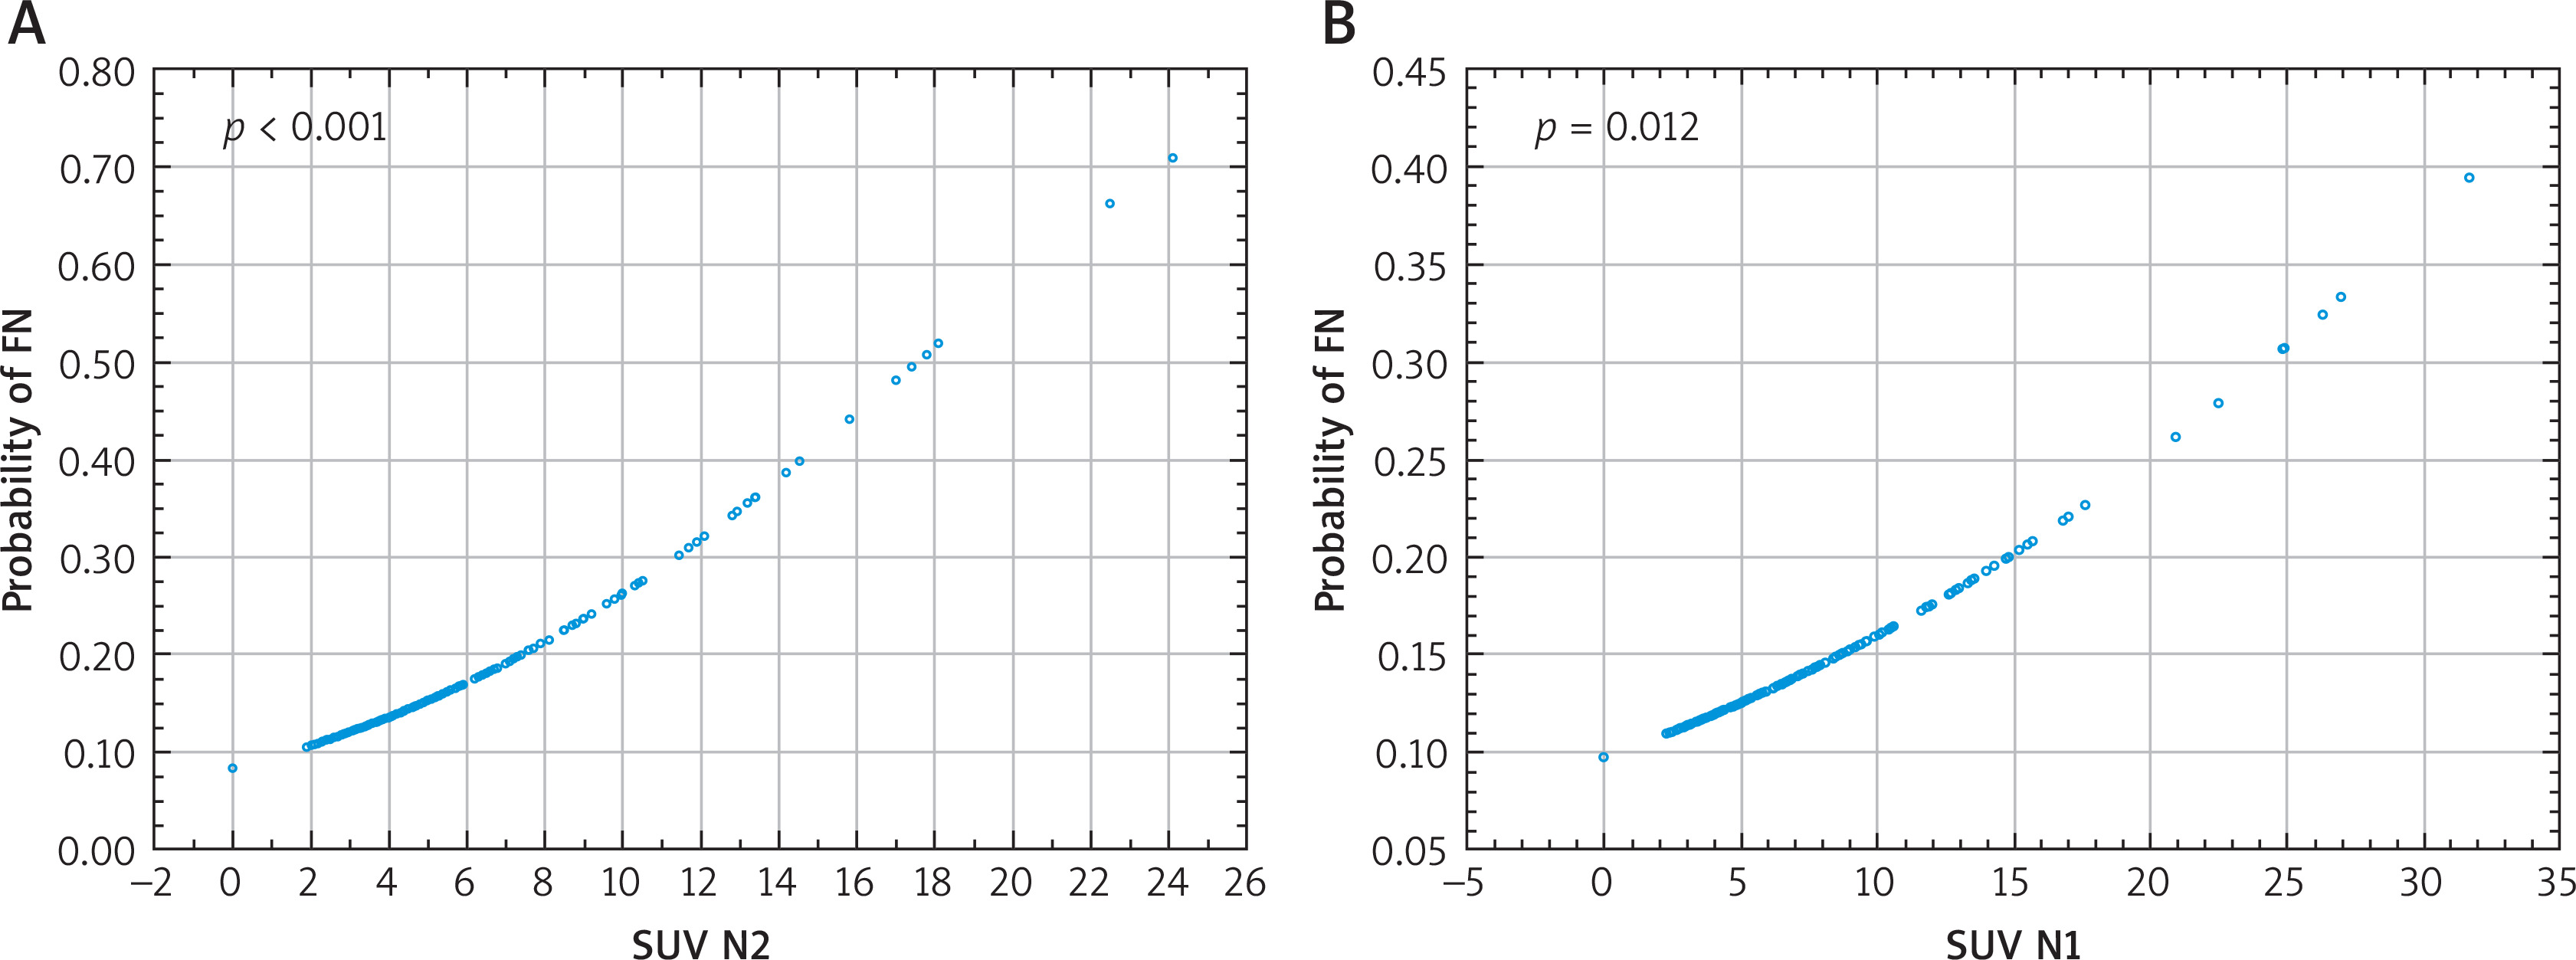
Overall, there were 86 (11%) FN results. The risk of FN CUS results was significantly associated with female sex (p = 0.014), adenocarcinoma histology (p = 0.039), clinical stage determined using both CT (p = 0.001–0.036) and PET (p = 0.001–0.028) (Figure 1), higher SUV of N2 nodes (p < 0.001), and higher SUV of N1 nodes (p = 0.012) (Figure 2, Table III).
Table III
Impact of clinical parameters on the risk of FN results of CUS
| Parameter | OR | 95% CI | P-value |
|---|---|---|---|
| Female sex | 1.77 | 1.12–2.80 | 0.014 |
| ADN histology | 1.68 | 1.02–2.75 | 0.039 |
| SUV of N2 nodes | 1.15 | 1.09–1.21 | < 0.001 |
| SUV of N1 nodes | 1.06 | 1.01–1.11 | 0.012 |
| CT stage# | |||
| IB | 2.11 | 1.05–4.25 | 0.036 |
| IIA | 3.40 | 1.61–7.19 | 0.001 |
| IIB | 2.62 | 1.26–5.44 | 0.010 |
| IIIA | 3.34 | 1.44–7.75 | 0.005 |
| IIIB | 4.25 | 1.25–14.41 | 0.020 |
| PET stage# | |||
| IB | 4.44 | 1.57–12.53 | 0.005 |
| IIA | 6.66 | 2.08–21.37 | 0.002 |
| IIB | 3.37 | 1.14–9.94 | 0.028 |
| IIIA | 8.56 | 3.26–22.5 | < 0.001 |
| IIIB | 4.34 | 1.37–13.74 | 0.013 |
| IIIC | 11.93 | 2.46–57.95 | 0.002 |
| IVA | 6.71 | 1.47–30.69 | 0.014 |
| Age | 0.99 | 0.96–1.02 | 0.421 |
| BMI | 0.99 | 0.95–1.05 | 0.921 |
| Lobar location$ | |||
| RUL | 1.39 | 0.46–4.21 | 0.288 |
| RML | * | * | * |
| RLL | 1.10 | 0.34–3.57 | 0.987 |
| RCE | 1.57 | 0.45–5.52 | 0.293 |
| CUL | 1.05 | 0.31–3.50 | 0.848 |
| LIN | * | * | * |
| LUC | 0.79 | 0.22–2.89 | 0.356 |
| LLL | 1.02 | 0.31–3.37 | 0.773 |
| Grade** | |||
| 2 | 0.88 | 0.36–2.19 | 0.794 |
| 3 | 1.04 | 0.41–2.26 | 0.928 |
| 4 | 0.87 | 0.23–3.33 | 0.837 |
| SUV of primary tumor | 1.02 | 0.99–1.05 | 0.116 |
CUS – combined endobronchial and endoscopic ultrasound, OR – odds ratio, CI – confidence interval, ADN – adenocarcinoma, SUV – standardized uptake value, CT – computed tomography,
* there were no false negative results for tumors located in the right middle lobe or in the lingula, BMI – body mass index, RUL – right upper lobe, RML – right middle lobe, RCE – right central, RLL – right lower lobe, CUL – culmen, LIN – lingula, LUC – left upper lobe central, LLL – left lower lobe,
Figure 1
Correlation between the risk of false negative combined endobronchial and endoscopic ultrasound (CUS) results and sex (A), histological type of tumor (B), computed tomography (CT)-determined stage (C), and positron emission tomography (PET)-determined stage (D)
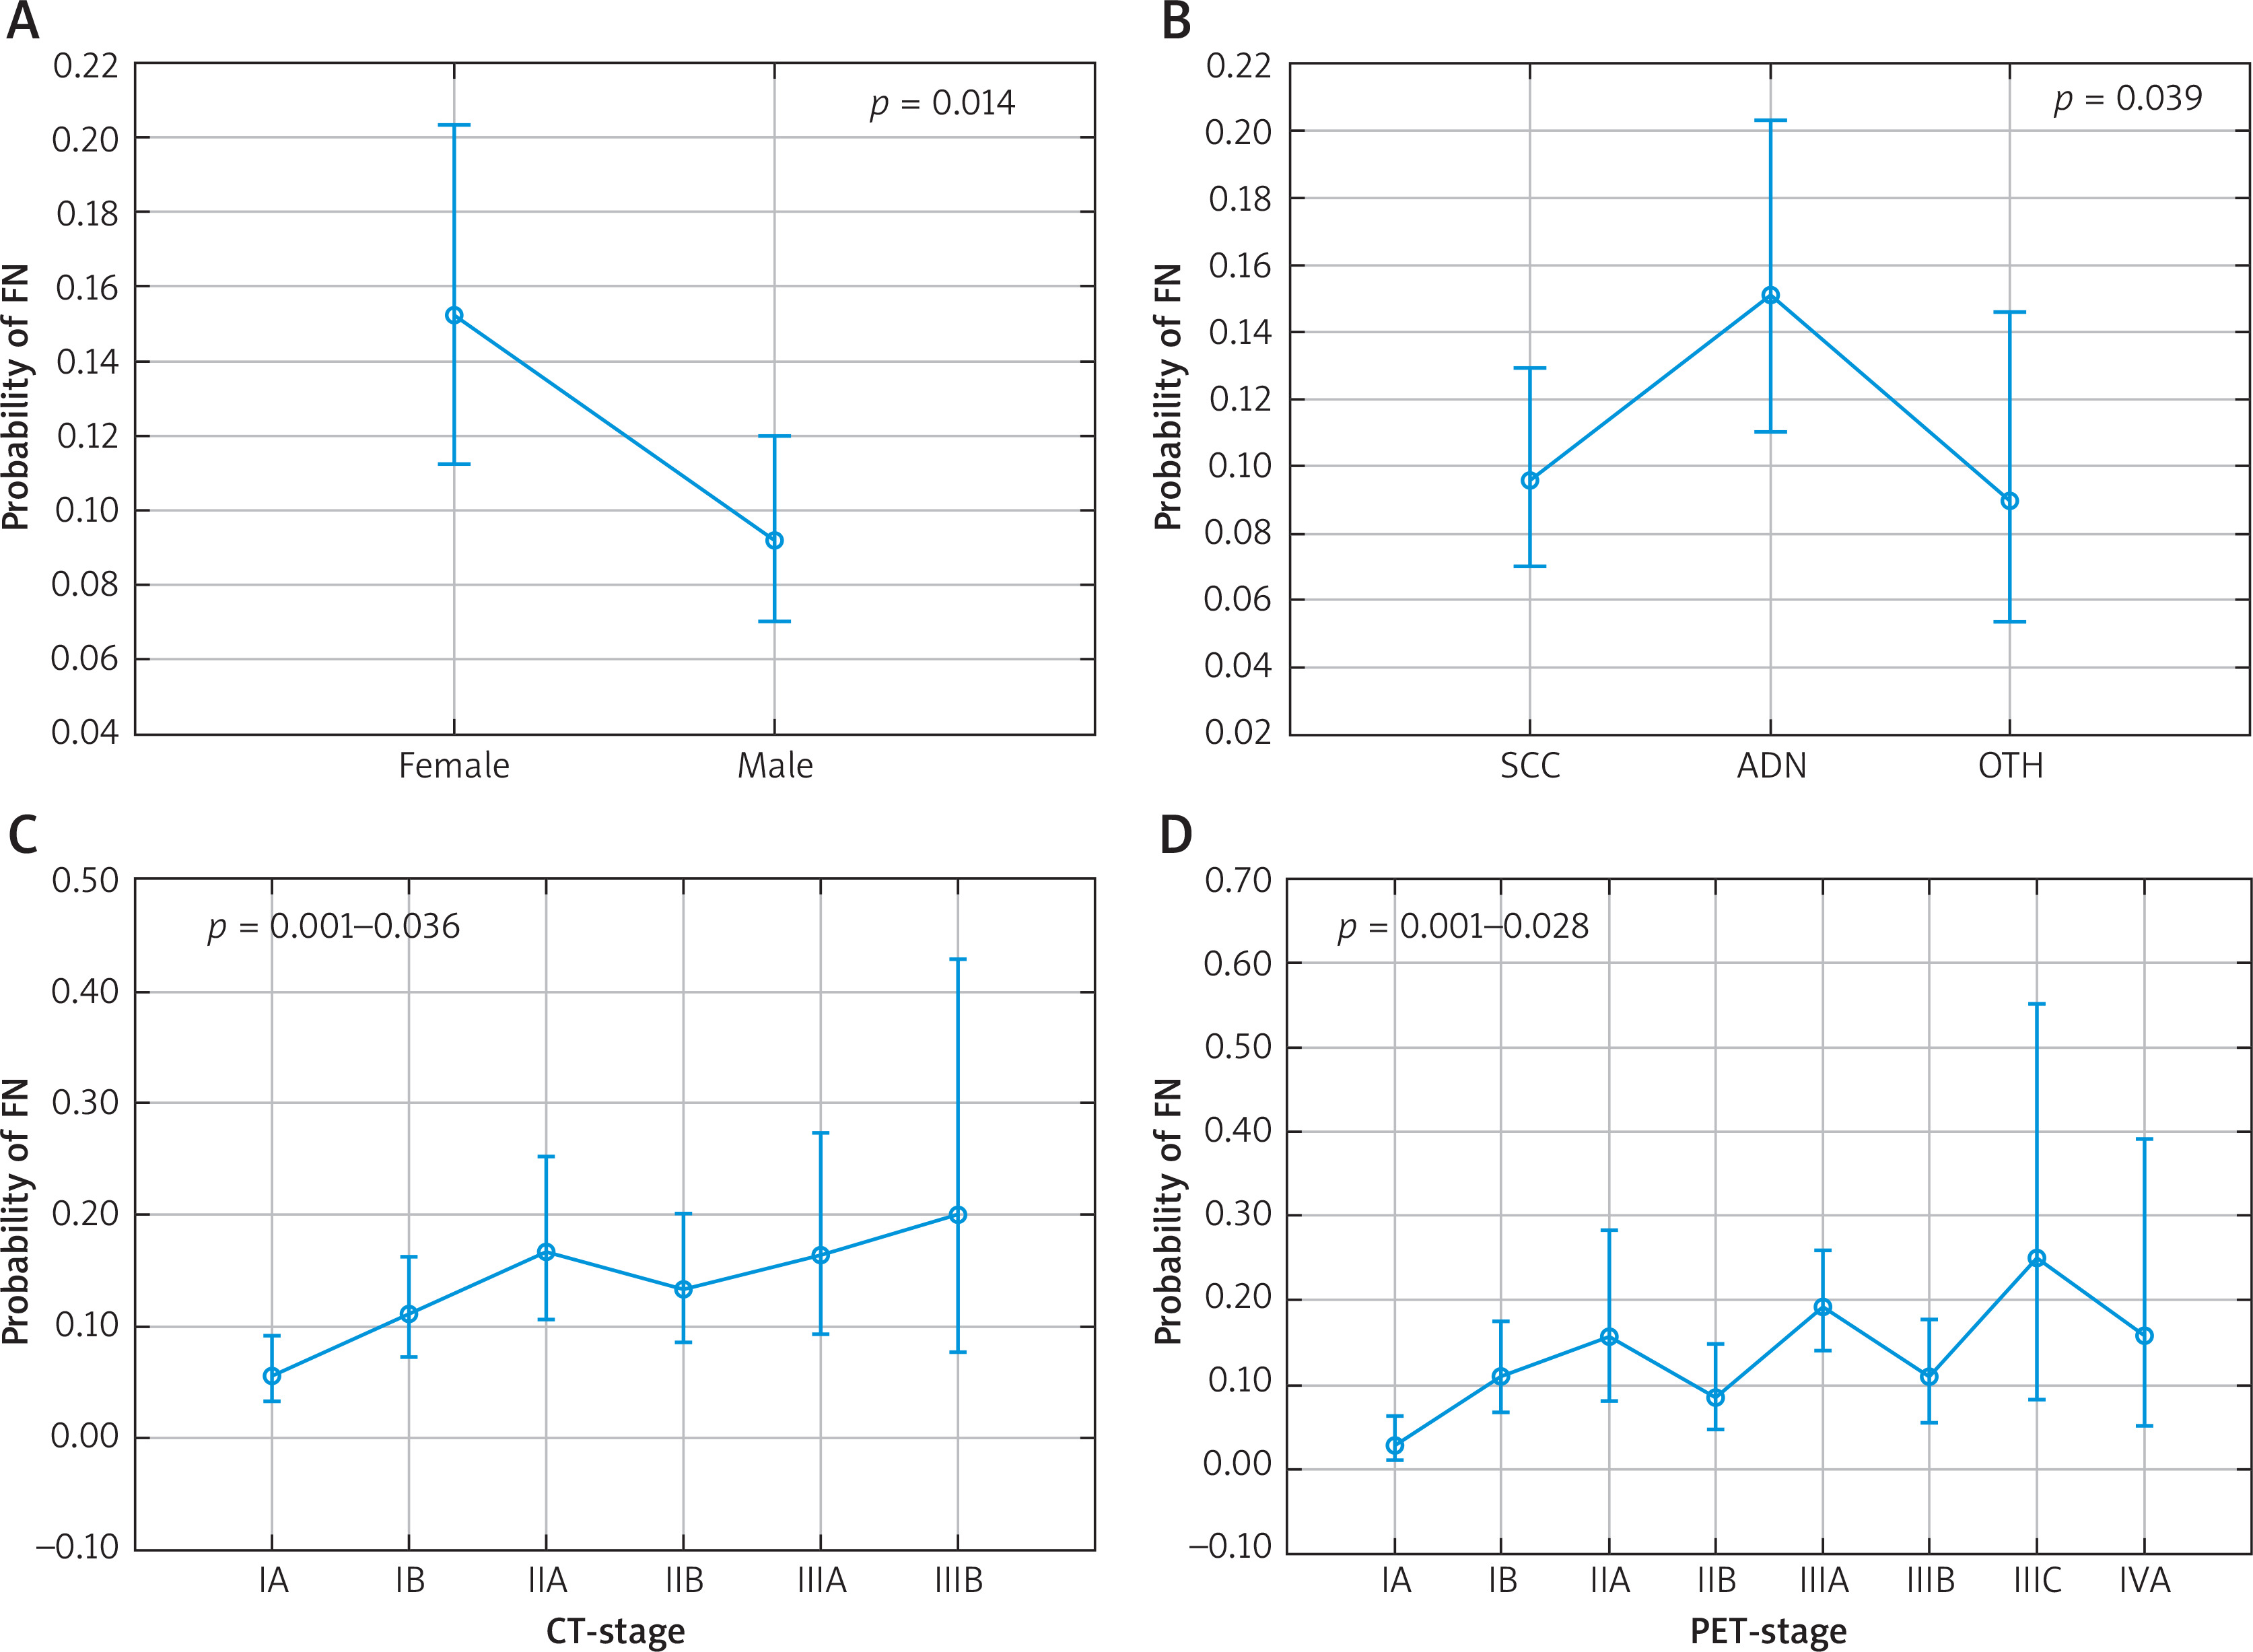
Figure 2
Correlation between the risk of false negative combined endobronchial and endoscopic ultrasound (CUS) results and maximum standardized uptake values (SUVmax) of mediastinal (A) and intrapulmonary/hilar (B) lymph nodes
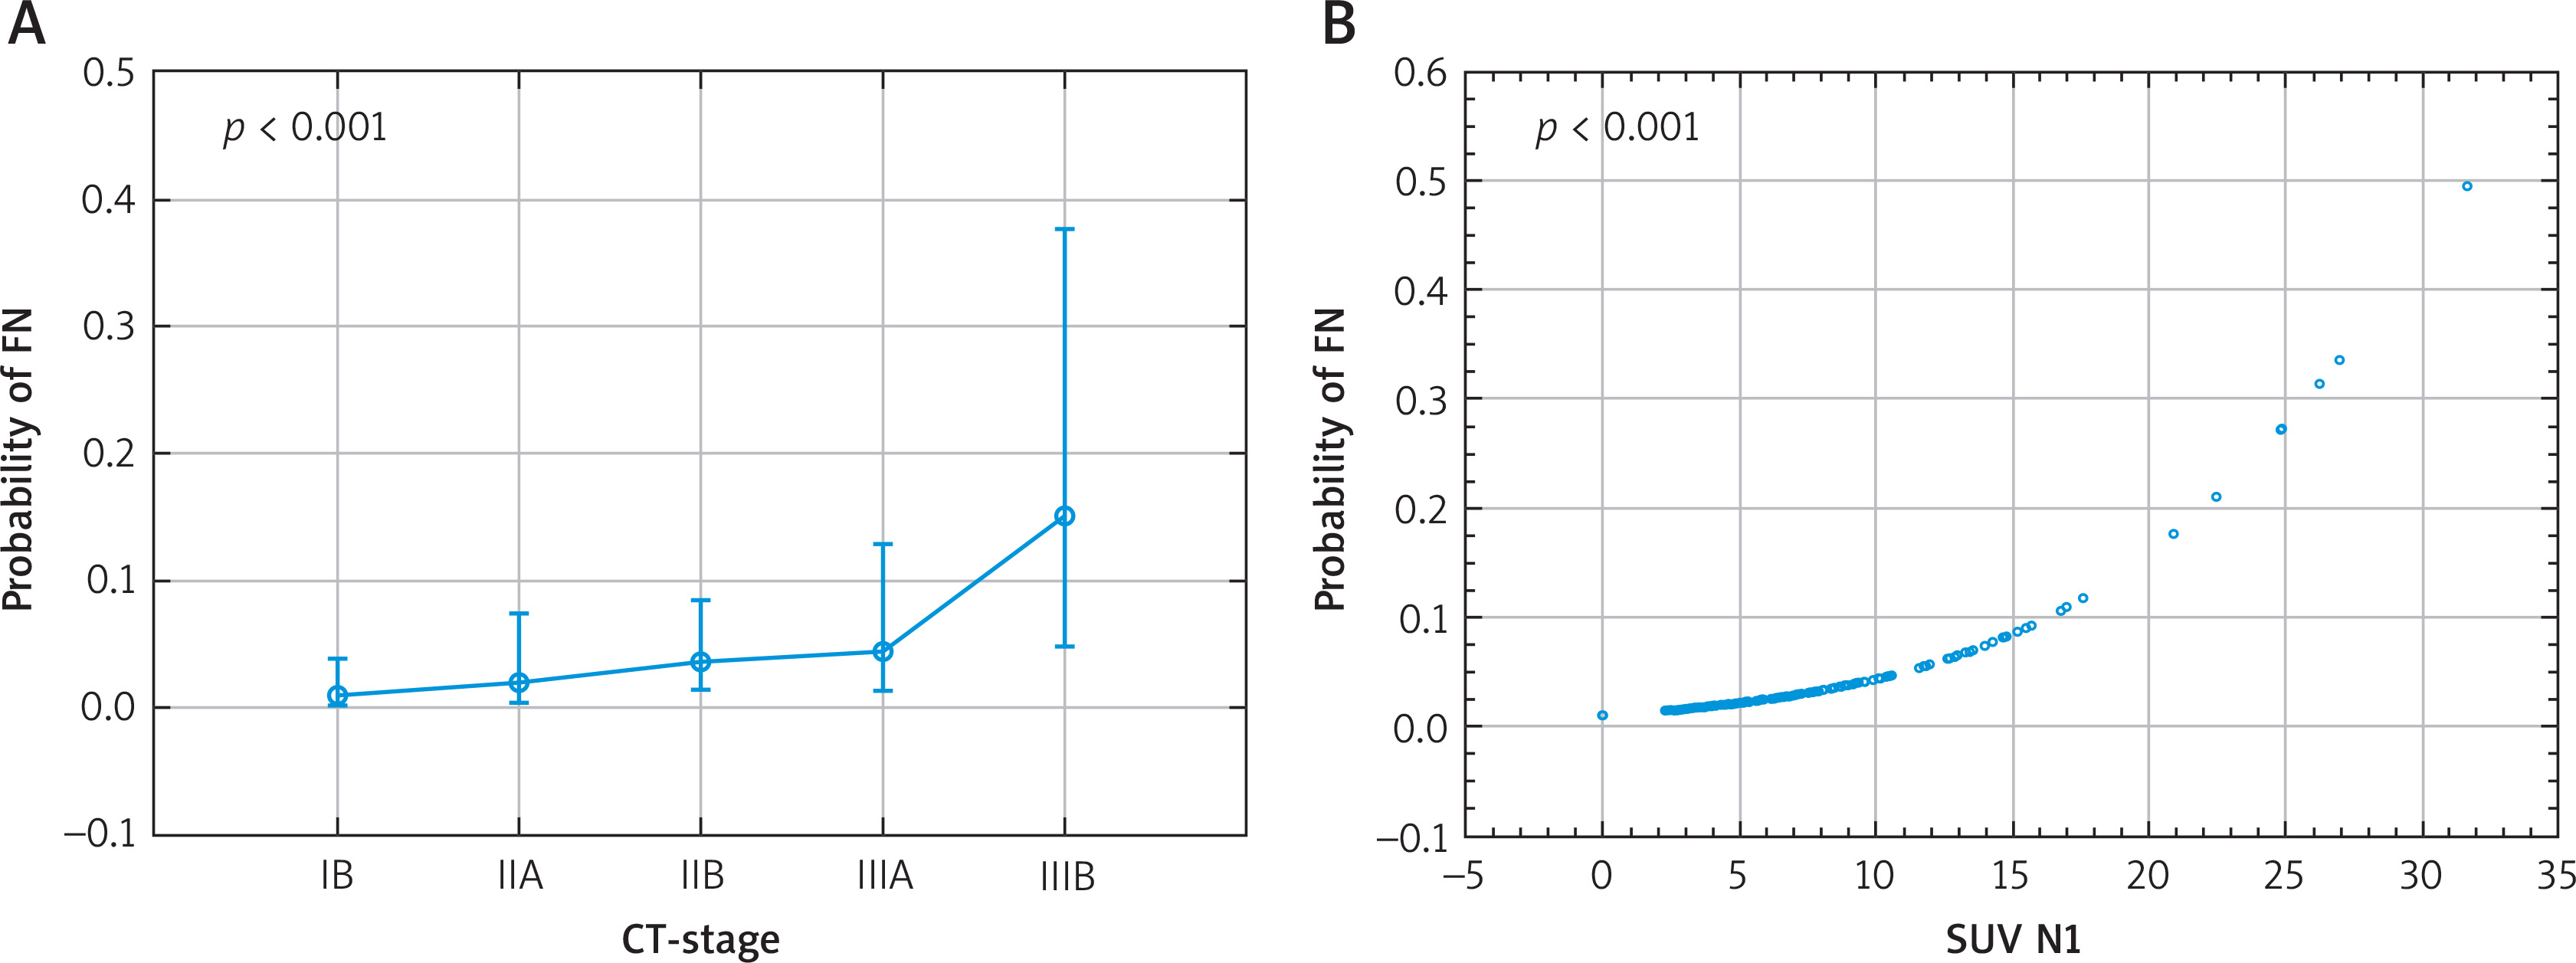
No significant association was found between the risk of FN CUS results and patients’ age (p = 0.421), BMI (p = 0.921), and primary tumor lobar location (p = 0.29–0.99), grade (p = 0.67–0.88), and SUVmax (p = 0.12) (Figure 3, Table III).
Figure 3
Correlation between the risk of false positive CUS results and computed tomography (CT)-determined stage (A) and SUVmax of intrapulmonary/hilar lymph nodes (B)
Akaike logit models were built to estimate the relative quality of using the following parameters: sex, histological type, SUV of N1 nodes, SUV of N2 nodes, clinical stage determined using CT and PET, and number of N2 nodes removed during surgery. The model that included sex, histological type, SUV of N2 nodes, clinical stage determined using PET, and number of N2 nodes removed during surgery performed best, with the Akaike information criterion (AIC) of 499.002.
Among the 86 patients with FN results of PET, 27 (31.4%) had mediastinal node metastasis in inaccessible locations for CUS (stations 3A, 5, and 6).
Discussion
Key findings
We found several clinical characteristics associated with increased risk of FN CUS results. These include female sex, adenocarcinoma histology, and higher clinical stages determined using CT and PET. From the practical point of view, negative results of CUS in any of the groups of patients should be treated with caution. Particularly, the coexistence of female sex, adenocarcinoma, higher SUV of N2 nodes, higher clinical stage determined using PET, and higher number of N2 nodes removed during surgery indicate the highest risk of FN results.
Strengths and limitations
The strength of our study is the large number of patients included in the analysis. To our knowledge, only one paper has been published with a similar patient cohort [12]. Additionally, all patients underwent diagnostic work-up in the same center and according to a standardized protocol. Moreover, we analyzed associations of FN results and a wide variety of patient-related and tumor-related characteristics, including age, sex, BMI, tumor histology and grade, lobar location, stage of the disease (assessed using TK, PET, and CUS), and SUVmax of the primary tumor and lymph nodes. In this regard, our results are original.
The limitation of this study is its retrospective nature; however, for a study analyzing a diagnostic test, this is unlikely to have an impact on the results.
Comparison with similar research
The published evidence regarding the combined EBUS and EUS is limited. Even fewer papers provide data regarding the correlation between clinical characteristics and FN CUS results. In the largest study published to date, the authors found the following predictors of FN CUS results: central location of the tumor in the lung, enlarged nodes on CT, and positive PET results of N2/N3 lymph nodes [12]. In our study, we did not analyze the central or peripheral location of the primary tumor, but the remaining results are in line with our findings. Several studies report the rate of FN CUS results. The paper by Annema et al. was the only one to report a significantly lower number of FN results (4 out of 123 patients, 3.3%) in comparison to our results [13]. Other authors noted rates of FN that are similar to our findings: Crombag et al. reported FN results in 13% of 229 patients, a meta-analysis of 16 papers published by Korevaar et al. found an FN rate of 8% in a low prevalence group and 13% in a high prevalence group, and Oki et al. reported 6% of FN among 150 patients [14–16]. In another study including 120 patients, the rate of FN CUS results was 8%. In this study, all FN results occurred in lymph nodes ≤ 10 mm in diameter [7]. Notably, the authors of the aforementioned papers did not analyze the correlation between clinical patient-related or tumor-related characteristics and the rate of FN results.
The potential reasons for FN CUS results include the small size of the involved lymph nodes and metastasis in nodal stations that are inaccessible for endosonography [6, 7].