Purpose
In gynecological (GYN) brachytherapy, the gold standard imaging method for treatment planning is magnetic resonance imaging (MRI), as it visualizes patient anatomy with a high soft tissue contrast [1]. However, post-implant MRI with inserted applicator is not available in many centers, and computed tomography (CT) remains the most widely used imaging modality worldwide. Since CT provides high-resolution and distortion-free imaging, the applicator and needle can be reconstructed with high accuracy. However, MR images may show image distortion, which must be examined before brachytherapy treatment planning [2]. Several publications have provided data on the accuracy of applicator/catheter reconstruction using MR imaging. Data are available for low-field strength scanners [3, 4] and for 1.5T MR scanners [5-7]. Using a 1.5T MR, Aubry et al. found the mean absolute system-based distortions of less than 1.1 mm in the central region, and less than 2.3 mm in the outer region of the image [8]. The clinical application of 3T MR imagining in BT planning is quite limited, and despite better image quality, high-field strength may provide certain disadvantages, including heating effect or susceptibility artefacts [9].
In our previous study, we examined the image distortion of a 0.55T MR scanner using a 3D-printed cube-shaped grid phantom placed in water [10]. In the central region, the distortion was less than 1 millimeter in the 10 × 10 × 10 cm volume, and it was less than 2 mm in the 15 × 15 × 15 cm volume. This level of accuracy achieved with a 1.5T MR has been reported by others, and is considered acceptable for clinical use [8]. Prior experience has confirmed that low-field (0.1-0.5T) and high-field (1.0-1.5T) MR scanners can meet the requirements of MR-based brachytherapy (BT) planning [3, 11]. Based on our experience, image distortion of a 0.55T MR scanner does not exceed 1 mm in the volume of interest, including the applicator region and relevant anatomical areas.
In BT treatment planning, the precision of applicator/needle tip defines the accuracy of source dwell positions, having a major impact on dose distribution calculation, and this is generally considered the greatest uncertainty in applicator/needle reconstruction. The reconstruction accuracy of tip position is highly influenced by image quality and also by inter-observer variations. The impact of reconstruction uncertainties on dosimetry depends on the treatment site [12, 13]. In a study by Haack et al. on MRI-based reconstruction, the inter-observer variations were between 0.5 and 1.0 mm [5]. Inaccuracy in applicator reconstruction and applicator displacement of a few mm can result in a significant change in dosimetry [13, 14].
The current study aimed to assess the geometrical accuracy of applicator and needle reconstruction using a 0.55T MR scanner with 3D T2W image acquisition, and to evaluate its applicability for BT treatment planning in cervical cancer.
Material and methods
A MAGNETOM Free.Max (Siemens Shenzhen Magnetic Resonance Ltd., Shenzhen, China) MR scanner was utilized in the study, with a field strength of 0.55 Tesla and supported by deep learning software technologies and advanced image processing. This compact, smaller footprint scanner requires only 0.7 liters of liquid helium without a quench pipe, while its 80 cm-wide patient bore is beneficial when planning brachytherapy for gynecological cancer patients. The large aperture allows the use of a leg support system during imaging, which ensures a similar or identical patient position as in applicator insertion and dose delivery.
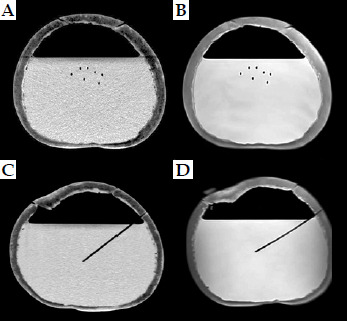
The present study consisted of two parts. In the first part, reconstruction accuracy of plastic needles on CT and MR images were compared. For CT imaging, Somatom go.Sim (Siemens Healthineers, Erlangen, Germany) was used. In this test, seven plastic needles (ProGuide Needles, Merit Medical Systems, South Jordan, UT, USA) with rigid tungsten alloy obturators arranged in a triangular pattern were inserted into watermelon phantoms (Figure 1). Three needles were inserted to a depth of approximately 6 cm (small depth), and four were inserted needles to approximately 10 cm (medium depth) in two watermelons of different sizes. In the third watermelon, the inside part was removed and replaced with water to create a homogeneous background for the needles to be more visible (Figure 2). Then, seven needles were inserted to a depth of approximately 12 cm. The hard outer shell of watermelons held the needles in place, preventing them from moving during CT and MR imaging. Oil-filled markers were placed on the outer surface, so that the phantom could be placed in the same position on CT/MR table (Figure 1). The markers were used to create identical coordinate systems for needle reconstruction using both imaging methods. In the planning system (Oncentra Brachytherapy v. 14.6, Elekta, Veenendaal, The Netherlands), this is called an “extra coordinate system” (ECS). Using the same coordinate system, it was possible to compare coordinates directly without transformation. In this study, the needles contained no markers, only air. CT and MR imaging were performed consecutively using the same slice thickness of 1.5 mm in both CT and MR, with in-plane pixel size of 0.54 × 0.54 mm. A three-dimensional T2-weighted (3D T2W) MRI acquisition was used, with repetition time of 1,500 ms, echo time of 92 ms, echo train length of 80, 241 phase encoding steps, field of view (FOV) of 28.5 × 30.6 cm, and pixel spacing of 0.53 mm.
Fig. 1
Setup of a watermelon-phantom with seven needles on a CT table, with laser lights and external markers
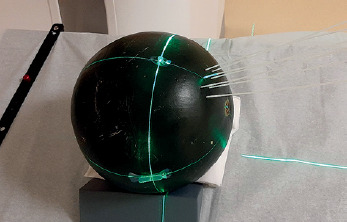
Fig. 2
CT (A, C) and MR (B, D) images on axial (A, B) and sagittal (C, D) slices with inserted needles in a water-filled watermelon-phantom (air-filled needles only).
Five observers (qualified medical physicists) reconstructed the needles in the planning system using CT and MR images. For each needle, the tip and point on the surface of the phantom, indicating where the needle penetrated the watermelon, were identified, and insertion depth of the needles was calculated from these two points. During reconstruction, arbitrary planes were created, such as planes perpendicular and parallel to a needle, which helped determine the coordinates of the two needle points more accurately. The needle depths and accuracy of tip definitions between MR and CT images were directly compared using standard deviation (SD).
In the second part of the study, inter-observer variations in the determination of tip positions of applicators and needles in patients using MR images were assessed. MR images taken after 20 fractions delivered in 11 patients treated with intracavitary and interstitial technique using Venezia applicator were selected. The Venezia intracavitary applicator (Elekta Brachytherapy, Veenendaal, The Netherlands) is MR-safe, and consists of a tandem and two ovoid tubes. For small tumors, it is sufficient to use only the intracavitary applicator, but for larger, irregular tumors with parametrium infiltration, plastic needles can be inserted peripherally through the ovoid tubes in order to geometrically cover target volume. In 1 fraction – 2 needles, in 3 fractions – 4 needles, in 11 fractions – 5 needles, and in 5 fractions – 6 needles were employed in addition to a three-channel intracavitary applicator. Tip positions of the applicators and needles were independently recognized and reconstructed by five observers. In the tandem and two ovoid channels, MR markers (MR Line Markers, Elekta) were inserted, and the distal end of the markers was selected as the tip corresponding to the first dwell position (Figure 3).
Fig. 3
MR images of a patient treated with a Venezia applicator using five needles. Tandem and ovoid channels contain MR markers (A, B), but needles contain air only (C, D)
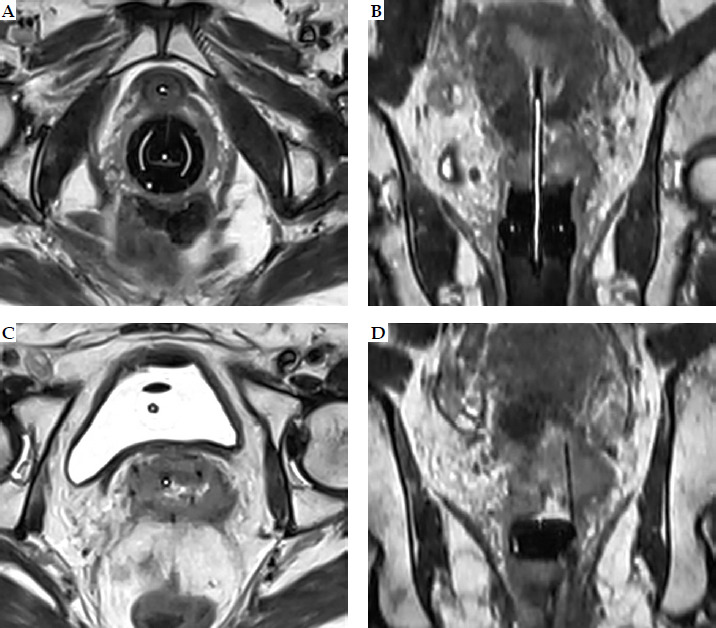
The use of library models developed for rigid GYN applicators is widespread in brachytherapy planning and recommended as the gold standard. However, for needles, only direct reconstruction can be used, and since we wanted to compare the reconstruction accuracy of tip ends with and without markers, the applicator library was not utilized. As there were no markers in the needles (air only), the tip of the needles (black void) was employed as the first reconstruction point, followed by a 6-mm offset used during treatment planning. Therefore, X, Y, and Z coordinates of 60 applicator and 99 needle points were reconstructed and recorded by each of the five observers. The definition of three axes of the coordinate system used for applicator/ needle reconstruction was as follows: the X axis was oriented in the anatomical left direction, the Y axis in the anatomical cranial direction, and the Z axis in the anatomical anterior direction, with the Y direction corresponding to the longitudinal direction. According to our clinical protocol, a 3-mm slice thickness was applied.
Variability between the observers in defining the tips of applicators/needles with and without a marker on MR images was determined and analyzed separately. Deviations of the coordinates were calculated in the three main directions (X, Y, Z), and variations between the observers were calculated and compared. Due to the lack of a ground truth, comparisons were limited to the evaluation of variations described as SDs.
In this study, only the tips of applicators/needles were used, as they are of paramount importance in treatment planning, serving as anchor points for applicator/needle reconstruction. The tips of applicators/needles are often difficult to identify, and their inaccurate recognition has a significant impact on dwell position of the source in applicator/needle, leading to great changes in dose distribution. Other applicator/needle points used for reconstruction can be identified much more easily by visually following the tracks of applicators/needles on the images.
Shapiro-Wilk test was employed to determine normality of data distribution, and Wilcoxon signed-rank and Mann-Whitney tests were used to compare non-normally distributed data. Prism 8.0.1 (GraphPad Software Inc., Boston, MA, USA) was applied for statistical calculation. A difference was considered significant if p-value was < 0.05.
Results
In the phantom tests, the depths of needles measured on MR images were longer compared with those on CTs. The means were 59.6 ±1.11 mm vs. 58.3 ±1.09 mm for short needles, 98.6 ±1.25 mm vs. 97.7 ±1.08 mm for medium needles, and 118.1 ±1.19 mm vs. 116.7 ±0.96 mm for long needles. Compared with CT, the variability of depths on MR images was greater for all types of needles. Although the depth differences were statistically different (p < 0.05), the mean differences between the depths of inserted needles measured on MR and CT images were less than 1.5 mm, with a maximum being less than 2 mm (Table 1). A positive depth difference indicates that the depth on MR is longer; thus for all needles, the depth varied on average by 1.16 ±0.80 mm.
Table 1
Differences between needle depths in phantoms measured on MR and CT images
| Variable | All | Small depth | Medium depth | Large depth |
|---|---|---|---|---|
| Mean (mm) | 1.16 | 1.28 | 0.93 | 1.34 |
| Range (mm) | –1.41 to +1.94 | –0.61 to +1.84 | –1.41 to +1.93 | –0.71 to +1.94 |
| SD (mm) | 0.80 | 0.63 | 0.94 | 0.59 |
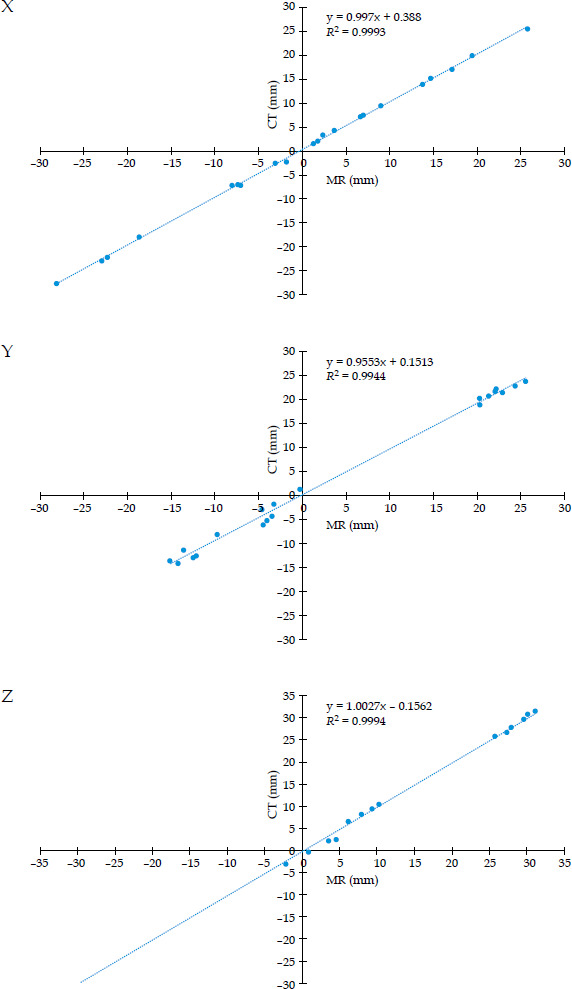
The observers reconstructed the tips of all needles, and SDs of the X, Y, and Z coordinates were calculated for both MR and CT images, and SDs for all points were averaged. Table 2 shows the results for X, Y, and Z coordinates. A good correlation was found between the needle tip coordinates determined on MR and CT images. Figure 4 illustrates the correlations in X, Y, and Z directions. The correlation coefficient (R2) was high (> 0.99) in all directions. Deviations from the means were additionally calculated, and the mean deviation from the means was 0.0 mm for all three directions. SDs were as follows: 0.27 mm, 0.67 mm, and 0.50 mm for MRI, and 0.36 mm, 0.82 mm, and 0.57 mm for CT images, in the order of X, Y, and Z coordinates, respectively, with the largest variation observed in the Y direction. It has to be noted that the in-plane resolution of the images was less than 1 mm, while in the Y direction it was 1.5 mm, corresponding to the slice thickness.
Table 2
Mean standard deviations of coordinates of needle tips on MR and CT images, calculated by five observers. Measurements were performed on phantoms
| Variable | MR | CT | ||
|---|---|---|---|---|
| SD | Range | SD | Range | |
| X (mm) | 0.29 | 0.10-0.56 | 0.34 | 0.06-0.87 |
| Y (mm) | 0.68 | 0.20-1.60 | 0.80 | 0.05-2.38 |
| Z (mm) | 0.62 | 0.15-1.12 | 0.62 | 0.22-1.76 |
Fig. 4
Correlation between coordinates of needle tips calculated on MR and CT images for X, Y, and Z directions
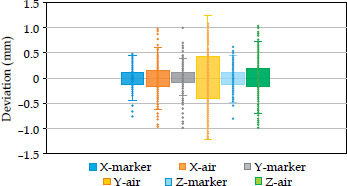
On MR images of patients treated with twenty BT fractions, the means of X, Y, and Z coordinates for each tip point determined by all observers were initially calculated, followed by SD values and their average calculations. For the intracavitary applicators with markers, the mean SDs were 0.18 mm, 0.24 mm, and 0.21 mm for the X, Y, and Z directions, respectively. For the needles without a marker, the mean SD values were 0.27 mm, 0.58 mm, and 0.34 mm. The range was wider for the air-filled needles (Table 3). Also, the deviations from the means for each applicator/needle tip for each observer were calculated, SDs determined, and values averaged. The mean deviation was 0.00 mm for the X, Y, and Z directions for all tip points, and 0.00 mm when the calculation was performed for the two groups (with and without a marker) separately. There was no significant difference between the means of the two groups (p = 0.9878, 0.7091, and 0.9017 for X, Y, and Z, respectively), but the SD value for each direction was less when MR markers were used in the applicators (X: 0.17 vs. 0.27, Y: 0.26 vs. 0.46, Z: 0.17 vs. 0.34), showing more accurate tip definitions compared with the air-filled needles; data range was larger for the air-filled needles. It has to be noted that the largest SD value was always obtained for the Y coordinates corresponding to the longitudinal (cranio-caudal) direction. For all applicators/needles, the SD value for the Y direction was 0.45, while only 0.24 and 0.29 for the X and Z directions, respectively. The range of Y data was again larger than that of X and Z data. Box-and-whisker plot in Figure 5 graphically demonstrates the data. As can be seen clearly, in air-filled needles, the ranges and boxes are wider, indicating greater variability of the data.
Table 3
Mean standard deviations of coordinates of applicator/needle tips, calculated by five observers. Measurements were performed on MR images of patients
Discussion
MRI-based image-guided BT is considered the gold standard in treating cervical cancer, and there are numerous publications on its clinical application [1, 11, 15]. However, due to limited availability, a CT-based approach is more commonly used. A hybrid approach, when MRI is used only in the first fraction and CT in subsequent ones, it can provide adequate dosimetry and good clinical outcomes [16]. Applicator reconstruction plays a crucial role in treatment planning, and its accuracy greatly influences the dose delivered to the target volume and organs at risk. Richart et al. reviewed strategies for MRI-based reconstruction of endocavitary and interstitial applicators [17], emphasizing the importance of assessing the tip of catheters, showing that a greater slice thickness (3-4 mm) may lead to some inaccuracy. Dai et al. demonstrated that a deep learning model can reliably automate catheter reconstruction in MRI-guided HDR prostate BT [18]. Using their model, 87% of catheter tips were reconstructed within an error of less than ±2.0 mm, and more than 71% of the tips could be localized within an absolute error of no more than 1.0 mm. Lee et al. in their study reported that treatment planning based solely on MRI is feasible, and the results are comparable to those obtained using CT/MRI-based approach [19].
For applicator reconstruction, para-transverse or para-sagittal 2D imaging is recommended due to its high spatial in-plane resolution, with optional 3D imaging also having its advantages [20, 21]. During 3D MRI acquisition, the whole volume is scanned at once and data sampling is performed in 3D rather than slice-by-slice, as in 2D imaging. Since isotropic voxels have the same resolution in all directions, images can be reconstructed with the same accuracy in any plane. GEC-ESTRO considers this imaging technique to be optional, noting that it requires a longer examination time [19, 20]. Also, GEC-ESTRO recommends taking images that are perpendicular and parallel to the applicator axis (e.g., para-axial, para-sagittal, para-coronal) to achieve good in-plane resolution. However, in case of interstitial needles, this orientation may not be appropriate because the needle directions can be oblique. Since we also used needles that were not necessarily parallel to the applicator axis or to each other, 3D image acquisition was used in our study. Qing et al. developed a method that combines CT scout images with axial CT images [21], demonstrating that the use of two-dimensional CT scout images resulted in more accurate identification and reconstruction of needle tips in HDR-BT.
Our inter-observer investigation showed that applicator and needle reconstruction based on MR images is feasible for a 0.55T MR scanner. Compared with CT, the accuracy of needle tip localization on MR images in phantoms was similar, with an SD value of less than 1.0 mm. The lengths of needles were greater when measured on MR images, with a mean difference of less than 1.5 mm. Since the accuracy of tip positions was similar for both imaging methods, the small differences were likely due to the determination of entry points on the surface of melon phantoms, which are sensitive to the level of windowing. In both imaging techniques, the largest inaccuracy occurred in the longitudinal direction (Y), which is a consequence of larger slice thickness compared with the geometrical in-plane spatial resolution. Other studies have also reported that the reconstruction uncertainty is greater in the direction perpendicular to the orientation of slice, which is commonly linked to the large pixel size or slice thickness in this direction [5, 22]. These results highlight the need for using small slice thicknesses in order to increase the accuracy of applicator reconstruction. It is recommended that the slice thickness be as small as possible without increasing the MR image acquisition time too greatly. Moreover, the accuracy of reconstruction depends on the physicist’s skill, image quality, and applicator/ needle visibility. Here, we demonstrated that the image quality of a 0.55T MR scanner is sufficient to ensure a small inter-observer variation in tip localization.
In the Venezia applicator, radiopaque markers can be inserted into three intracavitary channels (tandem and two ovoid tubes), but no markers are available for the needles. We investigated the difference in applicator/ needle reconstruction accuracy when using markers or air-filled only needles. Whereas in patients, our results showed that MR markers allow more accurate positioning of the applicator tip than air-filled needles. The high visibility of the marker helps identify the tips with less uncertainty. Of the three directions, the greatest variability in the Y-axis coordinate values can be explained by the thickness of the image slice (1.5 or 3.0 mm). The in-plane image resolution (X and Z direction) was less than 1 mm, making it possible to determine the position of the tips more accurately.
The utilization of MR markers has been addressed in the European guidelines and the AAPM TG report 303 [20, 21]. Due to better visibility, markers can facilitate more accurate applicator reconstruction. Haack et al. evaluated methods used for reconstructing cervical applicators directly on MR images [5]. Custom-made plastic catheters filled with copper sulphate solution were inserted into source channels. With phantom experiments and clinical evaluations, they found small inter-observer differences with a SD below 2 mm in all directions. In our study, the SD value between the observers was less than 0.5 mm in determining tip positions of MR markers in intracavitary applicators. For needles without markers, a SD was less than 1.0 mm.
In recent years, considerable research have been conducted on techniques for automatic catheter reconstruction using electromagnetic (EM) tracking [23-31]. However, this new method is not yet commercially available nor routinely used in clinical practice. Image thresholding technique can also be used for automatic reconstruction, but manual catheter reconstruction remains the main technique to enter positions of catheters into planning system [32].
Previously, open MRI scanners with low magnetic field strength have been employed for brachytherapy planning [3, 4, 11]. Image distortion was found to be minimal, and inter-observer errors were comparable with CT [4]. The most recent research used 1.5T MR scanners to evaluate the accuracy of applicator reconstruction, and only a few studies used a 3T scanner [5-7, 9, 33]. To our knowledge, this is the first report to investigate the use of a 0.55T MR scanner in BT planning, which can be considered a strength of our study.
However, this work has its limitations. We did not examine the effect of small inaccuracies in the reconstruction of applicators and needles on dose distribution, and focused primarily on gynecological brachytherapy. The dosimetric consequences of our findings still need to be confirmed in future studies, and other treatment sites must be included with different types of applicators/ catheters. Furthermore, MR physicist was not involved in the development of our MR sequences. Optimizing MRI sequences is a subject of our plans, and will involve physicists with in-depth knowledge of MR imaging, as recommended in the AAPM TG report 303 [34]. The strength of our study is that it is the first to examine the geometric accuracy of a new low-field MR scanner used for brachytherapy treatment planning.
Conclusions
Based on our results, the reconstruction of applicators and needles can be performed with clinically acceptable accuracy using the 0.55T MR scanner. MR markers allow greater precision in determining the tip of the applicators than when markers are not used. The accuracy of reconstruction using MR images is comparable to that achieved using CT images.