Purpose
High-dose-rate (HDR) brachytherapy is a well-established component of curative-intent radiotherapy for localized prostate cancer, used either as monotherapy in selected patients or as a boost in combination with external beam radiotherapy (EBRT) [1, 2]. Its dosimetric strength lies in the ability to deliver highly conformal dose distributions with steep dose fall-off, enabling robust target coverage while limiting exposure to adjacent organs at risk, most notably the urethra and rectum. Accordingly, contemporary guidance from GEC-ESTRO ACROP [3] and the American Brachytherapy Society (ABS) [4] emphasizes consistent reporting of prostate and organ at risk (OAR) dose-volume parameters and adherence to institutional or consensus-based constraints, including prostate D90% ≥ 100% of the prescription dose (%Rx), prostate V100% ≥ 95% Rx, urethra D1% ≤ 130% Rx, and rectum D30% ≤ 60-65% Rx. Large institutional series have demonstrated that HDR brachytherapy consistently achieves high-quality dose distributions when performed as per standardized planning protocols [5].
The number of implanted needles (catheters) in HDR prostate brachytherapy varies substantially across published series and institutions, typically ranging from approximately 12 to more than 20, depending on prostate volume, institutional experience, and planning philosophy. Prior cited works [6-9] have established that implant catheter configuration significantly affects DVH (dose-volume histogram; parameters in HDR prostate boost treatments, while Batchelar et al. [10] highlighted the importance of adequate prostate coverage by catheter for consistent dosimetric outcomes. Csányi et al. [7] specifically addressed the question of optimal catheter number in prostate HDR planning, reporting that denser catheter insertion improves dose conformity, a finding that forms the conceptual basis for the present study.
Despite its routine clinical relevance, the dosimetric impact of catheter number itself, independently confirmed in a large real-world dataset and adjusted for the key confounder of prostate volume, remains insufficiently quantified. To our knowledge, the present study represents the largest single-institution analysis (1,850 fractions from 1,008 patients over a 10-year period) to quantify the independent association between needle number and dosimetric outcomes, with explicit adjustment for prostate volume as a primary confounder. Additionally, we demonstrate that prostate volume is a major determinant of needle count and must be considered in institutional benchmarking and outcome-linked analyses. The aim of this study was therefore to evaluate the relationship between needle number and key dosimetric parameters in a large single-institution retrospective dataset throughout 10 years of routine clinical practice.
Material and methods
Study design and dataset
This retrospective, single-institution analysis used planning system exports collected over a 10-year period (2016-2025), comprising 1,850 fractions from 1,008 treated patients with localized prostate cancer. The analysis was performed at the level of individual treatment fractions, because the available planning system export records dosimetric parameters on a per-fraction basis, and HDR prostate brachytherapy fractions are planned independently with fraction-specific implant geometry and optimization. Fractions from the same patient may not be statistically independent; this within-patient clustering was considered by incorporating patient identifier as a random effect in multivariable mixed-effects regression models (section 2.5), which separated the variance attributable to between-patient differences from the effect of needle number. Clinical characteristics, including tumor stage, Gleason grade, and pre-treatment prostate-specific antigen (PSA) were not available in the planning system export used for this analysis, which are acknowledged as a study limitation.
Treatment technique
All treatments used an iridium-192 HDR source delivered with a remote afterloader (GammaMedplus iX, Varian Medical Systems Inc., Palo Alto, CA, USA). Implantation and image guidance were transrectal, ultrasound-based. Dose calculations were performed using TG-43 water-based formalism, as implemented in Vitesse™ planning system [11]. Transrectal ultrasound image slice thickness was 1 mm, and dwell position step size was 5 mm throughout the study period. Treatment plans were generated by inverse planning with dwell time optimization using Vitesse™ planning system (v. 3.0 and v. 4.0, Varian Medical Systems). Inverse planning was performed with volumetric and geometric optimization (VEGO) algorithm, implemented within Vitesse™ planning system. Institutional planning rules and institutional constraints prioritized adequate target coverage while respecting OAR dose-volume constraints, consistent with GEC-ESTRO ACROP [3] and ABS [4] recommendations: prostate D90% ≥ 100% Rx, prostate V100% ≥ 95%, urethra D1% ≤ 130% Rx, and rectum D30% ≤ 60% Rx. Final plans were approved by the treating radiation oncologist, following iterative adjustment. No rectal spacers were applied during the study period; rectal dose sparing was achieved exclusively through posterior dwell time modulation and optimization. A sensitivity analysis comparing key dosimetric parameters before and after the software upgrade to version 4.0 (end of 2023) showed no clinically relevant differences in the direction or magnitude of the observed associations.
Needle number stratification
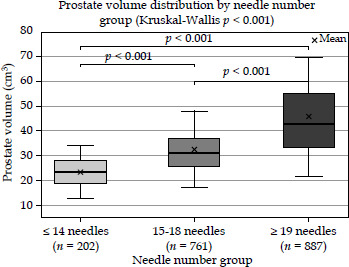
Fractions were grouped by the number of implanted needles into three groups based on the observed distribution of needle counts in full dataset (Figure 1), which demonstrated natural concentration ranges at ≤ 14, 15-18, and 19-24 needles reflecting routine volume-adapted clinical practice. These boundaries were not derived from a formal clustering algorithm, but represented clinically meaningful and data-driven strata consistent with the volume-adapted implant approach used at our institution (Table 1 and Figure 2): Group 1 (≤ 14 needles, n = 202 fractions), group 2 (15-18 needles, n = 761 fractions), and group 3 (19-24 needles, n = 887 fractions). Prescription doses per fraction were 11.5 Gy, 13.5 Gy, or 15 Gy, indicating institutional protocols used during the study period.
Fig. 1
Histogram of needle numbers across all 1,850 HDR prostate brachytherapy fractions (2016-2025). The distribution shows three naturally occurring clusters corresponding to the defined needle-number groups: ≤ 14 needles (n = 202), 15-18 needles (n = 761), and 19-24 needles (n = 887). The majority of fractions were planned with 15-24 needles, consistent with volume-adapted implant practice
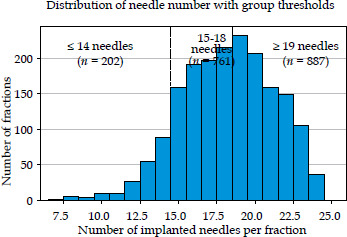
Table 1
Dosimetric parameters and prostate volume stratified by needle number group, with between-group comparisons (Kruskal-Wallis test, and Dunn post-hoc with Bonferroni correction)
Fig. 2
Scatter plot of prostate volume versus needle number per fraction. Each point represents an individual treatment fraction. The fitted LOESS trend line demonstrates the strong positive association between gland size and implant catheter density (Spearman ρ = 0.79, p < 0.001), reflecting volume-adapted implant practice
Dosimetric endpoints
All DVH metrics were normalized and reported as a percentage of the prescription dose (%Rx) to ensure comparability across fractionation schemes. Prostate DVH metrics evaluated were V200%, V150%, V100%, D90%, D50%, and D1%. Urethral metrics were D90%, D30%, and D1%. Rectal metric was D30%. Organ volumes, such as prostate, urethra, and rectum were also documented.
Statistical analysis
Most metrics were non-normally distributed (Shapiro-Wilk p < 0.05). Kruskal-Wallis test was applied for between-group comparisons, whereas post-hoc pairwise comparisons used Dunn’s test with Bonferroni correction. Spearman’s rank correlation coefficient (ρ) was employed for correlations. Given the large sample size, statistical significance was interpreted as evidence of association rather than clinical relevance, and emphasis was placed on the magnitude and direction of effects (effect sizes reported as ρ and β coefficients) (Table 2).
Table 2
Spearman’s rank correlations between needle number and key dosimetric parameters across all 1,850 treatment fractions
A sample size analysis was performed using one-way balanced ANOVA power calculation (k = 3 groups, effect size f = 0.4, α = 0.05). With n = 600 fractions per group, the achieved power was 1.0, confirming that the present dataset was adequately powered to detect medium-to-large effects. The smallest group (≤ 14 needles, n = 202) yielded power > 0.99 for the observed effect sizes.
To account for within-patient clustering of treatment fractions, multivariable mixed-effects regression models were fitted with patient identifier as a random effect, and needle number and prostate volume as fixed effects. In Table 3, confidence intervals (95% CI) for all β coefficients are presented. A sensitivity analysis restricted to a single randomly selected fraction per patient was also done to assess the robustness of findings. All analyses were performed using R (version 4.5), with packages lme4, dunn.test, and ggplot2.
Table 3
Multivariable mixed-effects regression analysis of key dosimetric parameters, unstandardized β coefficients (patient ID as random effect, and needle number and prostate volume as fixed effects)
Results
Patient and treatment characteristics
In the study, a total of 1,850 HDR prostate brachytherapy fractions from 1,008 patients were included (Table 1). Fractions were stratified by needle number into three groups: Group 1: ≤ 14 needles (n = 202 fractions, 10.9%), group 2: 15-18 needles (n = 761 fractions, 41.1%), and group 3: 19-24 needles (n = 887 fractions, 47.9%). The distribution of needle numbers across the full dataset is shown in Figure 1. Prostate volume differed significantly between groups (Kruskal-Wallis H: 619.66, p < 0.001), with higher needle counts used in larger glands; the median prostate volume was 23.9 cm3 (range, 7.4-53.0 cm3) in the ≤ 14-needle group, 31.6 cm3 (range, 8.2-89.3 cm3) in the 15-18-needle group, and 44.6 cm3 (range, 11.0-112.1 cm3) in the 19-24-needle group (Table 1, Figure 2).
Prostate dosimetry
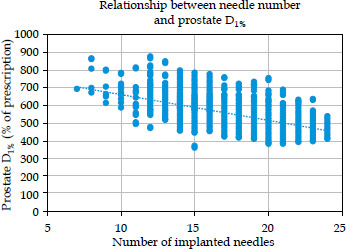
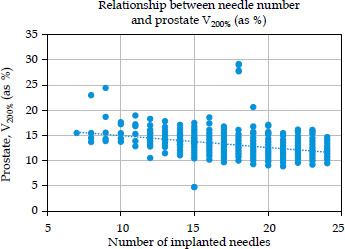
In contrast, high-dose DVH metrics (prostate V200% and D1%) decreased progressively with increasing needle number. The median prostate V200% fell from 14.33% (IQR: 13.7-15.2) in the ≤ 14-needle group to 12.41% (IQR: 11.5-13.4) in the 19-24-needle group. The median prostate D1% showed a more pronounced reduction, i.e., from 616% (IQR: 574-669) to 497% Rx (IQR: 468-534) across the same groups, a reduction of approximately 119% Rx representing improved intraprostatic dose homogeneity. All pairwise post-hoc comparisons were statistically significant (all p < 0.001). Spearman’s correlation confirmed moderate-to-strong negative associations for prostate V200% (ρ = −0.45, p < 0.001) and prostate D1% (ρ = −0.60, p < 0.001), consistent with improved dose homogeneity at higher implant catheter densities (Table 2, Figures 3 and 4).
Organ at risk dosimetry
Urethral dose exposure decreased with increasing needle number. The median urethra D1% fell from 129.5% Rx (IQR: 124-136) in the ≤ 14-needle group to 124.6% Rx (IQR: 122-129) in the 19-24-needle group (ρ = −0.22, p < 0.001; Figure 5A). All pairwise post-hoc comparisons were statistically significant (p < 0.001). The proportion of fractions with urethra D1% exceeding the institutional constraint of 130% Rx was the highest in the ≤ 14-needle group, consistent with the observed reduction in urethral peak dose at higher implant catheter densities. This relationship was particularly relevant for small prostate volumes (≤ 14 needles group, median volume of 23.9 cm3), where limited implant catheter density was associated with highest urethral D1% values and greatest proportion of fractions exceeding the 130% Rx constraint.
Fig. 5
A) Scatter plot of urethra D1% vs. needle number per fraction. A modest but consistent decline in peak urethral dose is observed with higher needle numbers (Spearman ρ = −0.22, p < 0.001). B) Scatter plot of rectum D30% vs. needle number per fraction. A modest positive association is observed with increasing implant catheter density (Spearman ρ = 0.17, p < 0.001), likely reflecting the confounding effect of larger prostate volume in the high-needle group
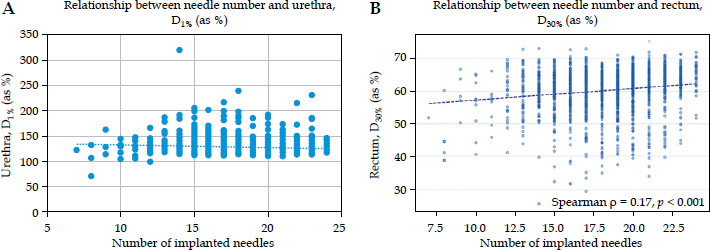
Rectal dose showed the opposite trend. The median rectum D30% increased modestly from 60.3% Rx (IQR: 55.8-64.5) in the ≤ 14-needle group to 63.0% Rx (IQR: 59.9-65.6) in the 19-24-needle group (ρ = 0.18, p < 0.001; Figure 5B). Post-hoc analysis revealed that the difference between the ≤ 14 and 15-18 needle groups was not significant (p = 0.52), while both comparisons with the 19-24 needle group were significant (p < 0.001). This rectal dose increase likely reflect the anatomical challenges of larger prostate volumes rather than a direct effect of needle number per se.
Multivariable and sensitivity analyses
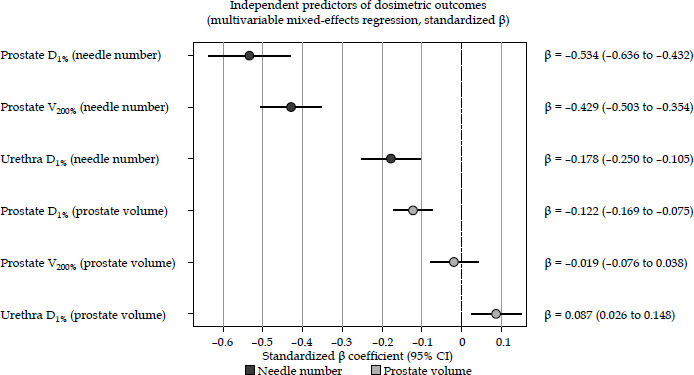
To account for clustering of fractions within the same patient, multivariable mixed-effects regression models were fitted with patient ID as a random effect, whereas needle number and prostate volume as fixed effects (Table 3). The needle number remained a significant independent predictor of all key dosimetric outcomes after adjustment for prostate volume. Each additional needle was associated with a reduction in prostate D1% (β = −12.77, 95% CI: −15.21 to −10.33, p < 0.001), prostate V200% (β = −0.23, 95% CI: −0.27 to −0.19, p < 0.001), and urethra D1% (β = −0.76, 95% CI: −1.07 to −0.45, p < 0.001). Prostate volume showed an independent negative association with prostate D1% (β = −0.57, 95% CI −0.79 to −0.35, p < 0.001), but did not significantly influence prostate V200% (p = 0.50). The forest plot of standardized β coefficients with 95% confidence intervals is presented in Figure 6.
Fig. 6
Forest plot of regression coefficients (β) with 95% confidence intervals from multivariable mixed-effects models. The independent associations of needle number and prostate volume with the investigated dosimetric endpoints is summarized. Larger standardized β coefficients for needle number indicate a stronger contribution to dosimetric variation than prostate volume
In a sensitivity analysis restricted to a single randomly selected fraction per patient (n = 1,008), the direction and statistical significance of all associations between needle number and key dosimetric parameters remained unchanged, confirming that within-patient clustering did not materially bias the main findings.
Discussion
The main finding of this retrospective single-institution study is that increasing needle number was associated with lower intraprostatic high-dose hot spots (V200% and D1%) and reduced urethral peak dose (D1%), while maintaining consistent target coverage (V100% and D90%). These associations remained statistically significant after adjustment for prostate volume in multivariable mixed-effects models, suggesting that catheter density itself contributes independently to improved dose homogeneity. To our knowledge, this is the largest single-institution dataset (1,850 fractions from 1,008 patients over a 10-year period) to confirm this association, with explicit adjustment for prostate volume as a key confounder, a methodological step largely absent in prior analyses. These findings are in line with previous cited research [6-9, 12], showing that implant catheter configuration and planning approach influence dose heterogeneity and high-dose DVH metrics (prostate V200% and D1%). In a CT-based prostate HDR dataset, Csányi et al. [7] specifically demonstrated that higher catheter numbers improve dose conformity and reduce hot spots, a finding directly supported by the present large-scale real-world analysis. Fröhlich et al. [6] similarly showed that implant catheter configuration significantly affects DVH parameters in HDR prostate boost treatments, while Batchelar et al. [10] highlighted the importance of adequate prostate coverage by catheter for consistent dosimetric outcomes.
From an optimization algorithm perspective, a higher needle number increases the geometric degrees of freedom available during plan optimization [13, 14]. Denser catheter insertion allows dwell positions to be distributed more uniformly throughout the prostate volume, reducing reliance on a limited number of high-weight dwell positions. This facilitates more effective dwell time modulation and spatial averaging of dose contributions, resulting in improved dose homogeneity and fewer localized high-dose regions. These effects are particularly relevant in HDR brachytherapy, where steep dose gradients make dose distribution highly sensitive to implant geometry.
Prostate volume was strongly associated with needle number, with larger glands treated by more needles, reflecting standard clinical practice. Importantly, needle number remained significantly associated with reduced prostate hot spots after adjustment for prostate volume, demonstrating that catheter density contributes independently to dosimetric improvement. Nevertheless, prostate volume should be considered when benchmarking plan quality and when correlating dosimetry with outcomes, a finding that warrants dedicated analysis accounting for prostate volume as a primary stratification variable. This finding applies equally to OAR dose metrics: the association between needle number and urethral D1% was also confirmed after volume adjustment, and the rectal dose increase with higher needle number is best explained by the confounding effect of larger prostate volume rather than by catheter density per se.
The reduction in urethral D1% with increasing needle number is clinically relevant. Urethral dose-volume parameters have been linked to acute and late genitourinary toxicity in HDR-based regimens: Olsën et al. [15] identified urethral D1% as a significant predictor of acute urinary toxicity in HDR single-fraction boost, while Akimoto et al. [16] demonstrated a dose-response relationship between urethral dose and genitourinary morbidity in combined HDR and EBRT schedules. The observed reduction in urethra D1% from 129.5% Rx (≤ 14 needles) to 124.6% Rx (19-24 needles) while modest in absolute terms, represents a clinically meaningful shift in the proportion of fractions approaching or exceeding the 130% Rx constraint threshold, and is expected to translate into reduced patient-reported urinary toxicity. Improved geometric flexibility with denser catheter insertion likely allows better spatial separation between high-dose regions and the urethra, facilitating adherence to urethral constraints. This is consistent with the contemporary framework of unified urethral constraint optimization proposed by Lu et al. [17] and novel urethra-sparing techniques, such as direction-modulated brachytherapy [18].
The magnitude of the observed dosimetric differences warrants clinical contextualization. The reduction in prostate D1% of approximately 119% Rx between the ≤ 14 and 19-24 needle groups, corresponds to a clinically meaningful reduction in intraprostatic hot spot intensity, with potential implications for late urinary toxicity [15, 16]. The reduction in urethra D1% of approximately 5% Rx is modest but consistent, and may become more relevant at the population level given the large number of fractions approaching the 130% Rx constraint. Whether these dosimetric differences translate into detectable differences in biochemical control or toxicity rates requires prospective clinical correlation, which was not available in the present dataset. Additionally, the placement of more catheters may carry a risk of increased acute procedural morbidity, including edema and discomfort. This potential trade-off is particularly relevant for the small prostate volume group, where fewer catheters are typically used and dosimetric margins for urethral protection are narrower. Therefore, this potential trade-off should be considered in clinical decision-making, and was not evaluable in the present dosimetric analysis.
Several limitations should be acknowledged. This was a retrospective, single-institution analysis at the fraction level, and fractions from the same patient were not statistically independent, a limitation addressed through multivariable mixed-effects modelling and a per patient sensitivity analysis. The results should be interpreted as descriptive associations rather than causal effects. Clinical outcome data, such as toxicity and biochemical control were not available, precluding direct correlation between dosimetry and patient outcomes. Clinical characteristics including tumor stage, Gleason grade, and risk group were not available in the planning system export. The large sample size ensures adequate statistical power, but increases the probability of detecting small associations that may not be clinically meaningful; effect sizes (ρ and β coefficients) should be considered alongside p-values. The study is limited to a single institution and a specific treatment planning rules and workflow, which may limit generalizability. The generalizability of findings should be confirmed in multi-institutional prospective datasets.
Conclusions
In this large, real-world retrospective analysis of 1,850 HDR prostate brachytherapy fractions, higher needle number was independently associated with a reduced prostate hot spots and lower urethral peak dose while preserving target coverage, a finding robust to adjustment for prostate volume and within-patient clustering. Prostate volume is a major determinant of needle number, and should be considered in institutional benchmarking and outcome-linked analyses. Our results provide a quantitative basis for volume-adapted implant catheter density strategies in routine HDR prostate brachytherapy, supporting the use of adequately dense catheter distributions, particularly in patients with larger prostate volumes, to improve dose homogeneity and reduce peak urethral dose. Future prospective studies correlating implant catheter density with clinical toxicity and biochemical outcomes are warranted to confirm the clinical translation of these dosimetric benefits.