Purpose
All current brachytherapy international best practice and consensus guidelines recommend that each high-dose-rate (HDR) brachytherapy source installed in a remote afterloading system has an independent reference air kerma rate (RAKR) or air kerma strength measurement performed using equipment that is regularly (biannually or triennially) calibrated at a recognized primary standards dosimetry laboratory (PSDL) or secondary standards dosimetry laboratory (SSDL), traceable to a PSDL [1-5]. This locally measured RAKR is then compared with the RAKR provided by the source manufacturer on the source certificate, with the source being acceptable for clinical use if the deviation between the measured and certificate values is less than 3% [2, 4-7].
Brachytherapy dose delivery accuracy is proportional to the accuracy of RAKR defined in an remote afterloading system. It is recommended that the locally measured RAKR is used to define the RAKR in the treatment delivery system, so that the department has a locally traceable value and uncertainty. The largest uncertainty in measured RAKR is the calibration coefficient of the measurement device used, typically a well-type ionization chamber (WIC) [5]. Over the past decade, Physikalisch Technische Bundesanstalt (PTB) laboratory in Germany (a PSDL) made 2 changes to their RAKR standards [8]. In 2018, PTB implemented the International Commission on Radiation Units and Measurements (ICRU) report 90 [9] recommendations, leading to a reduction of 0.34% to their iridium-192 (192Ir) calibration coefficient. In 2023, the incorporation of two new standard ionization chambers resulted in a further reduction of 0.83%. These changes were then adopted by Physikalisch-Technische Werkstätten (PTW) in 2023 [10]. In 2014, the National Physical Laboratory (NPL, UK) re-evaluated their correction factors, leading to a HDR 192Ir primary standard change of +0.26% [11]. In 2019, the NPL implemented ICRU report 90 recommendations and made a small adjustment to the density of dry air, causing a +0.03% change in correction factors [11]. With all other things being equal, any of these changes will result in a systematic shift of an individual clinic measurement of RAKR at the time the revised calibration coefficient was provided. University of Wisconsin Accredited Dosimetry Calibration Laboratory (UWADCL) have not made any changes to their specifications in the last decade.
In 2024, an upwards trend in the discrepancy between the manufacturer’s source certificate and the locally measured RAKR was observed in a single clinic. This initiated discussion with other clinics in the Australasian region as well as the United Kingdom, which indicated that this drift had been observed across a wider network. An increasing discrepancy was also reported by Vijande et al. [10] in clinics across Europe. This paper presented analysis of the RAKR data across 33 clinical sites spanning almost two decades. A long-standing temporal trend in RAKR discrepancies was identified for clinics beyond Europe, possible confounding factors were discussed, and recommendations on future process of change were provided.
Material and methods
Survey
A survey was distributed to 192Ir HDR brachytherapy clinics within Australia, New Zealand, the United Kingdom, France, and Ireland via e-mail and the MEDICAL-PHYSICS-ENGINEERING jiscmail mailing list [12]. Clinics were requested to supply information on their source model and manufacturer, their dosimetry system used for RAKR measurement, including chamber model, calibration provider, and calibration history, calibration protocol followed, and their RAKR measurement history compared with the manufacturer’s measured value, as stated on the source certificate.
Data analysis
Data provided from survey respondents were collated. Mean percentage difference was calculated for each year, along with 95% confidence interval (CI). Linear regression analysis was performed for RAKR discrepancies as a function of time to assess long-term stability and identify any systematic drift. This was done for all sources across all clinics as well as for individual clinics, which enabled data to be analyzed independent of site-specific offsets. A statistically significant trend was defined as having a p-value less than 0.05. The analysis was performed for the whole time period and for specific time periods, as described in the results.
The majority of clinics had dosimetry systems calibrated at PTW, NPL, or UWADCL; the RAKR comparison data analysis was also stratified by traceability to these dosimetry labs.
Physikalisch-Technische Werkstätten implemented the updated calibration from PTB in November 2023, thereby introducing a systematic change of –1.17% for all RAKR measurements from dosimetry systems calibrated at PTW after this time. As such, data from clinics with a PTW calibration after this date were excluded from analysis to avoid any bias introduced by this systematic change.
Results
Responses were received from 33 clinics with 192Ir sources manufactured by Curium, including Australia (n = 11), New Zealand (n = 4), UK (n = 16), France (n = 1), and Ireland (n = 1). Several clinics received sources from other manufacturers prior to 2018, so these data were excluded from subsequent analysis presented to maintain consistency. Source models included Nucletron mHDR, Elekta Flexisource, GammaMed, Varian, and BEBIG.
In total, RAKR comparison histories of 10 clinics were obtained, with a WIC calibration from UWADCL, 16 from NPL, 6 from PTW, 1 from PTB, and 1 from Laboratoire National Henri Becquerel (LNHB). Two clinics reported a change in WIC calibration provider partway through their calibration history; data for these clinics were analyzed as separate series for each provider (total of 34 series). One clinic was traceable to the Australian Radiation Protection and Nuclear Safety Agency (ARPANSA) via their own farmer chamber calibration inter-comparison. This clinic was omitted from subsequent analysis, as only measurements traceable to a WIC calibrated at a standard lab were considered.
A total of 1,150 WIC RAKR comparisons from 32 clinics were assessed. RAKR comparison histories ranged from 2 to 19.5 years, with a mean length of 9 years.
Figure 1 displays the combined dataset, showing differences between the local measurement and the manufacturer’s certificate RAKR value for each source over time.
Fig. 1
Differences between local measurement and manufacturer’s (Curium) source certificate RAKR value. The solid circles represent the mean difference per year, the error bars indicate the 95% confidence interval for each year. The line between the solid circles is for visualization purposes only. The legend indicates the WIC calibration traceability for each measurement. The number of measurements per year is shown on the X-axis
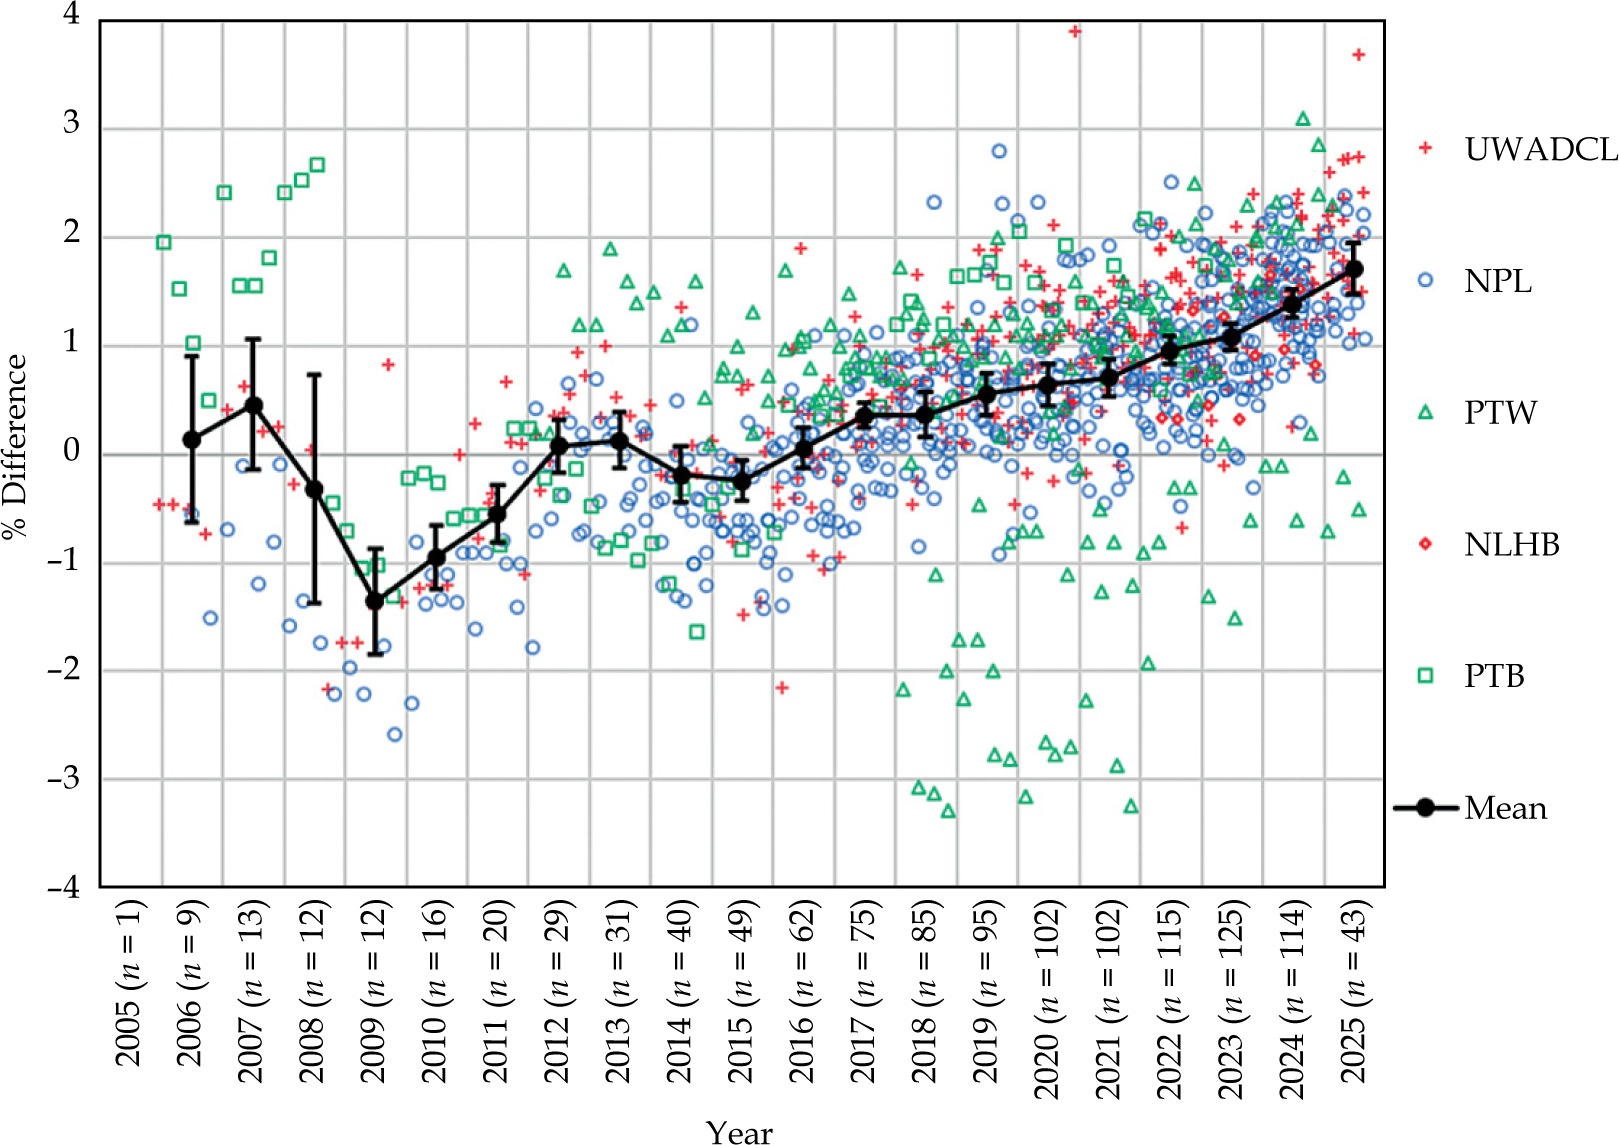
Linear regression indicated a negative slope (–0.9% per year, p-value = 0.0004) between 2007 and 2009; although the number of observations was low, hence the 95% confidence interval was large during this period.
Linear regression indicated a statistically significant positive slope (p = 2 × 10-104) in RAKR discrepancy from 2009 onwards, with an average increase of 0.15% per year. In 2009, the mean discrepancy was –1.4%, rising to –0.2% in 2015 and +1.7% by 2025. Due to the monotonic increase in average percent difference from 2015, data from 2015 onwards were also analyzed. Linear regression of the combined data from 2015 to 2025 yielded a statistically significant positive slope of 0.17% per year, with a p-value of 3 × 10-66 from 967 observations. It was also notable that the 95% confidence interval was constantly below 0.25% from this point.
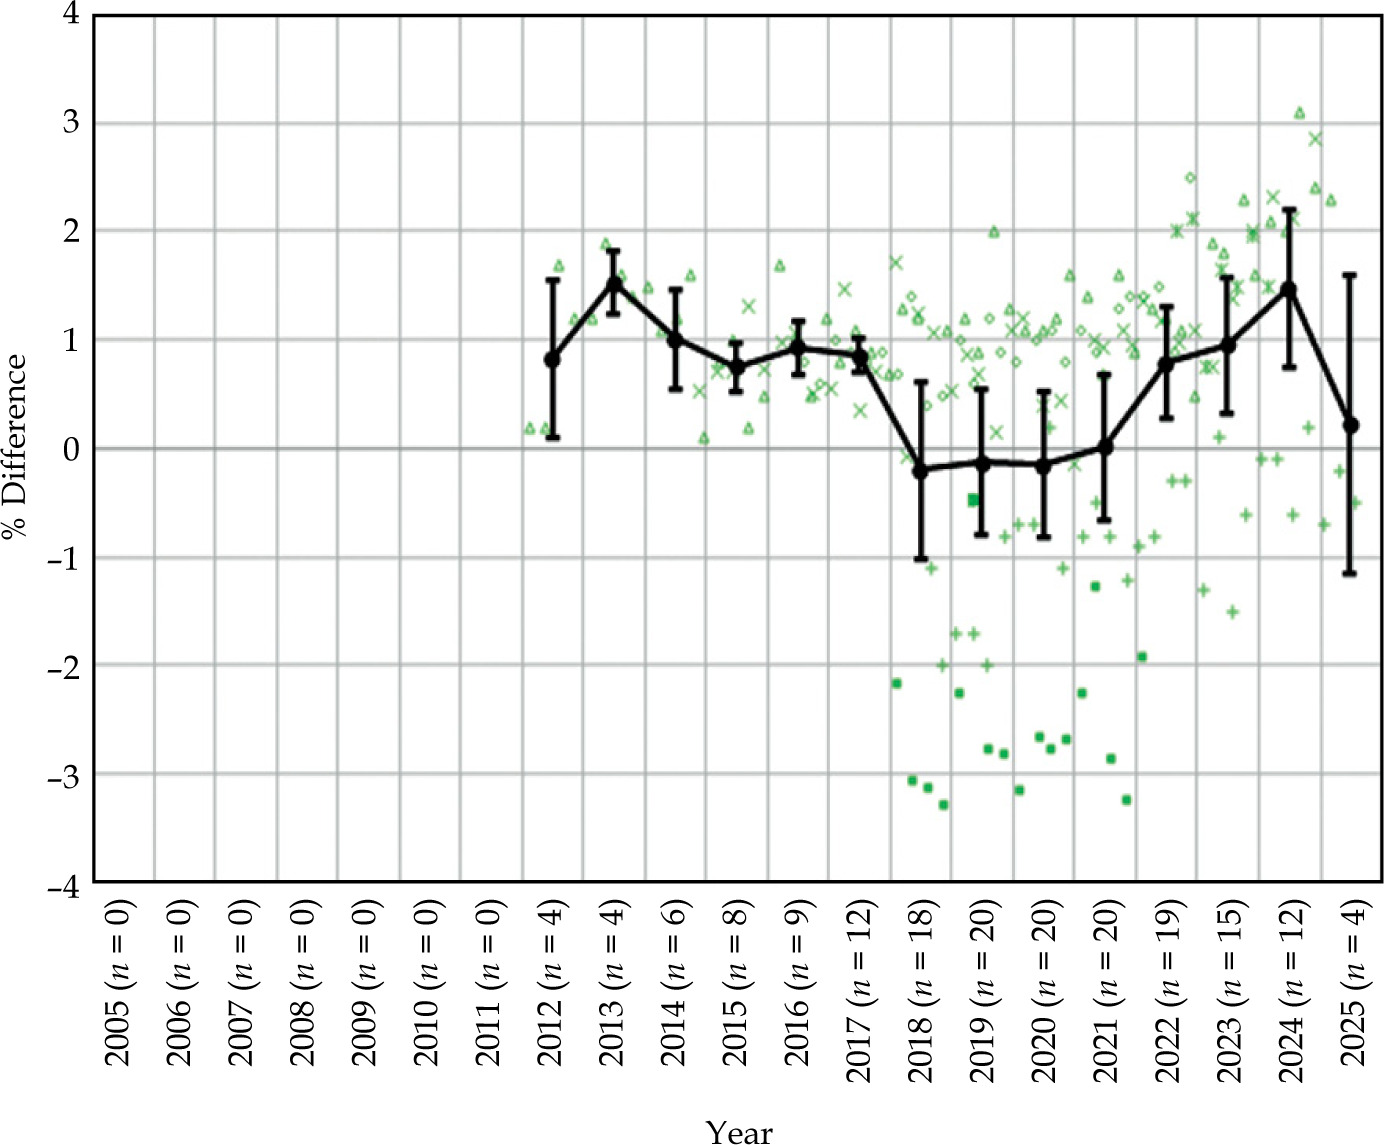
Figures 2 and 3 indicate the results for WICs calibrated at UWADCL and NPL. The linear trends between 2015 and 2025 were similar at +0.19% and +0.18% per year, respectively (p-values of 2 × 10-40 and 2 × 10-68, respectively). Figure 4 shows the results for WICs calibrated at PTW, for which a fitted linear trend between 2015 and 2025 did not reach significance (+0.06%, p-value = 0.14). The results of two clinics (solid square and “+” symbol) were offset compared with data from the other clinics. Both of these data series began in 2018, resulting in a drop in the overall mean value from that year onwards. Removal of the data of these two clinics from the combined PTW data resulted in a linear trend of +0.13% per year (p-value of 6 × 10-12).
Fig. 2
Differences between local measurement and manufacturer’s (Curium) source certificate RAKR value for well chambers calibrated at UWADCL. The solid circles represent the mean difference per year, the error bars indicate the 95% confidence interval for each year. The line between the solid circles is for visualization purposes only. Each clinic is represented by a separate symbol. The number of measurements per year is shown on the X-axis
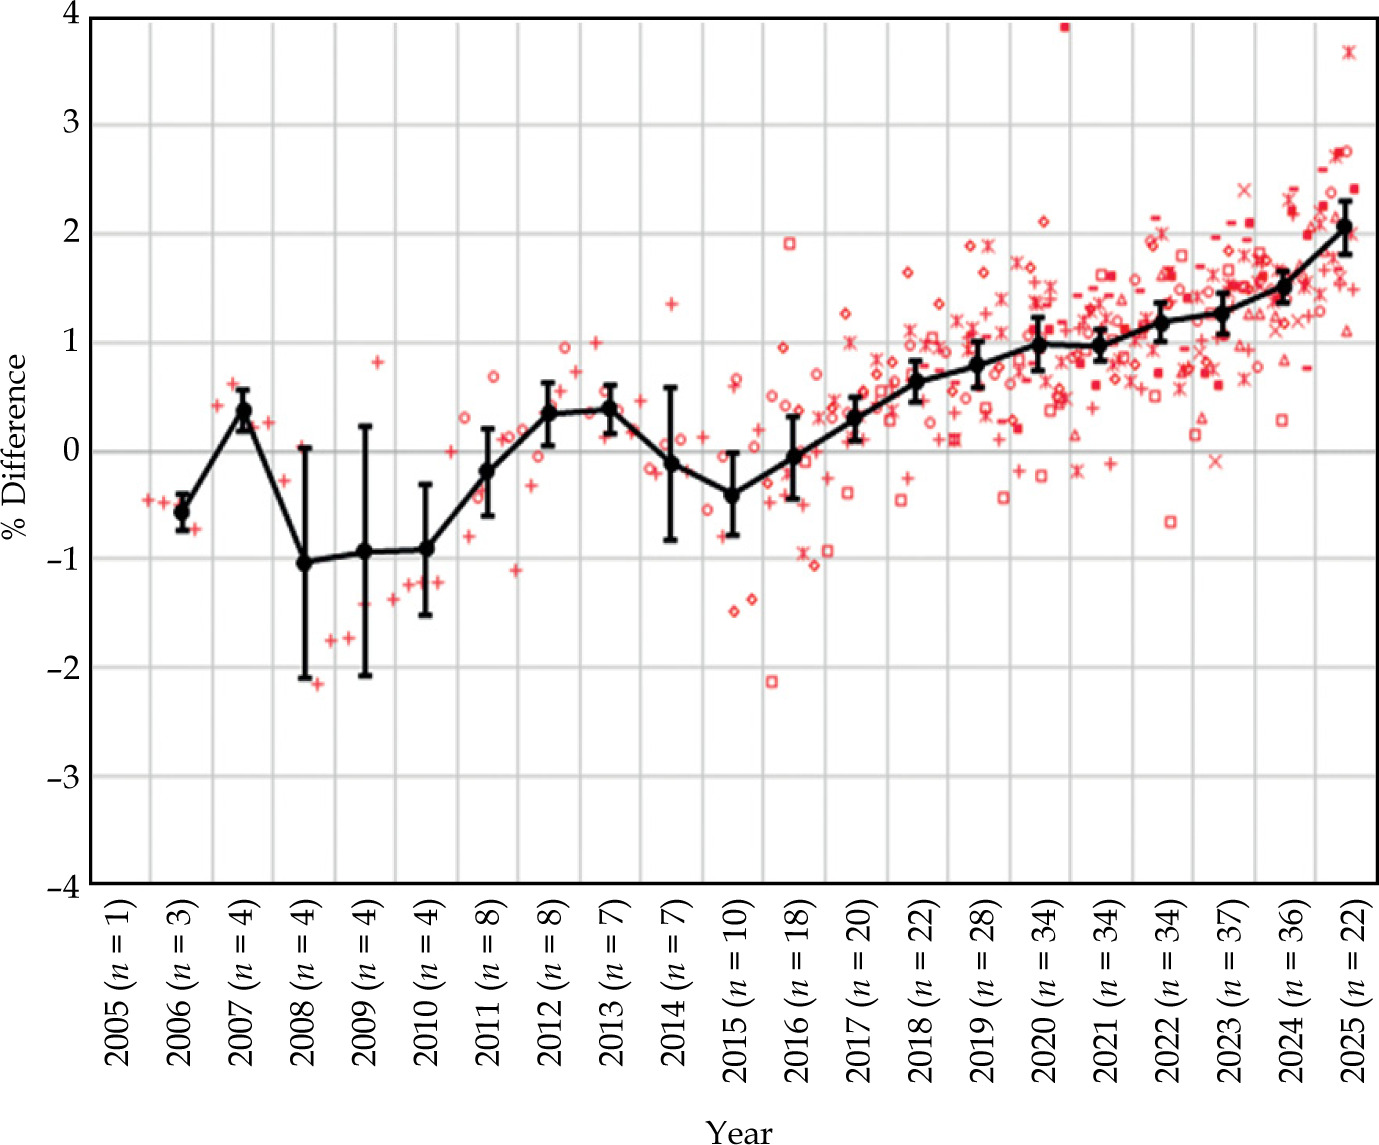
Fig. 3
Differences between local measurement and manufacturer’s (Curium) source certificate RAKR value for well chambers calibrated at NPL. The solid circles represent the mean difference per year, the error bars indicate the 95% confidence interval for each year. The line between the solid circles is for visualization purposes only. Each clinic is represented by a separate symbol. The number of measurements per year is shown on the X-axis
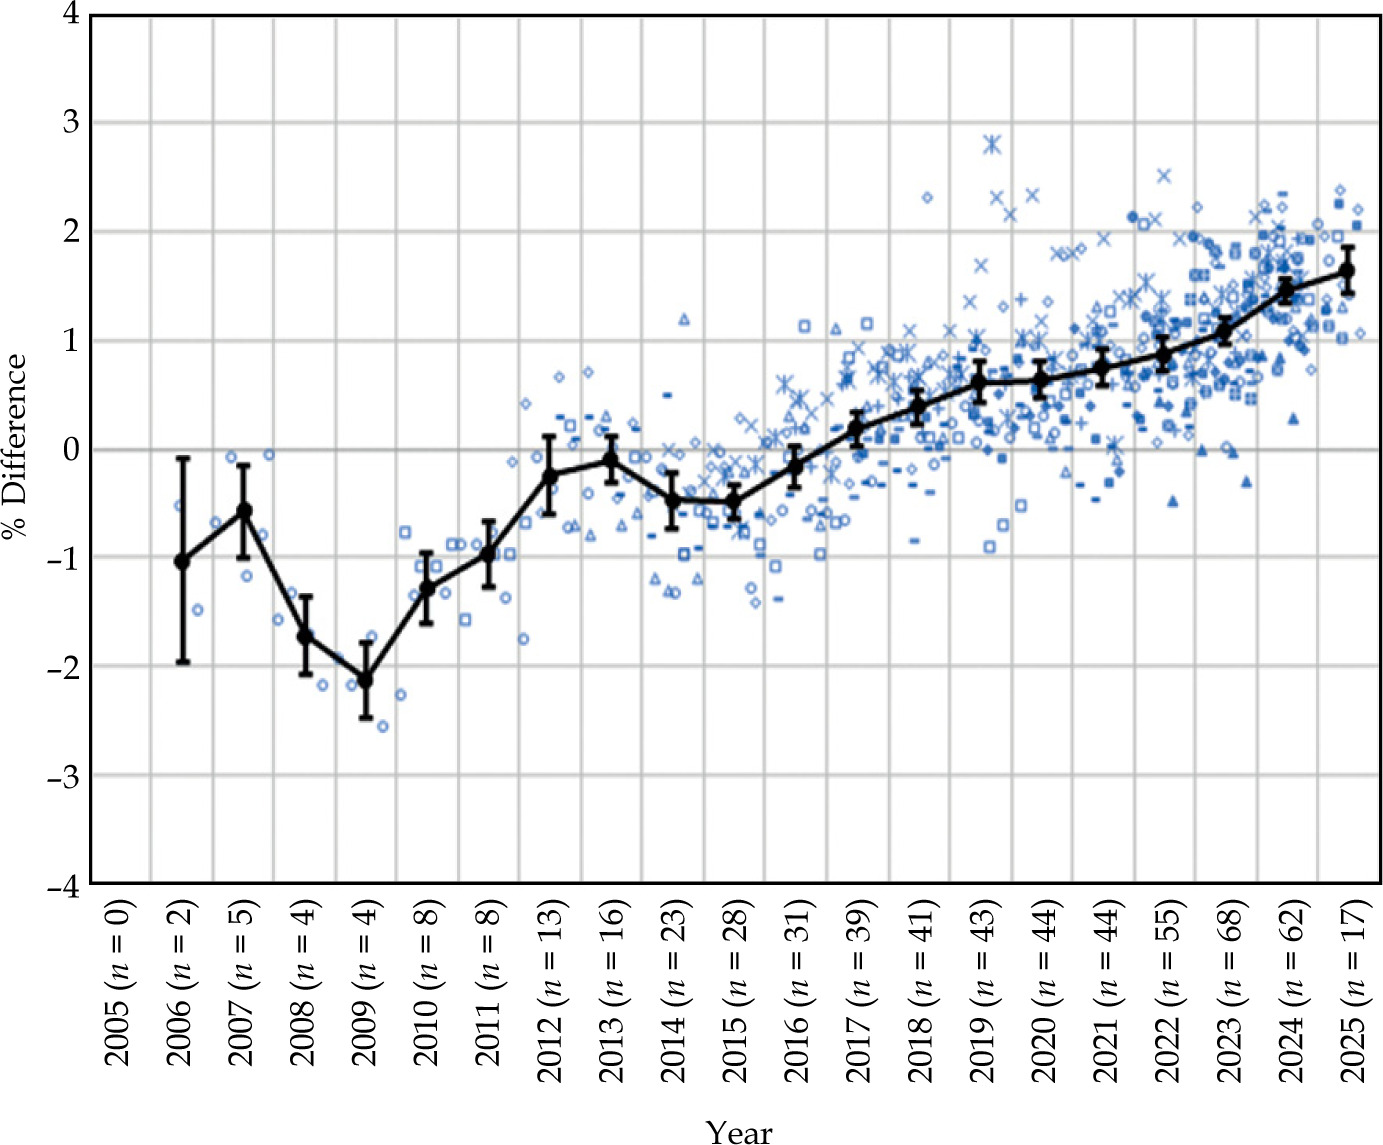
Fig. 4
Differences between local measurement and manufacturer’s (Curium) source certificate RAKR value for well chambers calibrated at PTW. The solid circles represent the mean difference per year, the error bars indicate the 95% confidence interval for each year. The line between the solid circles is for visualization purposes only. Each clinic is represented by a separate symbol. The number of measurements per year is shown on the X-axis
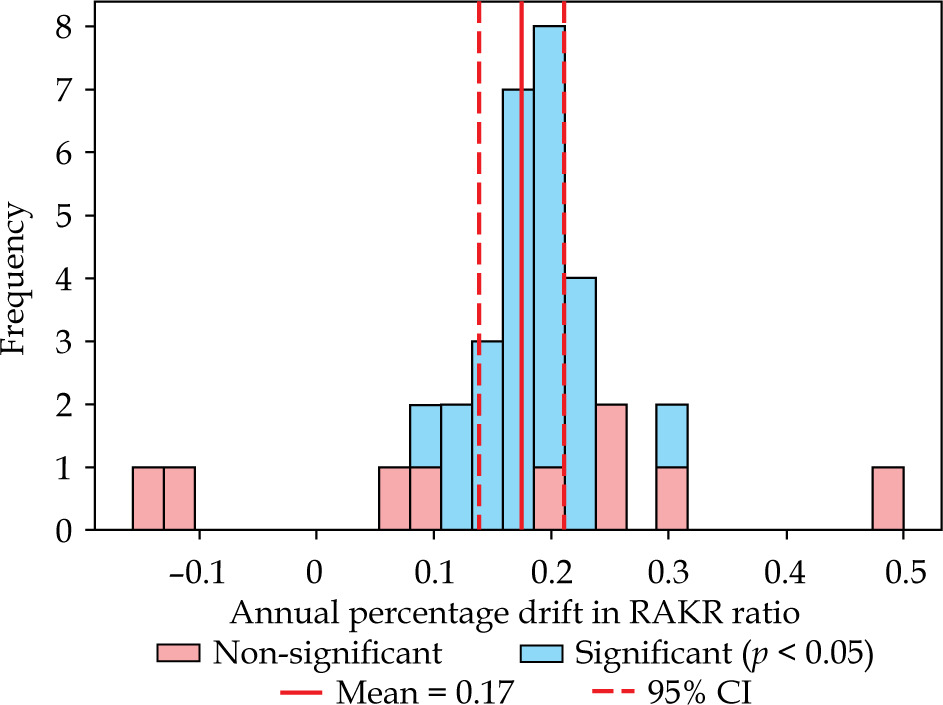
Linear regression analysis was performed on RAKR comparison data available from each clinic between 2015 and 2025. Of the 34 individual series, 25 showed a statistically significant positive trend, 7 showed a positive trend that did not reach significance, and 2 showed a non-significant negative trend. Figure 5 illustrates the distribution of the average annual percentage change of measured value compared with the source certificate RAKR value for individual series, showing the mean of the trends of 0.17% increase per year. Stratifying by traceability, the mean of the significant trends for individual clinics indicated a 0.19% annual increase for both UWADCL and NPL, and 0.13% annual increase for PTW.
Discussion
A statistically significant upward trend in the ratio of measured to source certificate RAKR values was identified from 2009 onwards. There has been a continuous increase in the mean discrepancy between local measurement and manufacturer’s certificate RAKR values since 2015. This trend was present for clinics with WICs traceable to different standards laboratories. The reduced 95% CI from 2015 onwards is likely due, in part, to the increased number of observations per year. When considering individual data series from each clinic, all significant trends had 20 or more observations, whereas all non-significant trends had fewer than 18 observations, suggesting the absence of statistically significant trends in the shorter series possibly due to an insufficient number of observations rather than temporal stability. Although the combined results for WICs traceable to UWADCL and NPL demonstrated a significant positive trend from 2015 onwards, the combined results for WICs traceable to PTW did not show a significant trend. When analyzed as individual clinics, 5 out of 6 PTW traceable trends were positive, all statistically significant. One trend was negative, although not significant (from 7 observations). Clinics traceable to other calibration laboratories showed a smaller spread in measured RAKR comparisons to the Curium source certificate value than those traceable to PTW. The lack of a significant trend for the PTW overall data can be attributed to two clinics having a large systematic offset compared with the mean, as shown in Figure 4. Both of these clinics demonstrated a significant trend when analyzed individually, and the removal of these series resulted in a significant trend overall for the remaining PTW data.
In 2023, the mean RAKR measurements for clinics traceable to NPL and PTB (via PTW) were 1.1% (95% CI: 1.0-1.2%) and 1.0% (95% CI: 0.2-1.6%) higher than the source certificate value reported by Curium, respectively. These values are consistent with those reported in key comparison of standards reported in 2023 by Bureau International des Poids et Mesures (BIPM) [8], where the PTB standard was found to be 0.23% lower than the NPL standard. This is noteworthy, as end user results reflect key comparison data and agree within the 95% confidence interval of one-another, however neither agree with the Curium reported RAKR. This suggests a systematic offset between Curium and PTB, to which they claim traceability as well as to end users from multiple traceability routes. The Groupe Européen de Curiethérapie – European Society for Radiotherapy and Oncology Advisory Committee on Radiation Oncology Practice (GEC-ESTRO ACROP) [13] recommend that manufacturers (or suppliers) should monitor the ratio between their own measurement and the RAKR measurement performed in clinics, in order to detect problems at either site early.
The negative shift between 2007 and 2009 is evident in previous publications [2, 14] over the same time period. Between approximately 2009 and 2014, the data reported by Nagappan shows a similar trend to that observed in this study. Vijande et al. [10] demonstrated a positive trend of 0.15% per year in RAKR discrepancies from 2018-2024 for 192Ir sources across Europe, similar to the value obtained in the current study. While Vijande et al. found a statistically significant positive trend in RAKR discrepancies over the period between 1997 and 2024, they found this trend only reached significance around 2018. In contrast, our data show that this trend began earlier and continues into 2025, affecting clinics beyond Europe, including the United Kingdom and Australasian countries, which received 192Ir sources from Curium. We are aware, through private communication, that Curium also manufacture and supply sources to many countries in Africa and Asia. The assumption is that the positive trend in RAKR discrepancies will exist globally across all clinics using 192Ir HDR sources manufactured by Curium.
Typical uncertainties associated with a realistic RAKR measurement at a hospital using a well-type chamber include long-term stability of the chamber, current measurement, source positioning, ion recombination factor, temperature, pressure, and humidity [5]. Added in quadrature, these amount to an approximate uncertainty of 0.8% in the local measurement. The source model correction factor was excluded, as this does not change between subsequent measurements. These factors alone could not explain the change in the mean discrepancy of 1.9% between 2015 and 2025. Indeed, as the distribution of uncertainties is believed to be gaussian in nature, a similar drift observed by all the clinics with more than 20 observations (5 years of data) would be highly unusual. Well chambers are recognized as having a stable response over many years [15]. Although not a primary aim of this study, several clinics provided their history of well chamber calibration coefficients, of these the largest standard deviation across repeat calibrations was 0.2%.
Curium perform a biannual 192Ir HDR RAKR comparison with PTB, in accordance with requirements [16] to remain on the joint AAPM/IROC source registry [17]. Curium state their tolerance of ±2.5% for this comparison based on PTB’s relative expanded uncertainty of 2.4% (k = 2) (private correspondence). For comparison values within this tolerance, no change is made to Curium’s RAKR calibration. Using this approach, Curium have not updated their calibration coefficient since 1996 [10]. Curium claim this is to “avoid change within the measurement uncertainty” despite allowing variable discrepancy up to ±2.5% to the standards to which they claim traceability and despite changes to PTB’s stated standard uncertainty over that period. The International Atomic Energy Agency [5] suggests adding similar discrepancies in quadrature to the uncertainty budget when estimating the total measurement uncertainty. This raises questions around the stated uncertainty on source certificates issued by Curium. To our knowledge, Curium have not disclosed their uncertainty budget or how their expanded uncertainty is derived.
Curium declared that their most recent 192Ir RAKR comparison with PTB (post-updates to the primary standard) was within 0.2% and as such, Elekta have recommended users to perform RAKR measurements with a WIC traceable to PTB (private communication). As mentioned previously, PTW adopted PTB calibration changes (totaling –1.17%) in November 2023. Users with WIC calibrations from PTW will therefore only see this systematic change in RAKR for WIC calibrations dated after this. For most clinics with PTW WIC calibrations included in our survey (Figure 4), this would improve agreement with Curium’s source certificate RAKR. However, as the upward trend in RAKR discrepancy pre-dates changes to PTB and PTW as well as impacts users traceable to other labs, we disagree with the hypothesis that these changes are temporally correlated with changes to metrology standards, to which Curium have attributed the global drift-trend. As such, while updating WIC calibrations may reduce the RAKR discrepancy for PTB traceable clinics, this does not address the underlying cause for the global drift compared with Curium. Changes to the NLP standard in 2014 will have increased locally measured RAKR in clinics following re-calibration of their WICs after this date. While this may have influenced the RAKR discrepancy trend presented here, it is anticipated to impact data no later than 2018 (based on triennial calibration recommendations for UK clinics). The magnitude of this 0.26% change is of the order of 1-2 years observed drift, and does not account for the continued RAKR discrepancy observed till now. The latter change to the NLP standard is insignificant in comparison with the total measurement uncertainty.
Whilst all the RAKR discrepancies in the data presented fall within the recommended 5% action limit [2, 4, 5, 7, 18, 19] and source certificate uncertainty (k = 3) stated by Curium, there are instances where the difference is larger than the commonly accepted 3% tolerance warranting investigation [2, 4-7]. Some of these recommendations, including those from IPEM and ACPSEM, state that the user’s measured RAKR should be applied for source strength specification in clinical treatment. Poor compliance with this recommendation was found in the Australian setting, with majority of clinics employing the source certificate RAKR value instead [20]. This may be attributed to misplaced confidence in the traceability and accuracy of source certificate RAKR values, or due to the lack of 192Ir standards in the region, resulting in less frequent WIC calibration for these clinics. The global trend in RAKR comparison data presented here support the recommendation that the source certificate RAKR should not be used for clinical treatment. Furthermore, the utilization of a confirmatory check of the source strength with a tertiary local standard, as recommended by TG-56 [1] and endorsed by IPEM [2], should be considered.
Currently, Elekta Flexitron treatment systems display the percentage difference between the source certificate and locally entered RAKR values (shown as ‘certificate deviation’). If this exceeds a ±3% tolerance, the value is displayed in red text. If the discrepancy is greater than ±5%, the entered RAKR is not accepted by treatment system [21]. One clinic reported that Elekta provided a script to change the system tolerance to ±4% in response to locally measured and independently verified RAKR greater than 3% from the source certificate value (private correspondence). If unaddressed and the current drift continues, such occurrences are likely to increase in frequency and severity, as clinics can expect discrepancies above 3% and eventually 5% to occur.
Recommendations have been published [13] for RAKR measurements performed in clinics. These include using vented WICs brought to equilibrium with the surrounding air rather than pressurized WICs due to potential for leakage of gas over time, resulting in a change in sensitivity. Also, pressurized chambers often have thicker walls required for pressurization, leading to high-energy dependence. WICs should be calibrated every 2 or 3 years at a PSDL or SSDL. This ensures traceability with the intent of reducing uncertainty and maintaining constancy of calibration. They state that the manufacturers’ measurement is subject to the same recommendations as those performed in the clinical setting, and should use equipment traceable to appropriate standards [13]. Curium, however, employ a Veenstra shielded, pressurized WIC [10], which has been regularly inter-compared with the PTB standard. However, the calibration coefficient has not been updated since 1996 [10], even following the updates at PTB. This type in inter-comparison does not meet the guidelines set by the IAEA for a well-type chamber dosimetry system calibration. Veenstra (now Comecer) manufacture dose calibrators for use in nuclear medicine, and such chambers have less stringent requirements in terms of short- and long-term reproducibility than chambers designed for brachytherapy HDR sources [5, 22, 23]. Although the VIK-202 and VIK-203 chambers (used by Veenstra) have specifications tighter than those set out in the guidance (for instance, reproducibility over 24 hours is stated at ±1%), this does not meet the IAEA recommendations for brachytherapy (short-term reproducibility = 0.1%, long-term stability < 0.15%), resulting in a larger uncertainty than might otherwise be achievable.
Such a large uncertainty, combined with the current offset between user and manufacturer of RAKR, risks users losing confidence in the manufacturer’s value. This could lead to a real 3-4% measurement error being accepted if the certificate value is suspected to be inaccurate. By utilizing a vented reference class dosimeter, regularly calibrated at a PSDL with the same model source, a much tighter uncertainty, closer to 3% (k = 3), could be expected from the Curium source certificate [5].
Conclusions
This study shows a trend between locally measured and manufacturer’s source certificate RAKR for 192Ir sources produced by Curium. This trend is independent of traceability of the local WIC to a primary standard, and an increasing difference has been evident since 2015 across multiple countries. The Curium calibration chain does not appear to meet the expectations placed upon them by the brachytherapy community. Improved clarity in the Curium equipment, calibration process, and frequency of calibration as well as collaboration with primary and secondary standards laboratories and end users, may help identify the origin of the trend and improve confidence in the certificate of RAKR value. If such changes cannot be made and the trend continues, brachytherapy societies may need to re-visit the requirement for the local measurement to be within 3% of the manufacturer’s certificate for RAKR.
There may be benefits in having an independent WIC traceability for end users. It can help reveal problems that may arise within calibrations and, if desired, allowing users to choose a calibration with a smaller uncertainty. There is currently no evidence that proves having a well chamber traceable to a different standard than a manufacturer could induce a large difference, let alone a trend. Regular national and international audits of RAKR measurements may have a role in ensuring that HDR 192Ir RAKR dosimetry remains consistent.