
Purpose
Artificial intelligence (AI) is now a key component of medical research, with radiation oncology being a leading proponent of its incorporation into new technology [1]. Many review articles evaluated AI in radiation oncology [2-16]. Algorithms have demonstrated a decrease in the time needed for treatment planning, contouring, and image processing for radiation therapy treatments [9]. Dose prescription [17], image registration [9], tumor segmentation [18], and treatment validation [19], have been performed by AI in radiation oncology with similar or improved performance when compared with humans.
It is predicted that AI tools applied to external beam radiation therapy can potentially solve brachytherapy (BT) treatment challenges with proper adjustments [20], but data on the subject is sparse. BT treatment has several challenges, including long planning time, consistency across planners, and correct identification of target structures [1]. BT, like other forms of radiotherapy, relies on the performance of many repetitive and automatable tasks. AI has the potential to refocus experts talents on more complicated, manual tasks while increasing the accuracy and efficiency of BT treatment. Clinicians and patients would benefit from the use of AI in BT, as it has already been partially applied from planning procedures to treatment [20], with the potential to improve treatment quality on all fronts.
While many studies evaluate the use of AI in radiation oncology, there is no single comprehensive, systematic overview regarding the clinical use of AI in all aspects of BT treatment planning, treatment, imaging, and prognosis. At present, only eight review papers exist on the use of AI in BT [6, 7, 20-25], including recent works by Chen et al. [6] and Fionda et al. [25], which largely provide narrative overviews but are limited in scope. For example, Fionda et al. emphasized AI in interventional radiotherapy primarily from a patient-centered perspective, while Chen et al. summarized technical applications across planning and imaging. One review focused solely on the applications of deep learning [21]. However, neither followed the Preferred Reporting Items for Systemic reviews and Meta-Analyses (PRISMA) methodology, nor did they conduct a systematic, multi-database literature search or provide detailed extraction of study-level performance data. In the current study, a systematic, comprehensive review of AI in BT literature was conducted, and analyzed investigating application to BT, AI description, training and testing datasets, input and output of AI, treatment description, ground truth classification, accuracy compared with ground truth, and time for results. Comparison of the use of AI techniques to each other and to standard-of-care conventional BT in terms of efficiency, accuracy, and practical application, was also performed when possible.
Material and methods
Literature search
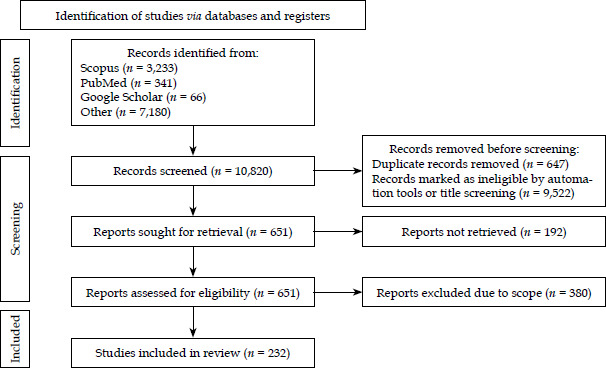
This systematic review followed the guidelines described in PRISMA (Figure 1). Inclusion criteria for literature searches included any peer-reviewed journal articles published from January 1, 1980 till August 1, 2025 in PubMed, Google Scholar, Cochrane Library as well as University of Iowa and University of Texas library catalogs. These databases were selected for their comprehensive biomedical and clinical coverage. Scopus was not included, since preliminary search showed substantial overlap with the above sources. Searches included “Brachytherapy” in combination with one or more of the terms “Artificial Intelligence”, “Deep Learning”, “Machine Learning”, “Neural Networks”, “AI”, “DL”, “automation”, “radiomics”, and “convolutional”. Selected bibliographies, citations, and meetings or presentations were also explored for relevant papers. Studies were excluded if no English version was available, they were not peer-reviewed, or if they were unrelated to AI in BT. Exclusions were performed using built-in automated filters of each database (publication date, English language, peer-reviewed journal articles, etc.). Studies only mentioning an application to BT with no elaboration or evidence were also excluded. Determination of inclusion was done by three independent investigators, who reviewed titles, abstracts, and articles. Data collected on each study included title, authors, year of publication, AI technique/method, AI application, disease site, and comparison (conventional BT vs. other AI-based BT methods).
Review and synthesis
Included studies were sorted by disease site and BT application. Training and testing dataset information, accuracy metrics, comparison with traditional techniques, and time for AI to produce output, were included if described clearly in a manuscript. A meta-analysis, a way of comparing a large number of studies quantitatively to find trends in data [26], was not performed in this paper due to studies being too heterogeneous. Heterogeneity arose from differences in disease site, applicator type, imaging modality (trans-rectal ultrasound [TRUS], magnetic resonance imaging [MRI], computed tomography [CT]), and AI methodology. Reported outcomes and performance metrics also varied widely ranging from Dice similarity coefficient (DSC)/Hausdorff distance (HD) for segmentation to AUC or DVH metrics for prediction and planning, with inconsistent ground truth definitions and validation approaches. Thus, these variations did not allow for a valid quantitative meta-analysis.
For the purpose of this review, AI was defined as a computer algorithm performing tasks, which usually require human intelligence [9]. We further categorize algorithms as deep learning (DL) or machine learning (ML). Machine learning was defined as a form of AI that did not involve neural networks, such as radiomics and unsupervised, supervised, and reinforcement learning techniques. Deep learning techniques included any approach using neural networks. Many of deep learning systems were convolutional neural networks (CNN), artificial neural networks (ANN), or variations of the two through mainly either U-Net architecture or residual networks (Res-Net) architecture. Artificial neural networks (ANNs) are used to describe fully connected, feed-forward models processing non-image inputs, such as radiomic, dosimetric, geometric, or clinical features. Convolutional neural networks (CNNs), by contrast, are architectures designed for image-based data, where convolutional filters and weight sharing enable the network to capture local spatial structure, and only the final layer is fully connected [27]. Accordingly, most image-driven applications in brachytherapy, such as segmentation or applicator localization, use CNNs, while ANNs are applied to structured or tabular data. In contrast to prior reviews of Chen et al. [6] and Fionda et al. [25], which provided primarily narrative overviews, our study applied these operational definitions to a PRISMA-guided, multi-database systematic review of AI in brachytherapy, and explicitly distinguished between algorithms evaluated retrospectively in pre-clinical settings and those tested in prospective or routine clinical use.
Results
Databases searches yielded 7,723 cumulative results. A total of 7,231 studies were excluded based on date restrictions, language, not being a peer-reviewed journal article, full-text of study unavailable, or duplicates. An additional 308 were determined to be out of scope after reviewing of the abstract or full-text, leaving 140 accepted, peer-reviewed articles included in the final synthesis, as shown in Figure 1. A total of 35 studies used machine learning AI techniques [28-61], and 179 employed deep learning [22, 24, 62-211].
AI in BT per application
We classified studies with a major separation of AI according to the steps required for types of BT planning and treatment. The category of applicator, needle, and seeds reconstruction, considered any reconstruction of applicator or needle studies, also referred as digitization or segmentation in the literature as well as seed localization studies. Papers on contouring or segmentation of organs and target volumes were categorized as “Segmentation”. One study was included in both the applicator reconstruction and segmentation sections [111]. Studies were considered in the “Dose calculation and optimization” category if AI was used in any part of dose calculation or dose optimization (e.g., optimizing dwell times and/or dwell positions) during treatment planning. Reports involving treatment planning that did not fit into any of the listed categories were classified as “Other treatment planning”.
AI in BT outcome predictions included studies on predicting side effects or toxicity, regression or relapse of disease, or survival rates after BT treatments. Scientific research applying AI to other aspects of imaging used in BT were classified as “AI in BT imaging”, and they could be further grouped as belonging to applications of AI in image registration, image-artifact removal, or another imaging application. Tables 1-5 present study characteristics and performance results sorted by each application of BT. Additional study characteristics and performance results are available in Appendices 1-5.
Table 1
Study characteristics and performance for applicator, needles, and seeds reconstruction
| Ref. | Author (year) | AI type | Disease site | Input dataset | Interstitial, intracavitary, or seeds | Performance error | Applicator/needles |
|---|---|---|---|---|---|---|---|
| [112] | Zhang (2021) | DL – CNN | Prostate cancer HDR | US | Interstitial | 0.44 ±0.83 mm | Plastic |
| [115] | Zhang (2021) | DL – CNN | Prostate cancer HDR | US | Interstitial | 0.33 ±0.36 mm | Plastic |
| [111] | Zhang (2020) | DL – CNN | Gynecological cancer HDR | CT | Intracavitary | Intrauterine tube: 1.9 ±0.5 mm; Left ovoid tube: 2.5 ±0.8 mm; Right ovoid tube: 2.4 ±0.7 mm; Cervical stopper: 3.1 ±1.6 mm; Left ovoid: 3.2 ±2.4 mm; Right ovoid: 2.9 ±2.6 mm | Titanium tandem and ovoid |
| [80] | Hu (2021) | DL – CNN | Prostate cancer HDR | US | Interstitial | n/a | Plastic |
| [68] | Dai (2020) | DL – CNN | Prostate cancer HDR | MRI | Interstitial | 0.37 ±1.68 mm | Plastic |
| [107] | Wang (2020) | DL – CNN | Prostate cancer HDR | US | Interstitial | Trajectory: 95.4% (x) and 99.2% (y) ≤ 2 mm Position: 94.2% (x), 98.3% (y), and 67.5% (z) ≤ 2 mm | Steel |
| [85] | Jung (2019) | DL – CNN | Gynecological cancer HDR | CT | Intracavitary | 0.64 mm | Titanium tandem and ovoid |
| [100] | Rodgers (2020) | DL – CNN | Gynecological cancer HDR | US | Interstitial | 1.03 mm | Steel |
| [86] | Jung (2019) | DL – CNN | Gynecological cancer HDR | CT | Interstitial | 0.63 ±0.41 mm | Steel |
| [79] | Hu (2021) | DL – CNN | Gynecological cancer HDR | CT | Intracavitary | 0.80 mm | Plastic tandem and ovoid |
| [108] | Zaffino (2019) | DL – CNN | Gynecological cancer HDR | MRI | Interstitial | 2.0 mm | Steel |
| [69] | Dai (2021) | DL – RCNN | Prostate cancer HDR | MRI | Interstitial | 0.62 ±1.83 mm | Plastic |
| [64] | Andersén (2020) | DL – CNN | Prostate cancer HDR | US | Interstitial | 0.55 mm | Steel |
| [47] | Younes (2021) | ML – SVM, ICP, SSD | Prostate cancer LDR | US | Seeds | 1.44 ±0.45 mm | n/a |
| [114] | Zhang (2020) | DL – RCNN | Prostate cancer HDR | US | Interstitial | 0.33 ±0.36 mm | Plastic |
| [113] | Zhang (2020) | DL – CNN | Prostate cancer HDR | US | Interstitial | 0.44 ±0.83 mm | Plastic |
| [76] | Golshan (2020) | DL – CNN | Prostate cancer LDR | US | Seeds | n/a | n/a |
| [101] | Sanders (2019) | DL – CNN | Prostate cancer LDR | MRI | Seeds | 0.19 ±0.04 mm | n/a |
| [39] | Nosrati (2018) | ML – unsupervised | Prostate cancer LDR | MRI | Seeds | 0.7 mm | n/a |
| [29] | Deufel (2020) | ML – clustering | Gynecological cancer HDR | CT | Intracavitary | 0.3 mm | Titanium tandem and ovoid |
| [32] | Hrinivich (2019) | ML | Gynecological cancer HDR | MRI | Intracavitary | Ring: 0.72 ±0.32 mm Tandem: 0.70 ±0.29 mm | Plastic tandem and ring |
| [127] | Shaaer (2022) | DL | Gynecological cancer HDR | MRI | Interstitial | 0.97 ±0.66 mm | Plastic |
| [122] | Liu (2022) | DL | Prostate cancer HDR | US | Interstitial | 2.0 mm | Metallic needle |
| [131] | Xie (2023) | DL | Gynecological cancer HDR | CT | Interstitial | n/a | Metallic needles |
| [130] | Weishaupt (2022) | DL | Prostate cancer HDR | CT | Interstitial | -0.1 ±0.6 mm | Metallic needles |
| [120] | Hanspach (2022) | DL | Prostate cancer LDR | MRI | Interstitial | n/a | n/a |
| [159] | Grigo (2024) | DL – 3D nnU-Net | Prostate cancer | MRI | Seeds | Mean centroid distance: 1.8 ±1.3 mm Mean local deviation: 0.9 ±0.9 mm | 125I seeds, titanium shell |
| [129] | Wang (2024) | DL – 3D nnU-Net with attention | Cervical cancer | CT | Interstitial | Tip error: 1.1 ±0.7 mm Shaft error: 1.8 ±1.6 mm (CNN + AG) | Stainless steel needles |
| [157] | Aleong (2024) | DL – 3D U-Net | Prostate cancer | MRI | Interstitial | Sub-millimeter to millimeters | n/a |
| [160] | Moradi (2025) | DL – GAN | Prostate cancer | CT | Interstitial | Shaft localization error: 0.41 mm Tip error: 0.68-0.72 mm | Plastic |
| [158] | Goulet (2025) | DL – 3D U-Net | Prostate cancer | US | Interstitial | Mean absolute error: 0.44 ±0.32 mm | Plastic needles |
| [161] | Qiu (2024) | DL – U-Net | Cervical cancer | CT | n/a | 0.03-0.22 mm | Metal source applicators |
| [171] | Kobayashi (2023) | DL – 3D U-Net | Prostate cancer | MRI | Interstitial | 0.9-4.9 mm | n/a |
| [133] | Yuan (2023) | DL – ResNet | Prostate cancer | Fluoroscopy | Seeds | n/a | Titanium seeds (125I) |
Table 2
Study characteristics and performance for organ at risk (OAR) and volume segmentation
| Ref. | Author (year) | AI type | Disease site | Input dataset | Performance, DSC (%) |
|---|---|---|---|---|---|
| [97] | Orlando (2020) | DL – CNN | Prostate cancer | US | 93.5 (91.1-94.6) |
| [63] | Anas (2017) | DL – CNN | Prostate cancer | US | 93.70 ±3.71 |
| [75] | Girum (2020) | DL – CNN | Prostate cancer | US | 88 ±3.0 |
| [73] | Girum (2020) | DL – CNN | Prostate cancer | US/CT | TRUS: 96.9 ±0.9 CT: 95.4 ±0.9 |
| [98] | Orlando (2020) | DL – CNN | Prostate cancer | US | 94.1 (92.6-94.9) |
| [88] | Karimi (2019) | DL – CNN | Prostate cancer | US | 93.9 ±3.5 |
| [90] | Lei (2019) | DL – CNN | Prostate cancer | US | 92 ±3.0 |
| [95] | Mohammadi (2021) | DL – CNN | Gynecological cancer | CT | Bladder: 95.7 ±3.7 Rectum: 96.6 ±1.5 Sigmoid: 92.2 ±3.3 |
| [102] | Sanders *highest performing (2020) | DL – FCN | Prostate cancer | MRI | T2 (T1)-weighted: Prostate: 90 ±4 (82 ±7) External urinary sphincter: 70 ±15 (17 ±15) Seminal vesicles: 80 ±12 (46 ±21) Rectum: 91 ±6 (87 ±6) Bladder: 96 ±4 (88 ±5) |
| [96] | Nouranian (2016) | DL – joint sparse dictionary learning | Prostate cancer | US | n/a |
| [110] | Zeng (2018) | DL – CNN | Prostate cancer | US/MRI | 90.9 ±2.2 |
| [91] | Lei (2021) | DL – CNN | Prostate cancer | US | Bladder: 75 ±12 Prostate: 93 ±3 Rectum: 90 ±7 Urethra: 86 ±7 |
| [74] | Girum (2019) | DL – CNN | Prostate cancer | CT/MRI | CT: 89 ±2 MRI: 93 ±12 |
| [92] | Liu (2019) | DL – DNN | Prostate cancer | CT | 85 ±4 to 88 ±3 |
| [82] | Iansten (2020) | DL – CNN | Gynecological cancer | PET | 80 ±3 |
| [77] | Gonzalez (2021) | DL – CNN | Gynecological cancer | CT | 88 ±2 |
| [84] | Jeuthe (2021) | DL | Pelvic bones | CT | 95 ±1 |
| [111] | Zhang (2020) | DL – CNN | Gynecological cancer | CT | Bladder: 86.9 HR-CTV: 82.9 Rectum: 82.1 |
| [134] | Zabihollahy (2022) | DL – CNN | Gynecological cancer | MRI | CTV: 0.85 ±0.03 |
| [135] | Zabihollahy (2021) | DL – CNN | Gynecological cancer | MRI | For MR1 test set: Bladder: 93 ±4 Rectum: 87 ±3 Sigmoid: 80 ±10; For MR2 test set: Bladder: 94 ±5 Rectum: 88 ±4 Sigmoid: 80 ±5 |
| [126] | Sanders (2022) | DL – CNN | Prostate cancer | MRI | n/a |
| [118] | Duan (2022) | DL – 3D U-Net | Prostate cancer | CT | Prostate: 83 ±5 Bladder: 93 Rectum: 85 Femoral heads: 96 Seminal vesicles: 72 Penile bulb: 53 |
| [125] | Sanders (2022) | DL – CNN | Prostate cancer | MRI | n/a |
| [121] | Huang (2023) | DL – M-Net model | Gynecological cancer | CT | n/a |
| [123] | Orlando (2022) | DL – CNN | Prostate cancer | US | Prostate (U-Net): 94.1 (92.6-94.9) Prostate (U-Net++): 94.0 (92.2-95.1) |
| [124] | Outeiral (2023) | DL – 3D nnU-Net | Gynecological cancer | MRI | n/a |
| [132] | Yoganathan (2022) | DL – residual neural network | Gynecological cancer | MRI | GTV: 62 ±14 HR-CTV: 85 ±6 IR-CTV: 75 ±6 Bladder: 90 ±5 Rectum: 76.±7 Sigmoid: 65 ±12 Small intestine: 54 ±12 |
| [57] | Peng (2022) | MP – H-ProSeg method | Prostate cancer | US | Prostate: 96.5 |
| [139] | Jiang (2021) | DP – RefineNet model | Gynecological cancer | CT | CTV: 86.1 Bladder: 86.0 Rectum: 85.8 Sigmoid colon: 66.4 Small intestine: 56.3 |
| [137] | Cao (2022) | DL – CNN | Gynecological cancer | CT | HR-CTV: Small group: 65 ±3 Medium group: 79 ±2 Large group: 75 ±4 |
| [141] | Li (2022) | DL – 3D nnU-Net | Head and neck cancer | CT | Auricula: 84.68 Condyle process: 90.67 Skin: 67.87 Mastoid process: 85.23 External auditory canal: 71.64 Mandibular ramus: 89.36 |
| [140] | Li (2022) | DL – 3D nnU-Net | Gynecological cancer | CT | HR-CTV: 83.6 ±7.0 Bladder: 93.6 ±5.1 Rectum: 83.1 ±7.4 |
| [142] | Ni (2023) | DL – 3D U-Net | Gynecological cancer | MRI | Bladder: 93 ±5 Rectum: 85 ±8 Sigmoid: 79 ±10 Small bowel: 73 ±17 |
| [138] | Guthier (2022) | DL | Prostate cancer | US | Prostate: 88 |
| [155] | Yan | Domain-adversarial neural network | Gynecological cancer | CT | HR-CTV: DANN model: 97 Basal model: 94 |
| [170] | King (2023) | DL – 3D nnU-Net | Prostate cancer | TRUS | 0.92 (IQR: 0.90-0.94) |
| [166] | Hampole (2024) | DL – 2D U-Net | Prostate cancer | TRUS | 97.0 (96.3-97.8)% |
| [172] | Kraus (2024) | DL – 3D U-Net | Gynecologic cancer | CT | DSC > 0.86 |
| [185] | Xue (2024) | DL – 3D U-Net with prompt mechanism | Gynecologic cancer | CT | HR-CTV DSC: 0.96 ±0.02 Rectum DSC: 0.91 ±0.02 Urethra DSC: 0.83 ±0.07 |
| [176] | Ni (2024) | DL – nnU-Net | Cervical cancer | MRI | Bladder DSC: 0.93 Rectum DSC: 0.84-0.87 Sigmoid DSC: 0.7-0.8 Small bowel DSC: 0.7 |
| [189] | Zhu (2024) | DL – SERes-U-Net (modified U-Net) | Cervical cancer | CT | 80.8% (CTV), 91.9% (bladder), 85.2% (rectum), 60.4% (sigmoid), 82.8% (bowel loops) |
| [186] | Xue (2024) | DL – 3D U-Net with prompt mechanism | Cervical cancer | CT and MRI | HR-CTV DSC: 0.92 ±0.03; Bladder DSC: 0.93 ±0.05; Rectum DSC: 0.87 ±0.03; Sigmoid DSC: 0.76 ±0.11 |
| [177] | Pal (2024) | DL | Cervical cancer | CT | n/a |
| [169] | Kim (2024) | DL-modified U-Net | Cervical cancer | MRI | n/a |
| [181] | Simões (2024) | DL | Cervical cancer | MRI | n/a |
| [187] | Zang (2025) | DL – AM-U-Net (Mamba-based) | Cervical cancer | CT | HR-CTV mean DSC: 0.862 Bladder DSC: 0.937 Rectum DSC: 0.823 Sigmoid DSC: 0.725 |
| [175] | Ni (2025) | DL – 3D nnU-Net | Cervical cancer | MRI | n/a |
| [188] | Zhang (2025) | DL – U-Net | Lung cancer | CT | n/a |
| [165] | Gu (2025) | DL – modified U-Net | Cervical cancer | CT | All OARs: 73.69% Bladder: 92.65% Rectum: 66.55% Colon: 61.86% |
| [174] | Lei (2025) | DL | Cervical cancer | CT | HR-CTV Dice: 0.79 ±0.06 Bladder Dice: 0.83 ±0.10 Rectum Dice: 0.76 ±0.15 Bowel Dice 0.63 ±0.22 Sigmoid Dice: 0.64 ±0.16 |
| [173] | Krupien (2025) | DL – modified U-Net | Prostatic and gynecological cancers | CT | Bladder U-Net++ median DSC: 0.95 (IQR: 0.04); Rectum U-Net++ median DSC: 0.87 (IQR: 0.09); Bladder nnU-Net median DSC: 0.96 (IQR: 0.03); Rectum nnU-Net median DSC: 0.88 (IQR: 0.10) |
| [182] | Tan (2025) | DL | Cervical cancer | CT | n/a |
| [167] | Kalantar (2025) | DL | Gynecologic cancers | MRI (MRI Linac) and synthetic CT | Bladder: 0.802 Small bowel: 0.733 Rectum: 0.765 Sigmoid: 0.544 Left femoral head: 0.905 Right femoral head: 0.915 |
| [163] | de Hond (2025) | DL – 3D nnU-Net | Cervical cancer | CT or CBCT | Rectum DSC: 0.88 (Ph-sCBCT), 0.81 (clinical CBCT); CTV DSC: 0.89 (Ph-sCBCT), 0.82 (clinical CBCT) |
| [184] | Wang (2025) | DL – modified U-Net | Prostate cancer | US | 94.98 ±5.00 |
| [162] | Bilski (2025) | DL – modified U-Net | Brain glioma | MRI | n/a |
| [179] | Rajendran (2025) | DL – vision-language transformer | Prostate, oropharyngeal carcinoma | CT, MRI, clinical data | Prostate GTV DSC: 0.81 ±0.10 CTV: 0.91 ±0.04 OPC GTV DSC: 0.77 ±0.11 |
| [183] | Vagni (2024) | DL – GAN | Prostate cancer | MRI | Internal: Rectum DSC: 0.83 Bladder DSC: 0.92 Femoral heads DSC: 0.94/0.93 External: Rectum DSC: 0.74 Bladder DSC: 0.92 Femoral heads DSC: 0.89/0.88 |
| [180] | Outeiral (2023) | DL – 3D nnU-Net | Cervical cancer | MRI | n/a |
| [178] | Peng (2023) | ML – CFBL + DMDE + GCPS hybrid | Prostate cancer | TRUS | Dice: 96.2 ±2.4% |
| [155] | Yan (2023) | DL | Gynecologic cancers | CT | Median: 0.97 |
| [168] | Kang (2023) | DL – GAN | Prostate cancer | CT | 0.84 ±0.05 (RO1), 0.85 ±0.06 (RO2), 0.81 ±0.07 (RO3) |
| [119] | Duprez (2023) | DL – 3D nnU-Net | Cervical cancer | CT | Bladder DSC: 0.92 ±0.04 Rectum DSC: 0.84 ±0.04 HR-CTV DSC: 0.81 ±0.05 |
| [164] | Duan (2023) | DL – 3D nnU-Net | Prostate cancer | CT | Prostate DSC: 0.82 SV DSC: 0.48 Rectum DSC: 0.92 |
| [128] | Wang (2023) | DL – CNN-based | Cervical cancer | CT | HR-CTV: 0.87 Bladder: 0.94 Rectum: 0.86 Sigmoid: 0.79 Small intestine: 0.92 |
Table 3
Study characteristics and performance for other planning and imaging applications
| Ref. | Author (year) | AI type | Disease site | Input dataset | Planning category | Performance metric | Performance statistic |
|---|---|---|---|---|---|---|---|
| [43] | Stenhouse (2021) | ML – feature selection, voting, tree-based ensemble | Gynecologic cancer | Geometric characteristics of HR-CTV | Applicator selection | Predictive accuracy | 91.5 ±0.9% |
| [66] | Buzurovic (2008) | DL – ANN, radial basis NN | Prostate cancer | TRUS | Insertion force tracking and prediction | Tracking error and predicted force error | < 1.0% and 4.5% |
| [83] | Jaberi (2017) | DL – ANN | Gynecological cancer | CT and dose distribution | Prediction of OAR DVH variations and a final plan | Mean percent error | Bladder: 5-18% Rectum: 6-21% Sigmoid: 6-28% CTV: 11-22% |
| [71] | Fan (2021) | DL – CNN | Gynecological cancer | CT and dose distribution | Plan verification | Error | Position: 5 mm Time: < 2% |
| [105] | Sina (2013) | DL – ANN | n/a | CT | Tissue mass-density composition determination | Error (mass density and dose calculation) | Bone: 0.52% Muscle: 0.95% Water: < 0.66% |
| [65] | Avila-Carrasco (2020) | DL – ANN | n/a | Force data | Estimation of brachytherapy 3D needle deflection | Prediction errors | 0.29 ±0.22 mm – 0.62 ±0.41 mm |
| [30] | Gotz (2017) | ML | Breast cancer | Electromagnetic tracking measurements | Removal of patient: Movement-related signals in reconstruction | Compared with human expert | n/a |
| [33] | Lee (2002) | ML – discriminant analysis, classification | Soft-tissue sarcoma | Catheter positions and thickness of PTV | Planning volume outlining | n/a | All cases considered clinically acceptable |
| [42] | Shiradkar (2016) | ML – radiomics | Prostate cancer | MRI | Dose reduction | Reduction to prescribed dose | 43% |
| [72] | Feleppa (2001) | DL – ANN | Prostate cancer | US data, spectrum-analysis results, clinical data, and the matching “gold-standard” biopsy | Tissue type classification to improve visualization of prostate tumors | ROC curve area | 0.804 ±0.052 |
| [78] | He (2020) | DL – GAN | Prostate cancer | Low resolution TRUS | Image construction | Mean absolute error and peak signal-to-noise ratio | 6.5 ±0.5 and 38.0 ±2.4 dB |
| [67] | Chen (2021) | DL – CNN | Prostate cancer | Paired MRI and US images and probability maps | Image registration | DSC | 0.97 ±0.00 |
| [109] | Zeng (2020) | DL – CNN | Prostate cancer | Paired MRI and TRUS images and prostate labels | Image registration | Target registration error | 2.53 ±1.39 mm |
| [81] | Huang (2018) | DL – RL-ARCNN | Gynecological cancer | CT | Metal artifact removal | PSNR | 38.09 |
| [62] | Allman (2018) | DL – CNN | n/a | Photo-acoustic data | Noise artifact identification | Success rate | No noise: 100% Added noise: 98% |
| [152] | Salehi (2023) | DL – CNN | Gynecological cancer | CT | Non-rigid image registration | Mean Dice index, mean average symmetric surface distance, and mean Jaccard | Mean Dice index: Cervix: 0.89 ±0.02 Bladder: 0.96 ±0.01 Rectum: 0.93 ±0.02 Mean average symmetric surface distance (mm): Cervix: 1.61 ±0.46 Bladder: 1.17 ±0.15 Rectum: 1.06 ±0.42 Mean Jaccard: Cervix: 0.86 ±0.04 Bladder: 0.93 ±0.01 Rectum: 0.88 ±0.04 |
| [147] | Ecker (2022) | DL – neural network | Gynecological cancer | T2 MRI | Predict applicator structure and rigid registration | Mean Dice coefficient, mean distance error between dwell positions (MDE) | Mean Dice coefficient: 3D NN: 0.70 ±0.07 2D NN: 0.58 ±0.04 MDE: 2.7 ±1.4 mm |
| [216] | Wang (2025) | DL | Prostate cancer | US | Plan quality prediction | Multiple | Prediction p-values: > 0.8 |
| [61] | Wang (2025) | DL – U-Net | Skin hemangioma | Photographic images of skin lesions | Automated lesion segmentation and personalized 3D mold design | DSC, error | Geometric accuracy: 98.78% (area) Area mean difference: 0.45 |
| [203] | Jiang (2025) | DL – CNN | Cervical cancer | CT | Applicator (Syed vs. T&O) selection in HDR brachytherapy | Accuracy, sensitivity, specificity | Accuracy: 96.0% Sensitivity: 90.9% Specificity: 97.4% |
| [202] | Hoffer (2023) | ML – KNN, SVM, K-means clustering | Cervical cancer | Thermal imaging | Detection of physiological changes after brachytherapy | Detection rate | 100% detection rate |
| [207] | Nakanishi (2023) | DL – GAN | Multiple | Gamma camera | Image denoising and super resolution (estimation of ideal source images for monitoring) | SSIM, MAE, FWHM difference | SSIM: 0.98 ±0.006 MAE: 2.2 × 10⁻³ ±1.0 × 10⁻³, FWHM difference: < 0.5 mm at 100 mm distance |
| [208] | Lee (2024) | DL – GAN based on U-Net architecture | Pelvis cancer | CBCT | Improving CBCT image quality | SSIM | ~70% increase in similarity index vs. FBP |
Table 4
Study characteristics and performance for prediction
| Ref. | Author (year) | AI type | Disease site | Input dataset | Clinical outcomes predicted | Performance metric | Performance statistic |
|---|---|---|---|---|---|---|---|
| [46] | Valdes (2018) | ML – decision trees and ensemble methods | Prostate cancer | Clinical parameters | Biochemical failure | Failure rate | 0.75 sHDR with selected features vs. 0.38 conventional population |
| [44] | Tian (2019) | ML – non-linear support vector machine | Gynecological cancer | Clinical parameters | Fistula formation | AUC, sensitivity, and specificity | 0.90, 97.1%, and 88.5% |
| [87] | Kaiserman (2005) | DL – ANN | Choroidal cancer | Clinical parameters | 5-yr. mortality | AUC | 0.81 |
| [116] | Zhen (2017) | DL – CNN | Gynecological cancer | Rectum dose distribution, planning images | Rectum toxicity | AUC, sensitivity, and specificity | 0.7, 70.8% to 72.1%, and 58% to 59% |
| [104] | Shen (2019) | DL – NIN | Gynecological cancer | FDG PET/CT | Local relapse and distant metastasis | Accuracy | Local: 89% Distant: 87% |
| [34] | Lee (2019) | ML – radiomics | Prostate cancer | MRI, apparent diffusion coefficient maps | Significant changes in post-external beam radiotherapy | Student t-test to determine significant features | n/a |
| [45] | Tsang (2019) | ML – radiomics | Prostate cancer | MRI, dose distribution | Stricture formation | p-value (cases vs. controls) | Dosimetry parameters: p > 0.05; Contrast and homogeneity: p < 0.05 ; Energy feature: p = 0.28 |
| [35] | Lee (2019) | ML – radiomics | Prostate cancer | MRI, apparent diffusion coefficient maps | Local recurrence | p-value (cases vs. controls) | 17 chosen features: p < 0.05 |
| [31] | Hao (2018) | ML – radiomics | Gynecological cancer, NSCLC | PET | Distant failure | AUC, sensitivity, and specificity | NSCLC: 0.82 ±0.03, 0.81 ±0.02, and 0.80 ±0.03 GYN: 0.83 ±0.02, 0.81 ±0.02, and 0.80 ±0.04 |
| [36] | Lucia (2019) | ML – radiomics | Gynecological cancer | Clinical parameters | Acute and late toxicity at different sites | Averaged sensitivity and specificity | Rectal acute: 78.0%, rectal late: 72.0% GU acute: 74.0%, GU late: 64.0% Vaginal acute: 73.0%, vaginal late: 78.0% |
| [40] | Reuze (2017) | ML – radiomics | Gynecological cancer | PET | Local recurrence | AUC and p-value | 0.63 to 0.76 and chosen features: p < 0.05 |
| [41] | Schernberg (2017) | ML – radiomics | Gynecological cancer | PET, blood count Analysis | Overall survival and local control | AUC | 0.753 |
| [28] | Bowen (2019) | ML – radiomics | Gynecological cancer | MRI/PET | Tumor response | AUC and p-value | SUV coefficient of variation: 0.79 and 0.011 ADC skewness: 0.86 and 0.001 |
| [145] | Cheon (2023) | DL – MLP | Gynecological cancer | Clinical parameters (patient, tumor, treatment, and dose feature groups) | Predicting late bladder toxicity | F score and AUROC | F1 score of 0.76, and AUROC of 0.81 |
| [54] | Luo (2022) | ML – random forest algorithm | Uveal melanoma | US follow-up records | 4-year risk of metastasis and death | AUC | AUC (three time follow-up): 0.846 |
| [48] | Abdalvand (2022) | ML – LASSO, Ridge, support vector machine (SVM), and random forest (RF) | Gynecological cancer | Physical metrics, dosimetric measures, and clinical parameters | Tumor response | AUC, sensitivity, specificity, and accuracy | AUC: 0.82 (0.95 CI: 0.79-0.93) Sensitivity: 0.79 Specificity: 0.76 Accuracy: 0.77 |
| [221] | Small (2023) | ML – SVM | Cervical cancer | MRI, clinical data | Progression-free survival | AUC | 0.77 |
| [220] | Ladbury (2024) | ML – random forest | Cervical cancer | Clinical data | Receipt of brachytherapy boost | AUC | AUC: 0.701 (2004-2020) AUC: 0.682 (2019-2020) |
| [218] | Dankulchai (2024) | ML – Cox proportional hazards model | Cervical cancer | MRI | Loco-regional recurrence | p-value, hazard ratio (Cox model) | Maximum intensity (p = 0.038, HR = 1.00199) |
| [59] | Portocarrero (2025) | ML | Gynecologic cancers | Clinical data | Grade 3 or higher toxicities (GI, GU, or vaginal) | F1 score, normMCC, accuracy | SVM: F1 = 0.63, normMCC = 0.75, Accuracy = 0.80; RF: F1 = 0.57, normMCC = 0.77, Accuracy = 0.85; LR: F1 = 0.52, normMCC = 0.71, Accuracy = 0.81 |
| [219] | Kong (2025) | DL | Cervical cancer | Clinical data | Radiation- induced vaginal injury | AUC | 0.9751 |
| [60] | To (2025) | ML | Prostate cancer | US | TCP, NTCP, patient- reported rectal and urinary symptoms | AUC, odds ratio (OR), mean difference | For diarrhea symptom (NTCP > 20%): Research plan: AUC = 0.75, OR = 8.9 (1.3-58.8) Clinical plan: AUC = 0.56, OR = 1.4 (0.2-9.0) For urinary control (NTCP > 15%): Research plan: AUC = 0.70, OR = 6.9 (0.6-78.0) Clinical plan: AUC = 0.51, no positive OR |
| [204] | Adleman (2025) | DL – nnU-Net | Prostate cancer | MRI | Biochemical failure, metastasis, acute and late grade 2+ genitourinary toxicity, IPSS symptom resolution | Dice coefficient, Pearson correlation, F1-score, HR, OR | Dice: 0.90; PV Pearson R: 0.99; GTV F1 (patient-level): 0.79; GTV F1 (lesion- level): 0.64; HR (BF): 1.31; HR (metastasis): 1.39; OR (acute GU tox): 1.05; HR (late GU tox): 1.04 |
| [56] | Nakano (2025) | ML – Logistic regression | Prostate cancer | Dose distribution | Biochemical failure | AUC | 0.81 |
| [217] | Bouzaki (2025) | DL | Prostate cancer | CT | Rectal toxicities | t-test, p-values; hazard ratios | Significance (p < 0.05) for lower posterior rectal region; 3% increased risk per Gy for clinician-reported proctitis |
| [205] | Ecker (2023) | ML – Cox proportional hazards models | Cervical cancer | MRI, clinical data, dosimetric data | Local tumor control, grade 2 morbidity endpoints | Concordance index (C-index) | C-index: 0.57-0.73 across endpoints (0.73 for local tumor control; 0.57-0.70 for NTCP endpoints) |
| [206] | Zhu (2023) | ML – Cox survival model with LASSO | Prostate cancer | MRI | Biochemical recurrence-free survival | Concordance index (C-index), area under the curve (AUC) | C-index: 0.83 (training), 0.78 (test); AUC (test): 0.88 (1 year), 0.90 (2-year), 0.89 (3-year) |
Table 5
Study characteristics and performance for dose calculation and treatment optimization
| Ref. | Author (year) | AI type | Disease site | Input dataset | Dose application | % different from ground truth or p-value (statistical difference between predicted and ground truth) |
|---|---|---|---|---|---|---|
| [89] | Lei (2021) | DL – CNN | Prostate cancer | CT | Dose calculation | Bladder D0.2cc (Gy): 0.635; Bladder D2cc (Gy): 0.325; Bladder V75 (cc): 0.395; Rectum: D0.2cc (Gy): 0.235; Rectum D2cc (Gy): 0.269; Rectum V65 (cc): 0.162; Urethra V115 (cc): 0.099; Urethra V125 (cc): 0.140 |
| [70] | Nascimento (2019) | DL – ANN | n/a | Consensus dataset | Dose calculation | 3.49% |
| [93] | Mao (2020) | DL – CNN | n/a | CT | Dose calculation | CTV D90 (prostate): 0.73 ±0.14% CTV D90 (cervical): 1.73 ±0.25% |
| [103] | Shen (2019) | DL | Gynecological cancer | DVH of plan | Dose optimization | n/a |
| [94] | Miller (2001) | DL – ANN | n/a | Energy function | Dose optimization | 13.26% |
| [99] | Rajkovic (2020) | DL – MANN | Prostate carcinoma | Clinical parameters | Treatment optimization | R > 0.7 |
| [37] | Nicolae (2017) | ML – stochastic optimization | Prostate cancer | DICOM files | Treatment optimization | V100%: 0.487 V150%: 0.002 D90%: 0.260 PTV V100%: 0.563 Urethra D0.1cc: 0.276 Rectum D1cc: 0.580 |
| [38] | Nicolae (2020) | ML – stochastic optimization | Prostate cancer | DICOM files | Treatment optimization | Plan modification: 0.65 Planning time: p << 0.05 |
| [117] | Akhavanallaf (2021) | DL – DNN | Gynecological cancer | Dose distribution kernel in water and volumetric density maps | Dose calculation | For CTV: D90: 1.8 ±0.86% V150: 0.56 ±0.56% V100: 1.48 ±0.72% Bladder D5cc: 2.7 ±1.7% Sigmoid D5cc: 1.9 ±1.3% Rectum D5cc: 2.1 ±1.7% |
| [143] | Pu (2022) | DRL – ITPN | Gynecological cancer | Clinical parameters | Dwell time optimization | n/a |
| [156] | Zhang (2023) | Neural network method | Gynecological cancer | DVH and volume of sub-organs | Dose calculation | ∆D2cc/D90 for bladder: 0.052 ±0.044 ∆D2cc/D90 for rectum: 0.040 ±0.032 ∆D2cc/D90 for sigmoid colon: 0.041 ±0.037 |
| [52] | Kallis (2021) | Knowledge-based model | Gynecological cancer | DVH of plan and Youden index | Dose prediction to guide needle supplementation | n/a |
| [146] | Cortes (2022) | DL – CNN | Gynecological cancer | DICOM files | Dose calculation | HDR CTV D90: –0.09 ±0.67 Gy Bladder D2cc: –0.17 ±0.67 Gy Rectum D2cc: –0.04 ±0.46 Gy Sigmoid D2cc: 0.00 ±0.44 Gy |
| [148] | Kallis (2023) | DL – knowledge-based | Gynecological cancer | DICOM file | Treatment optimization | HR-CTV V100: 1.9 ±5.6% HR-CTV D90: -5.1 ±12.7% Bladder D2cc: -3.8 ±9.3% Sigmoid D2cc: -3.5 ±6.7% Rectum D2cc: -1.3 ±5.4% |
| [106] | Villa (2021) | DL – DCNN | Prostate cancer | Contours and seed position | Dose calculation | Planning time < 1 minute Prostate V100: –0.8 ±1.0% Prostate V150: –0.6 ±3.1% Prostate V200: 0.2 ±1.3% Urethra D10: 1.7 ±3.5% Urethra D30: 0.9 ±2.7% Rectum D2cc: 0.4 ±2.6% Rectum D0.1cc: –2.8 ±9.2% |
| [129] | Wang (2022) | DRL | Gynecological cancer | DVH of plan | Treatment optimization | TCP improved by 1.41% Rectum D2cc: –7.88%, NTCP: –10.17% Bladder D2cc: –3.26%, NTCP: –0.02% Sigmoid D2cc: –3.44%, NTCP: –3.44% |
| [150] | Li (2023) | Deep neural network | Gynecological cancer | CT images, clinical dose map, binary masks of HR-CTV & OARs, source track | Dose calculation | For SE_AN: HR-CTV D90: 0.37 ±0.25 Bladder D2cc: 0.23 ±0.14 Rectum D2cc: 0.28 ±0.20 For U-Net: HR-CTV D90: 0.34 ±0.24 Bladder D2cc: 0.25 ±0.20 Rectum D2cc: 0.25 ±0.21 For cascaded U-Net: HR-CTV D90: 0.42 ±0.31 Bladder D2cc: 0.24 ±0.19 Rectum D2cc: 0.23 ±0.19 |
| [151] | Ma (2021) | DL – CNN | Gynecological cancer | Organ contours and applicator locations | Dose calculation | n/a |
| [149] | Lei (2021) | DL – Reg-Net | Prostate cancer | Prostate and OAR contours | Catheter position prediction | Prostate V100: 95% V150% increased by 5% V200 increased by 2.9% Bladder and rectum V75 average difference close to zero; Urethra V125 average difference close to zero |
| [71] | Fan (2021) | DL – DNN | Gynecological cancer | Isodose distribution | Treatment plan check and verification | Prediction time for dwell position and time: < 10 sec Predicted dwell position coordinate difference: ~0.5 mm Relative deviations of the predicted dwell times: < 2% |
| [154] | Zhu (2024) | DL – U-Net derivative | Hepatic cancer | CT | Treatment optimization, dose calculation, multi-organ segmentation | Plans meet clinical DVH requirement |
| [50] | Gerlach (2024) | ML – SLP | Prostate cancer | CT | Treatment/needle configuration optimization | n/a |
| [193] | Xiao (2024) | DL – 3D U-Net | Head and neck cancer | CT, seed dose map, inter-seed shadow map | Dose calculation, automatic planning | Dose error for CTV D90: 1.1 ±0.7%, CTV V100: 0.4 ±0.3%; p = 0.01-0.97 for clinical vs. automatic plans |
| [190] | Berumen (2024) | DL – U-Net derivative | Prostate cancer | CT, treatment plan, organ contours | Dose calculation | D90 mean difference, U-Net –0.64%, ResU-Net TSE: 0.08% |
| [191] | Gao (2024) | DL – adversarial networks | Cervical cancer | CT | Plan evaluation | n/a |
| [192] | Quetin (2024) | DL – CNN | Breast cancer | CT, TG-43 dose maps, patient geometry/mass density | Dose calculation | PTV V100: 0.17%; Skin D2cc: 0.30%; Lung D2cc: 0.82%; Chest wall D2cc: 0.34%; Heart D2cc: 1.08% |
| [51] | Jafarzadeh (2024) | ML | Prostate cancer | CT | Dose optimization | n/a |
| [196] | Moore (2024) | DL – U-Net derivative | Cervical cancer | CT, anatomical masks, dwell locations, applicator channels | Dose calculation | MAE: 2.69-5.36%; ME: 0.89-1.42%; Gamma pass rate: 83-91% |
| [194] | Fu (2024) | DL – ResNet | Cervical cancer | CT, generated maps | Dose prediction, treatment optimization | p < 0.01 for most dosimetric comparisons (except bladder D2cc: p = 0.112) |
| [195] | Gautam (2024) | DL – 3D U-Net with attention | Cervical cancer | CT, structure masks | Dose calculation | D90 MAE: 8.14% (p = 0.08); V100% MAE: 5.23% (p = 0.283); Bladder D2cc MAE: 3.62% (p = 0.015) |
| [197] | Xiong (2024) | DL – U-Net derivative | Parotid gland cancer | CT | Dose calculation | CTV D90 PAE: 0.67 ±0.47% (PGC test); Skin D0.1cc PAE: 1.04 ±1.33% |
| [49] | Gautam (2025) | ML – linear regression | Cervical cancer | CT, clinical data | Dose optimization | Bladder D2cc: –4.35% (p = 0.114, IC)/ –3.64% (p < 0.001, ICIS); Rectum D2cc: –2.96% (p = 0.270)/–4.98% (p = 0.120); Sigmoid D2cc: –3.17% (p < 0.001)/ –5.98% (p = 0.062) |
| [199] | Gautam (2025) | DL – 3D U-Net with attention | Cervical cancer | CT, structure masks | Dose calculation | HR-CTV D90 MAE: 0.45 ±2.42 Gy (4.8%), p = 0.26; Bladder D2cc: 0.38 ±1.19 Gy (9.1%), p = 0.50; Rectum D2cc: 0.43 ±0.71 Gy (5.7%), p = 0.41; Sigmoid D2cc: 0.47 ±0.79 Gy (8.6%), p = 0.30 |
| [198] | Chatigny (2025) | DL – ResNet | Prostate cancer | 3D images, likely from CT | Treatment plan selection/optimization | No statistical difference (p > 0.05, paired t-test) for 6 of 13 criteria (expert 1) or 9 of 13 criteria (expert 2) |
| [200] | Knull (2025) | DL – 3D U-Net | Prostate cancer | TRUS | Dose calculation | DSC 0.97/0.96 (mid-gland); area percent difference: 1.1%/1.3% of clinical values; p > 0.05 for most metrics |
| [201] | Liu (2025) | DL – 3D U-Net | Cervical cancer | CT | Dose prediction, Dose optimization | Bladder D1cc: 3.02% (p = 0.005), D2cc: 2.74% (p = 0.004); Rectum D1cc: 3.77% (p = 0.012), D2cc: 3.70% (p = 0.016); Sigmoid D1cc: 4.00% (p = 0.003), D2cc: 3.93% (p = 0.004) |
| [215] | Wei (2025) | DL – LLMs | Cervical cancer | CT | Treatment optimization | No significant difference in OARs dose sparing (p > 0.05); Significant improvement in conformity index (CI) and homogeneity index (HI) for LLM plans (p < 0.05 for some parameters) |
| [53] | Kennedy (2025) | ML | Prostate cancer | CT | Dose optimization | p < 0.001 for overall pass-rate difference (mean improvement of 18.8%) |
| [55] | Morén (2025) | ML – linear regression, random forest | Prostate cancer | CT | Catheter placement and dose distribution | HS-AV model reduced hot spot volume by 29% at 14 catheters compared with CS-LP model |
| [156] | Zhang (2023) | ML | Cervical cancer | CT, organ volumes, HR-CTV volume | Dose prediction | D2cm3/D90: 0.052 ±0.044 (bladder), 0.040 ±0.032 (rectum), 0.041 ±0.037 (sigmoid) |
| [214] | Flower (2023) | ML | Cervical cancer | CT and MRI | Dose optimization | Bladder –2.9%, Rectum –14.9%, Sigmoid –10.7%, Bowel –4.1%, Recto-vaginal –19.9%, Vaginal –9.2% |
| [136] | Berumen (2023) | DL – 3D U-Net | Prostate cancer | CT | Dose calculation | CTV D90 avg difference: 0.1%; Rectum D2cc: 1.3%; Bladder D2cc: 0.07%; Urethra D0.1cc: 4.9% |
| [144] | Reijtenbagh (2023) | ML – random forest | Cervical cancer | MRI | Dose optimization (detection of sub-optimal plans) | Median improvement of 0.62 Gy in D2cm3 |
| [213] | Barten (2023) | ML | Prostate cancer | MRI | Treatment optimization | In 10/14 patients, all dose-volume criteria satisfied within 0.2 Gy; in 4/14 patients, coverage/sparing protocol not fully met after manual fine-tuning |
AI in BT treatment planning
Intracavitary applicator, needle, and seeds reconstruction
Artificial intelligence was introduced to intracavitary applicator, needle, and seed reconstruction to reduce time needed while maintaining the accuracy of a planner. Most studies were retrospective in nature, relying on archival imaging datasets, with expert-based reconstruction (localization) of applicators, needles, and/or seeds as ground truth. However, four studies [29, 33, 42, 43] were not retrospective: Lee et al. [33] evaluated a prospective tool for automated planning volume definition in soft-tissue sarcoma brachytherapy; Shiradkar et al. [42] developed a computational radiomics-based framework for prostate planning; Stenhouse et al. [43] proposed a machine learning model for applicator selection in cervical brachytherapy; and Deufel et al. [29] validated an automated applicator digitization algorithm using thresholding and clustering approaches. Of the 38 papers using AI for reconstruction, four studies utilized machine learning techniques, while the rest employed deep learning, mainly convolutional neural networks. None of the studies in this group relied solely on non-machine learning/deep learning automation approaches (e.g., rule-based, clustering, or thresholding methods); all used either machine learning or deep learning. Machine learning methods (e.g., radiomics with classical classifiers) work with smaller datasets, and are more interpretable, though constrained by feature design and generalizability. Deep learning methods (e.g., CNNs, U-Net, Res-Net) achieve the highest accuracy and adaptability, but demand larger datasets, superior computation, and pose interpretability challenges. In 63% of studies, high-dose-rate (HDR) BT needle [33] or low-dose-rate (LDR) seeds reconstruction [18] for prostate cancer patients were investigated. The remaining fourteen studies explored the use of AI in intracavitary applicators [17] needles [19], or reconstruction for gynecological cancer patients. In 89% of studies, training datasets of less than 100 treatment plans were utilized, with the largest containing 713 plan datasets [64] and the smallest, 4 [120]. Of the studies, 26% did not indicate numbers used specifically for independent validation or testing performed with datasets not used in training or other validation methods. N-fold cross-validation was performed in seven studies [68, 69, 113, 114, 122, 133, 157], with independent testing datasets ranging in size from 2 [47] to 389 [64].
Intracavitary applicator reconstruction for gynecological cancers
Artificial intelligence-based applicator reconstruction performance was mainly reported in terms of Hausdorff distance (HD), the largest difference between two reconstructions (experts vs. AI), and Dice similarity coefficient (DSC), a measure of the amount of volume overlaps the two segmentations have in terms of percent overlap [212]. Fifteen studies [79, 80, 85, 111, 120, 122, 127, 129-131, 133, 170, 209-211] employed deep learning, with two studies using machine learning [29, 32], while nine and three utilized CT [29, 79, 85, 111, 129-131, 161, 170] and MRI [32, 120, 127], respectively. Two employed titanium tandem and ovoid (T&O) applicators [29, 85], one reported Fletcher-Williamson T&O applicator [111], with the other two using a plastic T&O applicator [79] and a plastic tandem and ring (T&R) [32], respectively. One paper focused on the reconstruction of plastic catheters in MRI-guided interstitial brachytherapy for gynecological cancer [127]. All intracavitary applicator reconstruction studies, regardless of the applicator type or type of imaging modality, presented HD values between < 1 mm and 5.8 mm, DSC values of 88.3-93.1, or less than 1 mm errors. For the three metallic T&O cases (imagined on CT), HD between AI and manual for tandem ranged from less than 1 mm to 1.9 mm [29, 85, 111]. For ovoids only, this value ranged from less than 1 mm to 3.9 mm [29, 85, 111]. For the reconstructed paths, the average accuracy was within 1 mm for all channels [85, 111]. For plastic T&O applicators on CT, Hu et al. reported a segmentation DSC of 0.89 and an average tip error for reconstruction of 0.80 mm [79]. A study that examined plastic T&R applicators on MRI, achieved dwell position errors of 0.72 mm for the ring and 0.70 mm for tandem with a machine learning algorithm, significantly (p < 0.05) better than inter-observer variability [32].
Interstitial needles for prostate or gynecological cancers
Of the 26 studies reconstructing interstitial needles, six focused on metal needles [86, 100, 108, 129, 131, 170], and two on plastic needles [127, 211] in gynecological cancer patients, while the remaining fourteen [64, 68, 69, 80, 107, 112-114, 122, 130, 157, 158, 160, 171] focused on prostate cancer using either plastic (8/14; 57%) or metal needles. All studies, except Grigo et al. [159], utilized CNNs. Across all interstitial needle reconstruction studies, the reported performance varied by disease site and imaging modality. Gynecological HDR studies (mostly CT- or US-based) presented relatively consistent results, with HD values in the range of ~0.7-3.0 mm and DSC values of ~88-93%. In contrast, prostate HDR studies demonstrated wider variability, particularly in MRI-based reconstructions, with HD values spanning 0.7-15.9 mm and DSC values from ~50% to 95%. When aggregated, these studies collectively reported HD values of 0.71-15.9 mm, DSC values of 50-93.7%, or < 2.0 mm errors. For gynecological cases, a CT study [86] reported a needle reconstruction DSC of 0.93 and an HD of 0.71 ±0.40 mm for the needle-tip difference in needle reconstruction, reconstructing all needles, including cases with needles touched or crossed. A gynecological interstitial needle case study using MR images showed an average DSC of 60% and an error of 2.0 mm for closely spaced catheters [108], while one paper on US images achieved errors of 1.03 mm and 0.62 degrees [100]. In addition, Straathof et al. [211] reported a retrospective planning study using CT and MRI datasets to optimize curved channel configurations in 3D-printed, patient-tailored applicators for cervical cancer brachytherapy, highlighting the potential of AI-driven personalization beyond standard applicator geometry.
In a series of studies using deep learning for multi-plastic needle reconstruction in TRUS images of HDR prostate cancer patients [112-115], reconstruction errors ranged from 0.33 mm to 0.44 mm, with 96-98% of needles successfully identified. Similarly, Andersén et al. [64] and Wang et al. [107] demonstrated mean errors below 1 mm for TRUS-guided prostate HDR needle digitization, with high needle detection rates. For MRI-guided HDR prostate brachytherapy with plastic needles, Dai et al. [68, 69] and Aleong et al. [157] reported that 82-87% of needles were detected within a 2 mm error, with mean reconstruction errors generally below 1 mm across independent cohorts. For TRUS- and MRI-based metallic interstitial needle reconstruction, more recent work has demonstrated further accuracy gains. Moradi et al. [160] and Goulet et al. [158] showed a mean tip errors of 0.41-0.72 mm and average errors of 0.44 ±0.32 mm, respectively, while Kobayashi et al. [171] explored MRI-based prediction of needle deflection, reporting HD95 values up to 4.9 mm, depending on extra-capsular extension. Across all included studies, expert manual digitization served as the ground truth for training and evaluation. Although explicit measures of human reconstruction accuracy were generally not reported, the observed differences between AI-based and manual reconstructions, 0.4-0.7 mm in Moradi et al. [160] and Goulet et al. [158], were consistent with the expected intra- and inter-observer variability.
Seed identification in prostate seeds implant (PSI)
Six studies [39, 47, 76, 101, 133, 159] investigated AI algorithms for iodine-125 (125I) seed detection in post-implant dosimetry. Two applied traditional machine learning approaches [39, 47], and four used convolutional neural networks [76, 101, 133, 159]. The datasets were generally small, with test sizes ranging from a single phantom plan with 20 dummy seeds [39] to 40 clinical MRI plans with varying numbers of seeds [101]. Across studies, AI-based seed identification achieved detection rates of 64-97.6%, and localization errors between 0.19-1.44 mm. In TRUS images, one study [76] reported that 64% of seeds could be detected, whereas another [47] found a mean localization error of 1.44 mm with 4.3° angular deviation. In an MRI-based study of Sanders et al. [101], a recall of 97.6% with 1.9% precision was achieved, with a mean localization error of 0.19 mm, while Nosrati et al. [39] demonstrated comparable accuracy using an unsupervised ML method on phantom data. More recently, Yuan et al. [133] applied deep learning to fluoroscopy images, resulting in a mean average precision of > 0.91. Grigo et al. [159] developed an MRI-only post-implant dosimetry workflow using a 3D nnU-Net, reporting mean centroid errors of 1.8 ±1.3 mm and mean local deviations of 0.9 ±0.9 mm, demonstrating feasibility of CNN-based MRI-only workflows for prostate LDR brachytherapy.
Organs at risk and target volumes segmentation
Artificial intelligence has also been broadly applied to the segmentation of organs at risk (OARs) and target volumes in BT across both prostate and gynecologic tumor sites [63, 73-75, 77, 82, 84, 88, 90-92, 95-98, 102, 110, 111, 118, 119, 121, 123-126, 128, 132, 134, 135, 137-140, 142, 150, 155, 162-170, 172-189]. In total, 74 studies employed deep learning techniques, with approximately 85% implementing CNN-based architectures [63, 73-75, 77, 82, 88, 90, 91, 95, 97, 98, 110, 111, 123, 125, 126, 128, 132, 134, 135, 137-140, 155, 162-170, 172-189]. For prostate brachytherapy, most efforts focused on TRUS segmentation [88, 90-92, 96-98, 110, 123, 138], supplemented by MRI- and CT-based investigations [57, 58, 63, 73-75, 102, 118, 125, 126]. For gynecologic brachytherapy, segmentation was explored primarily on MRI datasets [95, 111, 119, 124, 132, 134, 135, 137, 139, 140, 142, 155, 162-170, 172, 174-189], with several complementary CT-based studies addressing post-operative or intracavitary workflows [77, 84, 121, 128, 139, 155]. A smaller sub-set of studies targeted endometrial carcinoma [170] and parotid gland brachytherapy [141]. A domain-adversarial neural network was employed in one study for the segmentation of clinical target volume (CTV) in gynecological cancer patients undergoing post-operative vaginal brachytherapy with CT imaging [155]. Most research (36%) involved prostate cancer patients [57, 58, 63, 73-75, 88, 90-92, 96-98, 102, 110, 118, 123, 125, 126, 138, 166, 170, 172, 176, 185, 189]. Studies used training datasets ranging from 7 patients [124] to 771 patients [92], with validation dataset sizes ranging from 7 [110] to 193 patients [92]. Some authors (30%) did not use an independent testing dataset, but testing dataset sizes as small as 5 patients [77] and as large as 280 patients [96] were reported.
As far as the type of validation methods concerned, N-fold cross-validation [90, 91, 96, 128, 142, 165, 166, 172, 174, 175, 181, 188] and cross-institution validation [82, 95, 119, 125, 134, 135] were reported. Segmentation performance was shown in terms of HD only (18/63), DSC only (39/63), and both HD and DSC (31/63). In 32% of studies, a DSC of 90% or higher was reported [57, 58, 63, 73, 74, 84, 88, 90, 91, 95, 97, 98, 101, 110, 123, 152, 165, 166, 170, 172, 174, 175, 185, 188, 189]. Regarding HD, all studies presented a value of less than 16 mm, with most (35%) being under 5 mm [63, 73, 77, 88, 90, 91, 95, 98, 102, 121, 123, 128, 132, 134, 137, 141, 155, 165, 166, 170, 172, 174-176, 185, 188, 189]. All research demonstrated computation times under 300 seconds, with majority (33%) of studies [63, 73, 75, 88, 96-98, 165, 172, 182, 184, 187, 189] reporting times under 1 second. For the 17 studies reporting prostate cancer segmentation on TRUS images [57, 58, 63, 73, 74, 88, 90, 91, 96-98, 123, 138, 155, 166, 170, 184], DSCs ranged from 88% [75] to 97% [73], whereas HDs for these studies ranged from 2.3 mm [91] to 8.4 mm [75]. Four studies used deep learning to segment the prostate on CT, with DSCs reported as 83% [118], 85% [92], 89% [74], and 95% [73], while HDs ranged from 5.2 mm to 6.3 mm. A study by Sanders et al. compared the performance of 120 different deep learning algorithms on segmentation for prostate cancer [102]. They found that the highest performing model, fully convolutional network (FCN), resulted in DSCs ranging from 70% (external urinary sphincter) to 96% (bladder). Another case that utilized MRI, but as priors for TRUS segmentation, achieved a DSC of 90.9% on the prostate with a CNN [110]. For all prostate segmentation cases, the base and apex regions were reported as being segmented with lower accuracy than the mid-gland region.
For OAR segmentations, the bladder, rectum, and sigmoid had DSCs of 85-96%, 66-97%, and 66-92% on CT for gynecological cancer, respectively [95, 111, 128, 139, 165]. For OAR segmentations on MR images for prostate cancer, the highest DSCs values were 96% for the bladder and 91% for the rectum [102], while a study on TRUS images reported DSCs of 75%, 86%, and 90% for the bladder, urethra, and rectum, respectively [91]. A study by Iantsen et al. used a U-Net to segment the sub-tumor region to identify functional uptake regions in PET images for gynecological cancer patients, achieving an average DSC of 80% [82]. Another paper by Jeuthe et al. employed CT images to train and test their machine learning and deep learning models that segmented pelvic bones, and observed that the highest DSC of 98% was found using a deep learning method [84]. A study by Li et al. [141] reported on deep learning-based two-step auto-segmentation model for OAR in parotid gland carcinoma patients using CT. Clinical acceptability was defined quantitatively, with most OARs achieving a DSC greater than 80%, which the authors considered the threshold for clinically satisfactory segmentation. The method produced results in under one minute per patient.
Dose calculation and optimization
Forty studies [37, 38, 49-51, 53, 55, 70, 89, 93, 94, 99, 103, 106, 117, 136, 143, 144, 146, 148, 150, 151, 153, 154, 156, 190-201, 213-215] investigated AI applications for dose calculation, dose prediction, and treatment optimization in BT.
Needle placement optimization: Five studies focused on optimizing or assisting with needle placement and localization prior to planning [37, 38, 143, 148, 154]. These attempts primarily addressed geometric optimization of applicator or needle positioning as a foundation for subsequent planning.
Dwell time and treatment plan optimization: Nine studies investigated treatment plan optimization, primarily in the form of dwell time distribution or overall plan quality enhancement [94, 99, 103, 106, 143, 148, 154, 190, 193]. Among these, five explicitly examined optimization strategies using AI [37, 38, 143, 148, 154].
Dose calculation and dose prediction: Four papers directly addressed dose calculation tasks [70, 89, 93, 153], while seven focused on dose prediction models [52, 136, 144, 146, 150, 151, 156]. In this context, “prediction” referred to models forecasting dose distributions or dose volume histogram (DVH) parameters, which were then used to guide dwell time optimization or validate plan quality. One investigation specifically reported dose calculation with tissue heterogeneity modeling using machine learning [117].
The majority of research (20/23) employed deep learning techniques [50, 70, 89, 93, 94, 99, 103, 106, 136, 143, 144, 146, 148, 150, 151, 153, 154, 190, 193]. One study used machine learning [117], another reported a neural network approach [156], and one applied a knowledge-based method [52]. No study showed an independent testing dataset larger than 200 patients. Across all clinical sites, median p-values were > 0.05, indicating no significant difference between AI-predicted outputs and ground truth clinical plans.
For the optimization cases, twelve studies [37, 38, 50, 53, 55, 99, 106, 190, 198, 200, 210, 213] used data input from prostate cancer patients, of which three focused on LDR prostate brachytherapy [37, 38, 190], eight on HDR prostate brachytherapy [50, 53, 55, 99, 106, 198, 200, 213], and one included both HDR prostate and cervix [210]. Barten et al. [213] demonstrated the first prospective clinical experience of AI-based automated HDR prostate planning, while Dickhoff et al. [210] developed and validated a framework that extended multi-objective AI optimization for both HDR prostate and cervical BT. Rajković et al. used an ANN to optimize treatment parameters (dose, coverage index, prostate-specific antigen [PSA] nadir 1, and the risk of recurrence) in prostate HDR-BT patients of varied risks of biochemical failure [99]. The model achieved an R value of greater than 0.7, and a mean squared error and deviation from reference that both, along with the R value, were within acceptable limits. The other five studies reported DVH parameter errors of between 0.1% and 5.1% [37, 38, 106, 143, 148], with only one significant DVH parameter difference in one study [37]. There was also a significant decrease in planning time [38]. One optimization paper focused on gynecological cancer, and improved the quality score of human-created plans by 10.7% by using an AI-based reinforcement learning framework to adjust organ weights [103]. Another optimization paper that did not specify a clinical site [94], optimized needle locations in BT treatment plans under a simulated phantom setting without validation via clinical imaging and treatment plans, and reported the root mean square errors of each needle’s position to be 3 mm.
Deep learning has been applied for diminishing the time needed to perform heterogeneity-corrected dose calculations using Monte Carlo simulations [106, 117, 136]. Five studies [89, 93, 136, 146, 151] used CNNs with CT images as inputs to generate a predicted dose distribution. Using the clinically delivered dose as ground truth, one study reported p-values of greater than 0.01 for all DVH metrics, suggesting no difference between deep learning and clinical dose [89]. The other study [93] reported the Monte Carlo simulation as ground truth, with differences between ground truth and their algorithm of under 3% for all DVH metrics. Yet another study [70] employed a large consensus dataset and the inverse problem theory in combination with ANNs to improve the Sievert integration model, achieving an approximation error of 3.3% in radial dose-rate.
Other planning procedures
Fourteen studies used AI for other planning procedures [30, 33, 42, 43, 61, 65, 66, 71, 83, 105, 149, 202, 203, 216]. Shiradkar et al. was able to reduce the prescribed dose delivered to prostate cancer patients to the whole gland by 43% using a new plan based on intensity and radiomic features of the tumor [42]. Gynecological treatment plans were also corrected, with an ANN estimating variations in intra-fractional organs doses, and then modifying the treatment plan in 10-14 of 30 plans while not changing the target dose [83]. Another study involving the verification of gynecological plans achieved an accuracy of around a 1-pixel error for position, and came within 2% of planning system calculations for dwell time [71].
Stenhouse et al. used machine learning methods to develop a model that predicted whether intracavitary or interstitial applicators should be applied in gynecological HDR-BT, and were able to predict which type of applicator should be utilized with a 91.5% predictive accuracy [43]. A study reconstructing catheters and removing artifacts while considering patient movement via electromagnetic tracking data in CT images for BT of breast cancer, achieved results qualitatively similar to human planners [30]. Another paper used deep learning to predict the insertion force of needles for prostate BT, and reported errors of 4.5% [66]. Similarly, Avila-Carrasco et al. developed an ANN to estimate the deflection of needles in soft tissue phantoms, with prediction errors ranging from 0.29 to 0.62 mm [65].
A study by Sina et al. utilized an ANN and CT numbers of tissues to determine the composition of tissues in treatment planning, and predicted mass density with errors of only 0.52% for bone and –0.95% for muscle [105]. Another application was studied by Lee et al., who smoothly outlined planning volumes of soft-tissue sarcoma patients with machine learning inputs of catheter positions and PTV volume, achieving clinically acceptable outlines in 2 minutes [33].
Wang et al. demonstrated that HDR prostate BT plan quality can be predicted directly from TRUS images, enabling real-time feedback during the procedure and potentially reducing reliance on time-intensive post-planning evaluations [216]. Beyond prostate, Wang et al. also developed a machine learning-guided, 3D-printed 32P hydrogel applicator for skin hemangiomas, which allowed customizable dose distributions and highlighted the versatility of AI-driven personalized applicator design in non-traditional brachytherapy sites [61]. In cervical cancer HDR-BT, Jiang et al. applied deep learning to select between Syed and T&O applicators, achieving high accuracy in applicator choice and offering a tool to support clinicians in complex treatment decisions [203]. Complementing planning and applicator selection, Hoffer et al. introduced automated thermal imaging to monitor local response to cervical cancer brachytherapy, providing a non-invasive and real-time method to assess treatment effectiveness during therapy [202].
AI in BT outcome predictions
Artificial intelligence was broadly applied for predicting outcomes of different aspects of BT in 27 papers. Of the 27 studies, nine [34, 35, 45, 46, 56, 60, 204, 206, 217] focused on prostate, and sixteen [28, 31, 36, 40, 41, 44, 48, 59, 104, 116, 145, 205, 218-221] were dedicated to gynecological cancer. Most [28, 31, 34-36, 40, 41, 44-46, 48, 54, 56, 59, 206, 218-221] papers used machine learning/radiomics techniques, with four utilizing deep learning [87, 104, 116, 145, 204]. AUC (area under the receiver operating characteristic [ROC] curve; a quantitative accuracy measurement where higher values indicate better classification performance), p-values, and sensitivity/specificity, were the most commonly reported performance metrics, with studies focusing on predicting failure, toxicity, or recurrence/relapse after brachytherapy. Most prediction studies reporting AUCs had values of ≥ 0.70; however, a minority showed AUCs in the range of 0.63-0.69 or lower for specific endpoints/sub-sets [40, 220]. All AUC values were reported in the respective studies while were not re-calculated in this review.
Predicting toxic side effects
Using AI to predict toxicity or formation of toxic structures, such as fistulas or urethral strictures after BT treatment, was studied in eight papers [36, 44, 45, 59, 116, 145, 217, 219]. Six [36, 44, 59, 116, 145, 219] involved gynecological cancer cases, while the other [45] considered prostate cancer patients. For the gynecological cases, studies predicting fistula formation [44], rectum toxicity [116], and late bladder toxicity [145] achieved AUCs of 0.904 and 0.7 and AUROC of 0.81, respectively. For acute and late toxicity per area, radiomics resulted in averaged sensitivity and specificity of 73-78% and 64-78% [36]. Additional research applied AI to predict broader toxicity outcomes, including grade 3+ toxicities in gynecologic cancer patients treated with HDR brachytherapy, with F1 scores up to 0.63 and accuracies of 0.80-0.85 [59], whereas radiation-induced vaginal injury after cervical cancer radiotherapy achieved an AUC of 0.975 [219]. For the prostate case, machine learning methods predicted structure formation, and found only two MRI radiomic features, i.e., homogeneity and contrast, to be significant [45]. More recent work has also applied AI to identify rectal sub-regions associated with toxicities in prostate radiotherapy, observing significant associations between posterior rectal regions and increased toxicity risk [217].
Failure after treatment, progression, or survival prediction
In fourteen papers, AI was used to predict progression of disease, recurrence, or failure/mortality after BT treatment [31, 35, 40, 41, 46, 48, 54, 56, 87, 104, 204, 206, 218, 221]. The two prostate cancer studies in this section employed machine learning, and predicted biochemical failure using the Phoenix definition [46] and local recurrence [35]. The biochemical failure rate was 0.75 in patients with algorithm-designated parameters (0.38 for conventional population), and 17 selected radiomic features for local recurrence had p-values of 0.05. One choroidal melanoma study [87] used clinical and demographic inputs to predict 5-year mortality post-BT treatment, and achieved an AUC value of 0.81. In another study, a machine learning model was employed to forecast a four-year risk of metastasis and mortality in uveal melanoma using ultrasound datasets, achieving values of 0.730 and 0.846 for predicting metastasis based on one-year and three-year follow-up data, respectively [54]. Five research focused on predicting response to treatment in gynecological cancers [31, 40, 41, 48, 104]. Local and distant relapse were projected using deep learning, with accuracies of 89% and 87% using fluorodeoxyglucose positron emission tomography (FDG PET) and CT data as inputs [104]. Machine learning was employed to predict local recurrence, distant failure, and overall survival/ local control, showing AUCs of 0.63-0.76 with 8 features [40], 0.83 with a created shell feature [31], 0.75 with 11 features [41], and 0.75-0.82 with 10 features [48]. Hao et al. [31] also used their features to predict distant failure in non-small cell lung cancer patients, with an AUC value of 0.82.
Other predictions
More broadly, one study used machine learning to identify changes in apparent diffusion coefficient (ADC)-based radiomic features, such as histogram and texture descriptors (i.e., mean, skewness, kurtosis) in prostate cancer patients undergoing external beam radiation therapy (EBRT) and BT with dose escalation [34]. They were able to determine which features from 101 tested underwent the most change during treatment. Similarly, Bowen et al. performed a study to track tumor heterogeneity using intensity histogram and texture features derived from multi-parametric MRI/PET imaging after treatment [28], and were able to determine features undergoing the greatest changes.
AI in BT imaging
Image artifact removal and multi-image registration
Artifacts can decrease image quality, hence implementing deep learning may help to remove artifacts from images. One paper showed a reduction of metal artifacts from gynecological CT images in less than one second, with a resulting mean peak sound-to-noise ratio of 38.09 dB, which was higher than the 37.79 dB obtained from the conventional CNN [81]. In medical imaging, PSNR values above ~30 dB are generally considered good image quality, while values below ~20 dB are considered poor. Thus, the reported PSNR values in this study indicated high-quality reconstruction. For US, Allman et al. applied a CNN to identify noise artifacts [62]. With no excess noise, the CNN was able to identify 100% of sources and artifacts from 3,468 test images, but added noise greatly decreased performance with 98% identified at –9 dB or greater, and only 4.35% identified at –21 dB. Image reconstruction was also performed by deep learning in prostate cancer patients, with two studies registering MR and US images, achieving a DSC of 97% [67] and a target registration error of 2.53 mm [109], respectively. Salehi et al. demonstrated the viability of employing deep learning for deformable image registration to address inter-fraction organ motion in locally advanced cervical cancer patients undergoing HDR brachytherapy. This study utilized radiotherapy structure data to facilitate local image deformation. Notably, the mean Dice indices attained for the cervix, bladder, and rectum were 0.89 ±0.02, 0.96 ±0.01, and 0.93 ±0.02, respectively [152]. In another study, Ecker et al. trained 3D and 2D neural networks to predict applicator structures from MR images, followed by automatic applicator-based image registration for MRI-guided cervical HDR brachytherapy. The results showed mean Dice coefficients of 0.70 ±0.07 and 0.58 ±0.04 for 3D and 2D neural networks, and registration algorithms achieved mean Dice error ranging from 8.1 ±3.7 mm to 0.7 ±0.5 mm [147].
Improvement in TRUS image quality
In one study, deep learning was used to construct high-resolution TRUS images from low-resolution TRUS images [78]. Comparing network-generated images to original high-resolution images, the network was able to reconstruct images very close to the original image, with a mean absolute error (MAE) of 6.5 ±0.5 dB. Feleppa et al. employed ANN tissue-type classifiers to help improve image quality by using training data of cancerous and non-cancerous tissues, with an ROC curve area of 0.804 ±0.052, which was over 20% higher than that in non-AI classification systems [72].
AI in BT per disease site
Breast
Currently, only one study reported the use of AI in fractionated high-dose-rate brachytherapy (fractionated HDR-BT for breast cancer via electromagnetic tracking (EMT) data to determine if the source movement aligns with the treatment plan, and reported that deviations can be removed automatically [30]. AI has not been applied in intracavitary catheter reconstruction for APBI (accelerated partial breast irradiation) or in segmentation of OARs or treatment volumes for breast cancer BT.
Gynecology
Of the three main gynecological cancer HDR-BT techniques, i.e., intracavitary, interstitial, and hybrid (intracavitary-interstitial), the first two were explored in this study. Intracavitary paths and applicators were reconstructed with less than a 1 mm error. For interstitial needles, results were shown for metal needles only. At present, no studies have reported on the application of AI-based reconstruction methods for hybrid (intracavitary–interstitial) applicators in gynecological HDR-BT. Jung et al. [85, 86] investigated AI-based interstitial needle reconstruction, and obtained mean localization errors ranging from 0.63 to 2.0 mm, depending on algorithm and dataset. Despite variability across methods, all studies consistently demonstrated high needle-identification rates. Gynecological cancer was comparatively less represented in the OAR segmentation studies compared with prostate cancer. Segmentation of organs and ROI in gynecological cancer showed that within the same imaging modalities, ranges of DSCs were similar across cervical and prostate cancer patients. Eight studies provided segmentation of OARs and targets for gynecological cancer on MRI [124, 132, 134, 135, 142, 167, 169, 181]. For imaging in BT for gynecological cancer cases, the predominant focus was on artifact removal, with only two studies exploring image registration [78, 79].
Prostate
Prostate cancer represented majority of the studies in this review. AI has been shown to have the potential to improve both plastic and metal interstitial needle BT cases as well as PSI LDR-BT. In prostate HDR-BT, Andersén et al. [64] evaluated AI-based reconstruction of interstitial metal needles on ultrasound, and reported a mean localization error of 0.55 mm. In terms of segmentation, prostate cancer cases were presented on TRUS, MRI, and CT. When measured against expert manual contours, AI-generated segmentations achieved DSCs of approximately 0.88-0.93 on TRUS [88, 90, 91, 97, 98, 123, 166], 0.90-0.94 on MRI [102, 171], and 0.84-0.90 on CT [92], indicating slightly higher agreement for TRUS and MRI than for CT. Prostate cancer cases were primarily centered on image construction and registration techniques.
Discussion
Currently, the state of AI in BT literature reveals that both machine learning and deep learning are well tested pre-clinically and retrospectively, with confirmed accuracy and improvements in applicator and needle reconstruction, OAR and target value segmentation, treatment optimization, outcome prediction, and other BT procedures. AI-assisted applicator reconstruction minimizes errors and standardizes digitization, achieving sub-millimeter agreement with expert reconstructions for intracavitary applicators. For interstitial needles in gynecologic HDR-BT, the reported mean localization errors are 0.63-2.0 mm across datasets and algorithms [29, 39, 85, 86]. AI-assisted auto-segmentation and digitization demonstrate inference times of seconds in retrospective and pre-clinical settings. These results show potential to streamline planning steps, but do not equate to full clinical workflows, which still require validation, optimization, QA, and physician review. Early prospective studies [172, 213] suggest that efficiency gains are feasible, though routine deployment remains contingent on workflow validation and expert oversight. Similarly, AI can help to produce organ segmentations even on images with poor quality, and has been adopted to do so in many applications in and outside of BT [1]. Delineation is a key part of the overall success of BT, and AI has been shown to perform calculations consistently and in times of less than one minute.
Across gynecologic HDR-BT, automated segmentation of organs at risk on CT/MRI is generally robust: typical DSCs for bladder and rectum are ~0.84-0.96, whereas for sigmoid and small bowel are lower (~0.60-0.80). High-risk clinical target volume (HR-CTV) DSCs are more variable, commonly ~0.79-0.89 with conventional CNN/nnU-Net models, while recent prompt-guided or ensemble approaches have reported higher values (~0.92-0.96) in single-center evaluations; per-structure inference is usually in the order of seconds [95, 111, 119, 124, 132, 134, 135, 137, 139, 169, 175, 176, 181, 185-187, 189]. These observations are consistent with the studies summarized in Table 2.
For prostate brachytherapy, auto-segmentation performance is the strongest on TRUS, where prostate DSCs typically range ~0.88-0.97 across multi-institution/device-diverse datasets; MRI-based pelvic structures cluster near ~0.86-0.96 (structure-dependent), and CT-based prostate segmentation commonly falls approximately ~0.82-0.90 [88, 90-92, 97-100, 102, 118, 121, 123, 125, 126, 166, 170]. Most frameworks report second-level inference, in line with Table 2.
AI can accurately predict dose prescription and treatment plans, with the potential to decrease extraneous dose outside of the target while optimizing dose to the intended area, and adapt dwell times to catheter movements and internal anatomy [30]. In addition, AI-based prognostic models have been used to estimate the risk of oncologic failure, defined here as local/regional recurrence or distant metastasis, enabling clinicians to use the data for personalized care. Follow-up frequency or BT technique can be adjusted to account for the patient’s potential for local or distant failure, and dosage can be prescribed based on the potential for toxicity [20].
Future studies focusing on the active use of AI in BT in clinical setting are necessary before clinical implementation. Research also report algorithm difficulties in hard cases, suggesting both the potential for AI algorithm refinement and the lasting necessity of physicians in non-trivial planning procedures and input of clinical parameters to AI algorithms. Studies indicate that AI may help with planning and validation procedures, but in terms of procedure performance, there still lies a heavy reliance on the clinician for the success of treatment. While AI will not eradicate the physician’s role, it is hopeful that technology will be used to standardize and strengthen the routine and repetitive tasks in BT to reduce the associated time and costs [20].
As the only comprehensive systematic review on the use of AI in BT adhered to PRISMA methodology, this study is subject to some limitations. Specifically, a publication bias could be present, as most studies were performed with previous patient cases, so cases with affirmative outcomes could have been specially selected for use. Also, the studies reported in this review varied widely in methods, population, disease site, treatment, and accuracy metrics reported, making comparison across different papers and a robust statistical analysis of results challenging. Determination of clinical applicability or performance predication is made difficult by the nature of this study being retrospective. Another important limitation is the lack of consensus on AI methodologies as best suited for clinical use. Numerous approaches, including radiomics-based models, CNN/nnU-Net architectures, and reinforcement learning frameworks, are being developed and optimized for different datasets and clinical goals, but no standardized strategy has yet been established [20, 22, 23]. This variation in methodology makes comparison across studies difficult, highlighting the need for consensus approaches and multi-institutional validation before clinical adoption. Most AI algorithm development or testing studies rely on retrospective data, and a retrospective approach can be advantageous in allowing models to be trained or improved by re-using the same patient data. Comparison of different AI methods is possible with this kind of study design, but limited patient characteristics or input datasets inhibit prediction of clinical performance. Only few studies have reported clinical use, including Nicolae et al.’s randomized trial in prostate brachytherapy [37, 38], Barten et al.’s first prospective experience in HDR prostate brachytherapy [213], and more recently Dickhoff et al. [209, 210], who used brachytherapy via artificially intelligent GOMEA-heuristic-based treatment planning (BRIGHT) framework, demonstrating that AI-based multi-objective planning can be feasibly applied in clinical HDR prostate and cervical brachytherapy. However, the limited number of clinical reports suggests either that AI has not yet been widely implemented in practice, or that clinical use is not consistently documented, both of which constrain patient benefit and hinder progress in the field. Across the 232 included studies, only 4 (1.7%) reported prospective or intra-operative application in patients: two in planning/optimization [38, 213], one in clinical needle reconstruction for prostate HDR [158], and one prospective evaluation of automated contouring for CT-based gynecologic brachytherapy [172]. All clinical implementations were single-center; no multi-center prospective validations were identified. In addition, several studies provided only qualitative comparisons with ground truth or conventional BT methods, further complicating clinical applicability prediction. This review is also limited by the low number of studies in clinical sites outside of gynecological or prostate cancer, and low number of independent testing cases or a lack of a testing/validation dataset. The current focus of AI applications on prostate and gynecological brachytherapy likely reflects both the global distribution of brachytherapy practice, where these sites account for the majority of treated patients, and the need for large, well-annotated datasets to train and validate AI models [20, 22, 23]. Smaller brachytherapy cohorts, such as head and neck or breast, are underrepresented in part because of data limitations as well as differences in institutional practice patterns and infrastructure [20, 22].
Conclusions
Artificial intelligence in BT has been applied across imaging modalities, such as MRI, CT, and TRUS. The reported performance includes applicator and needle reconstruction with localization errors of 0.7-16 mm, and OAR or target segmentation with DSC ranging from 0.60 to 0.97. Outcome prediction studies achieved AUCs of 0.60-0.90, while treatment optimization produced plans, which remained consistent with clinically delivered doses. This systematic review, the first to apply PRISMA methodology to AI in brachytherapy, demonstrates that AI consistently produces clinically acceptable and comparable treatment planning, with substantially reduced processing time compared with standard methods. Importantly, our findings also highlight persistent gaps, including the absence of large-scale prospective validations and a lack of consensus on which approaches are most suitable for clinical adoption. Addressing these gaps will be essential to transform AI from pre-clinical development into routine practice. Most available evidence remains retrospective. Adoption into routine practice will require prospective, multi-institutional studies, which validate complete, end-to-end workflows (reconstruction, segmentation, planning, and QA) against pre-specified clinical performance targets, report efficiency and safety metrics, and demonstrate generalizability across vendors and imaging modalities.


