

Purpose
Prostate cancer is the second most common cancer for men worldwide. Numerous curative treatment options are available. High-dose-rate (HDR) brachytherapy has been proven to be an excellent treatment option for intermediate- and high-risk prostate cancer [1, 2]. HDR allows dose escalation and high conformity leading to high local control and limited toxicity. HDR was traditionally used as a boost to external beam radiotherapy (EBRT), but is now evolving as a monotherapy as well [3-5].
Being a focalized treatment, HDR brachytherapy requires an imaging tool for catheter insertion, target delineation, and organs at risk (OAR) identification. After the insertion of catheters with transrectal ultrasound (TRUS) guidance, the contouring and dosimetry planning can be performed using TRUS, computed tomography (CT), and/or magnetic resonance imaging (MRI) [6]. The quality of treatment planning is directly based on the accuracy of the prostate contours and organs at risk (OAR) by a radiation oncologist (RO) [7].
The optimal imaging tool for HDR prostate planning is yet to be determined. It differs according to the assessed parameter. CT has been widely used for dosimetry planning, but offers less tissue contrast as compared to MRI or TRUS. The need to move the patient (legs down) in order to fit in the CT bore and acquire images, induce dosimetric uncertainties, including catheters shift [8]. TRUS is a compelling option since the soft tissue contrast is superior to CT and it does not require displacement of the patient between catheter insertion and treatment delivery. However, when using TRUS, implanted catheters and calcifications can create shadow artefacts affecting contours and reconstruction [9]. MRI offers excellent soft tissue contrasts, but has some limits, including procedure time, access to the machine, and image distortion when metallic hip prostheses are present [10, 11]. Previous studies have evaluated differences between imaging modalities [12-17], but none have compared CT and TRUS with catheters implanted, nor have assessed the impact of the learning curve ROs experience for prostate contours.
Our center treats over 250 prostate cancer patients with HDR per year. There were four ROs in the brachy-therapy team at the time of the study. Our HDR procedure has been using CT as the planning modality from 1999 to 2016, and a transition to TRUS planning was made in 2016. We therefore sought to evaluate the impact of the transition from CT to TRUS on planning volumes.
Our hypothesis was that TRUS would allow more reproducible target contours, therefore more reproducible and robust dosimetry, independently of a radiation oncologist’s experience. The aim of this study was to evaluate the changes in prostate contours, diameters, and volumes between the imaging modalities (CT and TRUS) delineated by four ROs. We correlated the impacts of ROs clinical experience upon the effect of changing CT to TRUS. Delineation was performed with both imaging modalities while catheters were implanted, to eliminate the confounding effect of comparing volumes with and without catheters. To our knowledge, this was the first study assessing this comparison with catheters implanted following a gold marker-based registration.
Material and methods
Patients and treatment
Thirty patients, treated with HDR boost of 15 Gy between February and December 2016, were imaged with both, CT and TRUS. They had intermediate- or high-risk prostate adenocarcinoma [18] confirmed by biopsy, and median age was 69 years. They completed external beam radiation therapy of 25 to 45 Gy, before or after HDR boost. The study was approved by the local ethics committee.
For HDR boost, each patient under general anesthesia, was placed in the lithotomy position before usual draping and installation of a Foley catheter. TRUS imaging was performed using the 8848 probe (BK Medical) to guide the insertion. An average of 17 catheters were inserted through the perineum into the prostate, and a TRUS 3-dimensional (3D) sagittal image was acquired (Oncentra Prostate). The treating RO then delineated the prostate on TRUS images. The physicist reconstructed the catheters and used the RO’s contours for dosimetry using an inverse planning simulated annealing algorithm (IPSA) [19]. The treatment was delivered using a source of iridium-192 (Flexitron, Elekta). Following the treatment delivery, the catheters were kept in place, the TRUS probe removed, and the patient’s legs were placed down to allow imaging with a CT on rail (Siemens Emotion) located in a brachytherapy suite. The RO also delineated the prostate on CT images, but the planning was made using TRUS images only.
Contours and registration
Four ROs participated in the study. The RO’s total experience, for low- or high-dose-rate brachytherapy, in number of years with TRUS-based implantation and CT-based planning was as follows: RO1 = 14, RO2 = 18, RO3 = 7, and RO4 = 2. At the time of the study, the four ROs had 2 years of experience specifically with HDR TRUS-based planning procedures. They all delineated the prostate on both imaging modalities, starting with the same modality for the 30 patients before switching to the next modality. Contours were blinded, meaning that CT could not be used to help with TRUS prostate delineation and vice-versa.
For a valid comparison between both imaging modalities, a rigid registration between CT and TRUS images was done for 20 of the 30 patients, using gold fiducials markers inserted in the prostate at the time of HDR boost. The remaining 10 patients did not have fiducials, so the registration was not performed for those 10 patients. A third year radiation oncology resident used gold markers to complete the registration (Velocity 3.2.1, Varian) (Figure 1). All registrations were reviewed by an experienced RO, and registration errors were calculated for each gold marker.

Statistical analysis
First, prostate volumes given per the four ROs delineations on Oncentra Prostate were compared using a paired t-test. Intra-class correlation coefficient (ICC) was calculated as a reliability analysis for both correlation and agreement between volumes values, with a minimal acceptable value of 0.8, as described in Fotina et al. [20, 21].
We assessed inter-observer agreement, meaning concordance in the data (delineations in this case) recorded by different individuals assessing the same thing [22]. We used Jaccard index (JI), an overlapping metric suitable to compare contours for pair-wise comparisons, for all pairs of ROs for the 20 patients with a rigid gold fiducial registration. For this index, the perfect score is 1, meaning a 100% spatial overlapping between 2 sets of contours under review. A repeated measures ANOVA was then used on the gold marker patient dataset to compare JI for each pair of RO for CT and TRUS, and for every set of contours. A complete patient dataset was used to measure diameters at mid-plan for each prostate contour, for each axis, using CT and TRUS, and they were then compared with a repeated measures ANOVA. We confirmed the number of pair of ROs, for which mean diameter was significantly different when diameters had a computed repeated measures ANOVA, with a p value < 0.05 between 2 compared ROs. Having four ROs, there were a total of six possible pairs of them for each modality.
Intra-observer agreement was evaluated using JI and t-test to assess the difference between CT and TRUS contours for each RO. We assessed the 20 patients with a gold fiducial marker registration between two image modalities. We expected to evaluate a prostate shape change due to antero-posterior compression by TRUS probe.
Results
The intra-class correlation for the 30 patients’ prostate volume was 0.836 (95% CI: 0.646-0.923%) for CT and 0.937 (95% CI: 0.894-0.966%) for TRUS, meaning that the reliability of comparison reached the 0.8 minimal acceptable value for both modalities. The mean prostate volume was 42.71 cc (95% CI: 37.28-48.12%) for CT and 35.18 cc (95% CI: 30.54-39.82%) for TRUS, with respectively 14.51 cc and 12.42 cc standard deviation for all ROs. The paired samples correlation between CT and TRUS was 0.949 (p < 0.01), confirming a strong correlation between CT and TRUS volumes. The average volume ratio of TRUS/CT was 0.827 (95% CI: 0.792-0.863%), meaning that the prostate volume was 17% larger on CT than on TRUS.
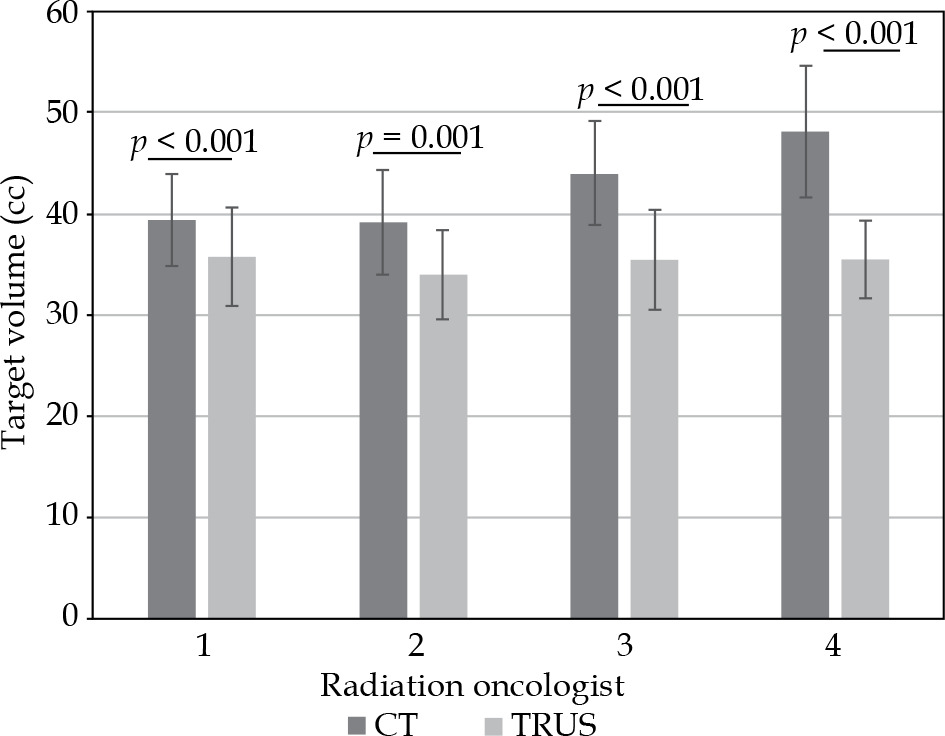
Figure 2 shows mean volume for each radiation oncologist for CT and TRUS. The CT mean volumes were smaller for the ROs with more clinical experience, with a mean between 39.21 cc and 44.09 cc for RO1-2-3 compared to a mean of 48.10 cc for RO4. This learning curve effect was not present with TRUS, where RO4 had a mean prostate volume similar to the three other ROs, with a mean volume of 35.47 cc for RO4 vs. values ranging between 34.04 and 35.74 cc for RO1-2-3.
Fig. 2
Mean prostate volume by radiation oncologist and imaging modality; computed tomography (CT) and tran- srectal ultrasound (TRUS)
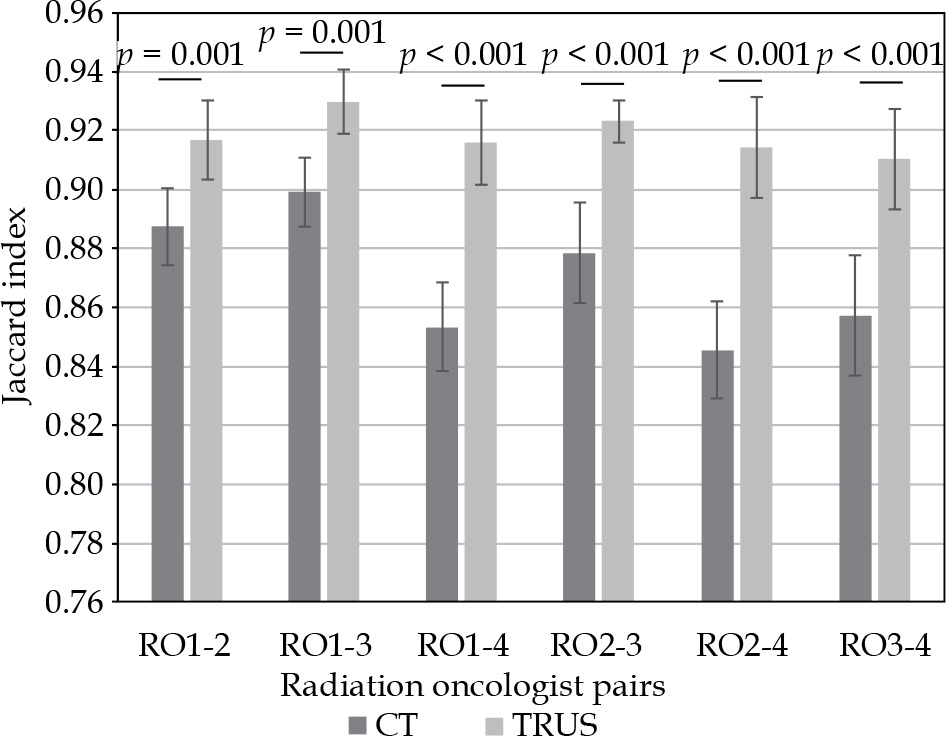
The rigid registration using gold fiducials confirmed a mean difference for the distance of each fiducial marker in each axis on TRUS vs. CT of 0.78 mm, 0.73 mm, and 1.15 mm. This registration permitted inter-observer evaluation using JI as shown on Figure 3 for each pair of RO on CT and TRUS for 20 patients, which had gold fiducials to guide the registration. The mean JI was 87% (95% CI: 0.86-0.88%) for CT and 92% (95% CI: 0.91-0.93%) for TRUS when comparing all four ROs. The mean JI for the prostate on CT was significantly higher (p = 0.00005) when comparing RO1, 2, and 3 together (RO1-2, 1-3, and 2-3; mean = 89%) than when comparing RO4 to the others (RO1-4, 2-4, and 3-4; mean = 85%). For the prostate TRUS planning, the mean JI was not significantly different (p = 0.076) when comparing ROs with or without RO4 (91% vs. 93%).
Fig. 3
Jaccard index for each radiation oncologist (RO) pair, on computed tomography (CT) and transrectal ultra- sound (TRUS)
We also compared three prostate mid-plan axis diameters for the 30 patients to confirm which axis of the contours made the biggest difference in volumes between ROs. Table 1 reveals that both antero-posterior (AP) and supero-inferior (SI) axis had 4 out of 6 pairs of RO, with a significant difference with CT, but 0 out of 6 with TRUS. The only significant difference for TRUS was for the left-right (LR) axis, meaning that one RO made a larger contour.
Table 1
Comparison of mean length in mm for each diameter in the left-right (LR), antero-posterior (AP), and supero-inferior (SI) mid-plan axis for each radiation oncologist (RO). The maximum number of pairs of RO is 6 for each modality, and there is a statistically significant difference between mean length of ROs pairs when p < 0.05
Comparing the diameters length directly between CT and TRUS assessed the intra-observer agreement. Table 2 shows mean diameter difference between CT and TRUS for each RO, and states which were significantly different. The only axis with a positive significant difference for each RO was AP.
Table 2
Comparison of mean difference between CT and TRUS in mm and identification of radiation oncologist (RO), for which there is a statistically significant difference (p < 0.05) between CT and TRUS for each mid-plan axis (LR – left-right, AP – antero-posterior, SI – supero-inferior)
Discussion
When comparing prostate volumes using CT and TRUS for HDR brachytherapy, our experience demonstrates that although volumes correlate spatially (0.949, p < 0.01), CT volumes are in average 17% larger than TRUS volumes. The inter-observer agreement for prostate contours was significantly smaller with TRUS (JI of 92% for TRUS vs. 87% with CT). AP and SI diameters had larger differences for CT than for TRUS. The intra-observer prostate contouring using CT and TRUS for each RO showed JIs between 80% and 86%. The AP diameter was significantly larger on CT for each RO, indicating a prostate compression in this axis by the TRUS probe.
When comparing the prostate volume ratio between CT and TRUS, our results are in line with the available literature. Smith et al. compared contours on multiple brachytherapy imaging modalities, with images obtained without catheters one month after the implant. Their average volume ratios were 1.16 for CT/MRI, 0.90 for TRUS/MRI, and 1.3 for CT/TRUS [17]. Results obtained by Hoffelt et al. in a similar experiment was a ratio of 1.5, but TRUS volume was calculated using ellipsoid formula and CT volumes with the contours of one physician [16]. The ellipsoid formula only gives a correlation coefficient of 0.55, when compared to fresh prostate specimen weighed and measured to obtain length [23]. Therefore, the magnitude of difference between CT and TRUS found in the literature is variable, but with the CT volume being systematically larger than the TRUS volume. Our study is, to our knowledge, the only one to directly compare CT and TRUS with the catheters in place, without any bias from an ellipsoid formula estimation, and a registration using gold fiducial markers.
Diameter comparisons between ROs and between imaging modalities were obtained to determine the origin of the variation in volume differences. The largest difference between the RO prostate contours were for the AP diameter and SI diameter, both on CT, each had 4/6 pairs of RO with a statistically significant difference (p < 0.05). The superior-inferior difference depends strongly on the apex and base determination by RO. Soft tissue contrast makes it difficult on CT to differentiate the prostate from the genitourinary diaphragm at the apex. The base identification may also overestimate the prostate size if the bladder neck is incorrectly included in the prostate contour [24]. An important clinical parameter to consider is penile bulb dose, because it has been reported that it is related to toxicities, such as erectile dysfunction [25-27]. Therefore, correct identification of the prostate apex is critical to limit the distal dose that could induce significant morbidity.
Prostate diameters for CT and TRUS contours were also compared for each RO. Our results show a significant difference for every RO only for the AP diameter, between 2.5 and 7.3 mm on average, confirming the hypothesis that the rectal probe compresses the prostate in the AP axis. Previous studies did not compare images specifically for HDR prostate brachytherapy, with catheters in place for both CT and TRUS. Grisotto et al. also found a prostate compression by transrectal probe with a reduced AP diameter, when comparing MRI images and TRUS images, with different probe sizes [13]. It has also been demonstrated by some MRI studies that a rectal probe does affect the shape of the prostate [28, 29]. Stijn et al. obtained a variation of 15.7%, 7.7%, and 6.3% for AP, LR, and SI diameters, respectively, when comparing images with and without a probe [30].
Our inter-observer assessment confirmed the hypothesis that using TRUS permits more reproducible prostate contouring. JI is a valuable tool to compare spatial superposition of volumes, and confirms a significantly smaller difference when using TRUS (mean JI = 92%) than when using CT (mean JI = 87%). This difference is probably due to the superior soft tissue contrast with TRUS than with CT. Our results also indicate that there is a correlation between clinical experience of ROs and inter-observer variation for prostate CT contours. As reported above, the mean JI was significantly different when comparing RO1, RO2, and RO3 together (meaning the three ROs with a clinical experience of ≥ 7 years) and when comparing RO4 (2 years of experience) with the three others, with mean JI of 85% vs. 89% (p = 0.00005). There was no detectable learning curve effect for prostate contours using TRUS. This is a significant result for centers starting out with TRUS HDR procedure.
Our study was designed to report the inter-observer and intra-observer variation for prostate HDR brachytherapy contours. We had four ROs to delineate the prostate on both CT and TRUS without using other modality for guidance, which corresponds to clinical practice. The rigid registration between CT and TRUS contours permitted an analysis of the volume overlap using Jaccard index. The registration was possible for 20 patients who had gold fiducials in place inside the prostate. Rigid registrations are often made using the urethra as a point of reference, but since legs position is different between CT and TRUS, the orientation of Foley catheter and hence the prostate is modified between two images. Catheters were implanted for both imaging; therefore, a direct comparison of volumes was possible, which was not the case in previous studies comparing CT and TRUS.
When selecting an imaging modality for HDR prostate treatment planning, a clinical team must consider strengths and limits of each modality. CT imaging is feasible for almost all patients, also when intra-prostatic calcifications limit the use of TRUS. It also allows for a fast and reliable identification of catheters. However, it offers poor soft tissue contrast. MRI has a superior soft tissue contrast but it requires more time, more space, and is more expensive for brachytherapy department. Also, some patients with contraindications cannot be imaged on MRI, including most implantable cardiac devices and metallic prosthesis. TRUS imaging is a fast, cheap, and easily available option for most departments. It is already used for catheter insertion and offers good soft tissue contrast. Its’ main disadvantage is that the catheters shadow artefacts can be challenging when contouring both target and OARs. This may however be minimized using a pre-insertion acquisition as a reference for delineation. The catheters reconstruction can be difficult, but emerging technologies, such as electromagnetic tracking, are making their way into the clinic and they could streamline prostate TRUS-based HDR brachytherapy [31-34].
A limitation of this study was that only 20 patients out of 30 had gold fiducial markers inserted in the prostate, which were then used for registration between CT and TRUS image sets. The CT/TRUS differences observed in JI and prostate diameters, while statistically significant, were relatively small, and therefore may not be clinically meaningful. Furthermore, to assess more statistical power of the learning curve effect, more ROs with different clinical experiences in both CT and TRUS would be needed.
Conclusions
In conclusion, TRUS is an appealing imaging modality, since the inter-observer agreement is smaller than with CT (average JI of 92% vs. 87%). To our knowledge, the present study is the first to demonstrate that inter-observer agreement is dependent on a RO clinical experience when using CT, but not when using TRUS, which corresponds to a learning curve effect. The superior soft tissue contrast offered by TRUS seems to insure a RO independent prostate planning, which might lead to more homogeneous clinical outcomes.