

Purpose
Radiation therapy is an important part of cancer treatment combined with chemotherapy and surgery. Radiation therapy can be broadly classified into two types, such as brachytherapy and external radiation. High-dose-rate (HDR) brachytherapy utilizes radiation emitted from a capsule (hereafter referred to as ‘source’) containing a radioisotope, such as iridium-192 (192Ir) or cobalt-60 (60Co). A tubular instrument, called an ‘applicator’ or ‘catheter’, is inserted into the patient providing a route, through which the source is delivered to the target, and the target is irradiated by the source. The extent and intensity of irradiation are determined by examining dwell time and position of the source using a radiotherapy planning system. A dose per fraction is defined to be approximately 5-6 Gy at a point A, as defined in the International Commission on Radiation Units report 38 [1]; a dose per fraction in brachytherapy is higher than that of a typical external radiation. Although higher doses are more effective in treating tumors, brachytherapy involves a higher risk of inaccurate irradiation to the patient. Methods to prevent radiation therapy errors have been developed for external radiation [2, 3]. However, these methods have not been established for brachytherapy, and their implementation depends on the efforts of each facility [4]. The International Commission on Radiological Protection (ICRP) Publication 97 reported the actual source dwell at a position that differ from the treatment plan, incidents in which the source is stuck to the applicator, and incidents due to using wrong length of catheters [5]. To detect these events, the Nuclear Regulatory Commission highlighted the importance of verifying treatment plans that involve irradiation [6]. Several studies have been conducted to detect the source dwell position during irradiation [7-18]. However, these methods require special equipment and instruments, and can be challenging to utilize. In addition, these methods analyze the relative source position; therefore, a mispositioned applicator may not be correctly detected. The purpose of the present study was to construct a system for analyzing the source position during irradiation using computed tomography (CT) scout images. The novelty of this study was that the system utilized CT images for image-guided brachytherapy, and is highly versatile enabling analysis of absolute coordinates.
Material and methods
Using a CT scout image, dwell position coordinates of the source during irradiation were analyzed using an in-house MATLAB program. A scout image is a 2-dimensional image acquired to determine an accurate scan volume and scan location [19]. In the acquisition of CT scout images under different imaging conditions section, we examined whether the source could be identified in CT scout images that were acquired though source dwelled in the applicator under different imaging conditions and phantom positions. In the source dwell position detection program section, we analyzed source dwell position from the acquired CT images using an in-house MATLAB program, and compared them with source dwell positions in treatment plans.
Acquisition of ct scout images under different imaging conditions
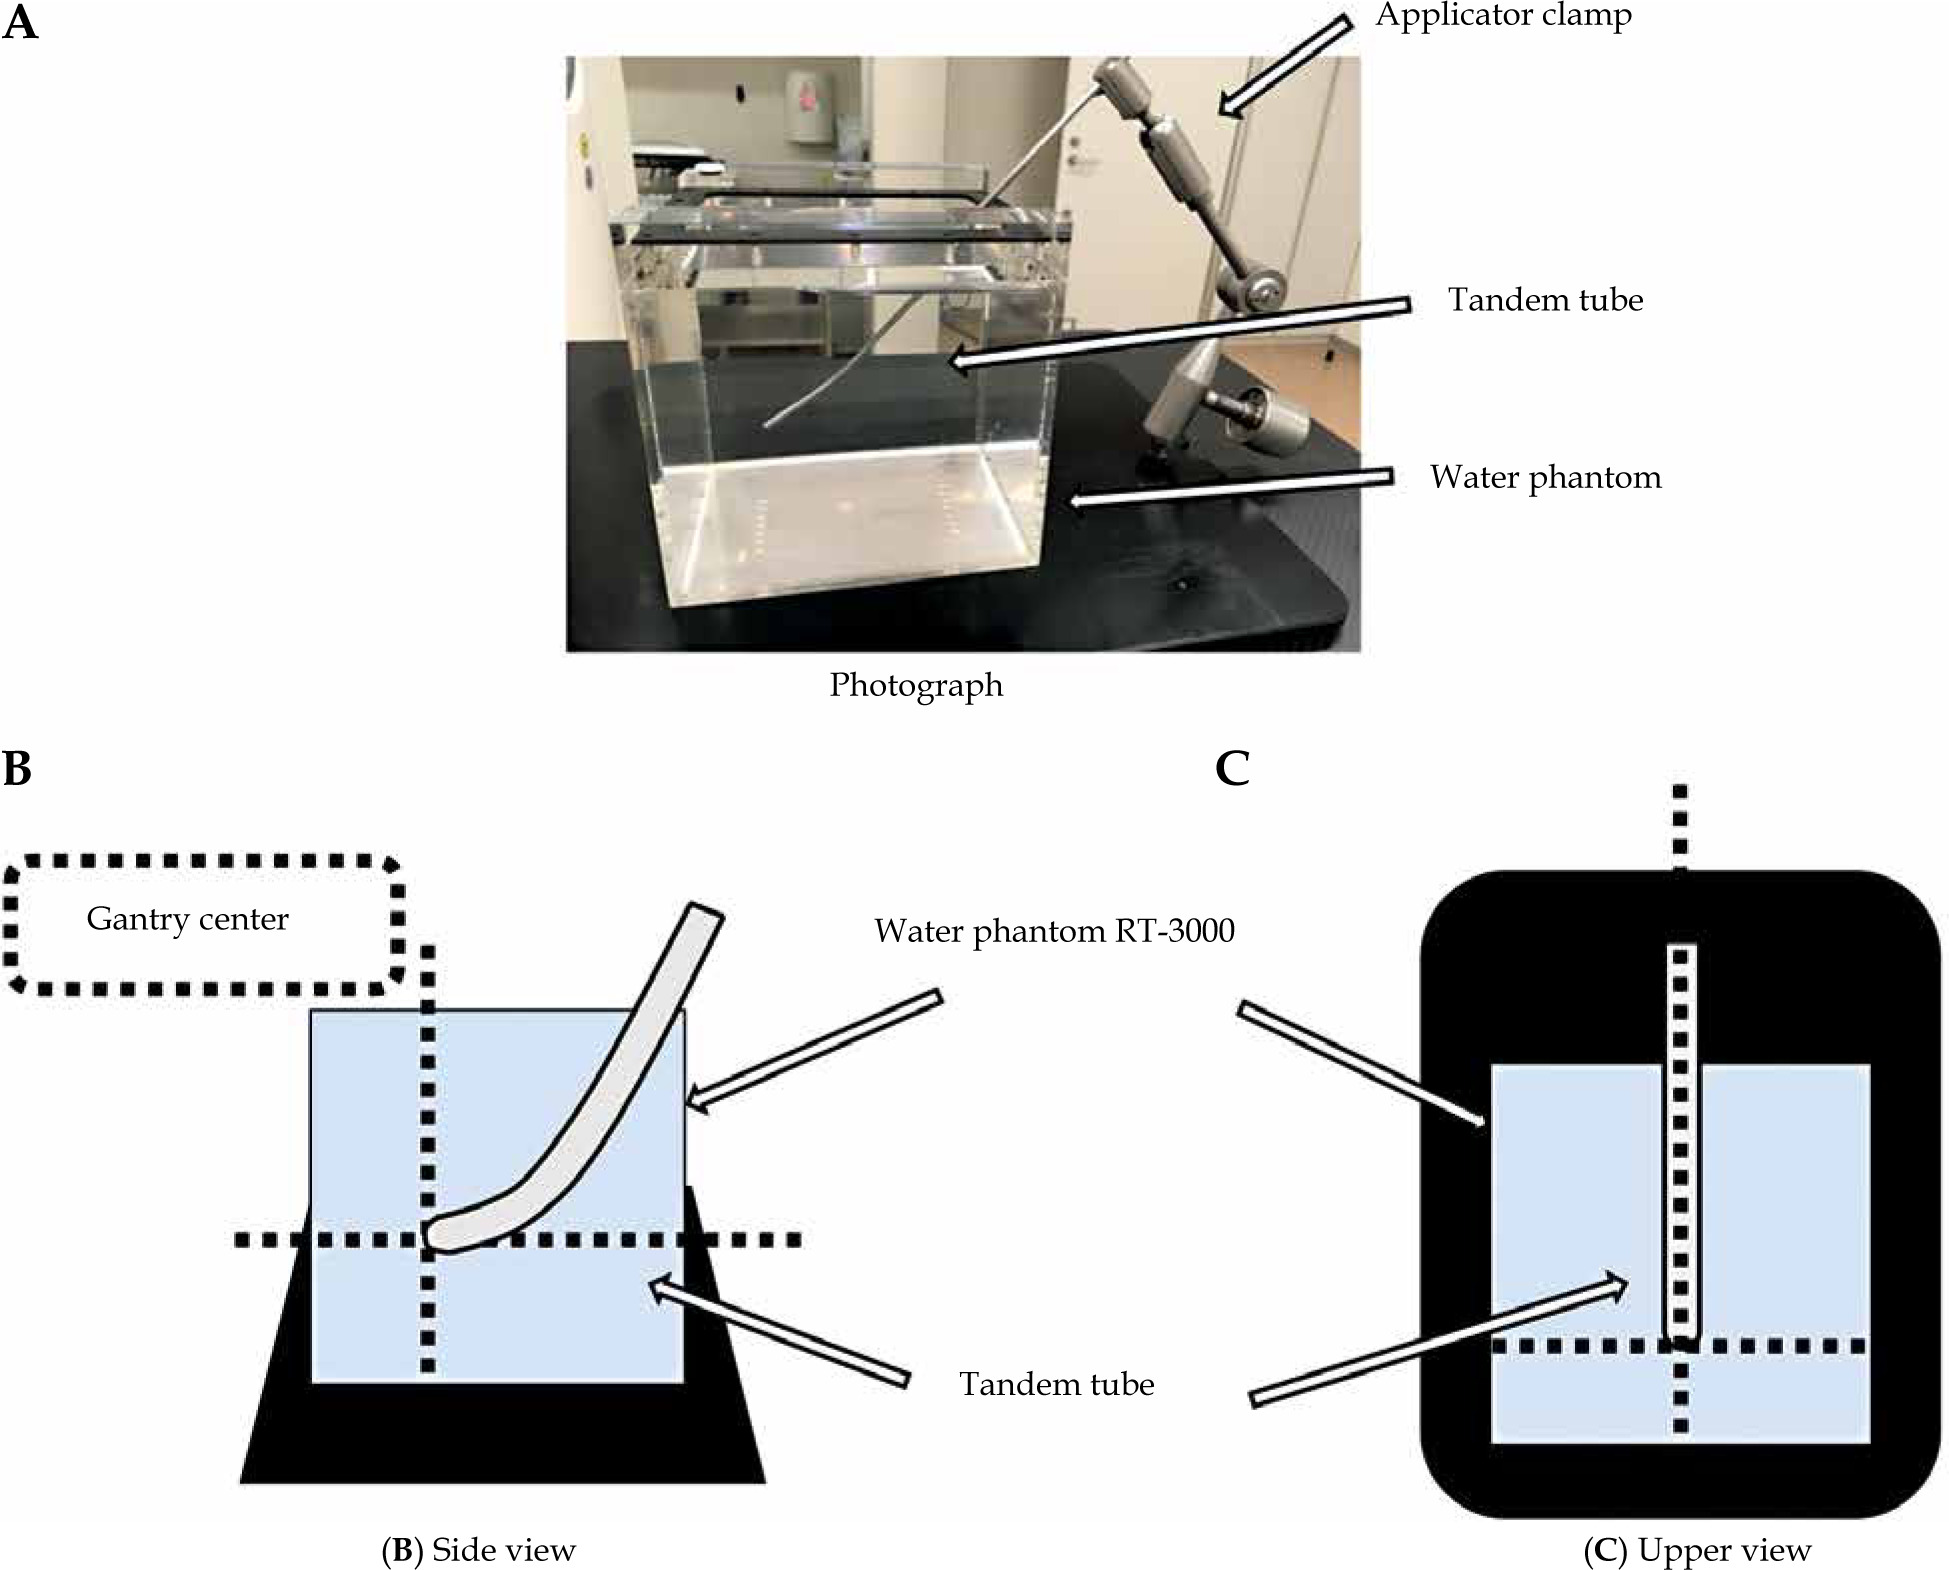
Computed tomography scout images were acquired while the source dwelled in the applicator. Figure 1 shows the standard arrangement of the applicator. A 15° tandem tube from the Fletcher Williamson Asian Pacific applicator set (Elekta, Sweden) was inserted into water-filled phantom (RT-3000, R-TECH, Japan) and fixed with an applicator clamp. This study was considered to be implemented into clinical treatments. The applicator in the water phantom simulated a patient under treatment. Dotted lines in two illustrations indicated a CT gantry center. The tandem tube tip was positioned in the center of CT gantry. Positioning accuracy of the CT gantry was ±1 mm.
Fig. 1
Installation of water phantom and tandem tube for a standard arrangement. A) An overall view of the set-up. B, C) The po -sition of tandem applicator in the CT gantry. Dotted lines indicate the CT gantry center
CT system used was SOMATOM Definition AS Open (Siemens Healthineers, Germany) that allowed only the gantry movement during imaging. Slice thickness and reconstructed slice thickness were both 0.6 mm, and tube voltage was set to 120 kVp; an automatic tube current control mechanism was applied to deliver a tube current of 300 mA for a body weight of 70-80 kg. CT images were then acquired with X-ray tube rotation time of 0.5 seconds. Treatment planning was performed using radiotherapy planning system Oncentra Brachy (Elekta, Sweden) version 4.6.0 with the acquired CT images. The first dwell position of the source was 1,500 mm from the source storage, and the second was 10 mm from the first dwell position. Irradiation was conducted according to the treatment plan using a microSelectron HDR v.3 (Elekta, Sweden). Air-kerma rate of the source was 19.712 mGy-m2/h at the time of the study. The source was dwelled for 20 seconds at each position.
The following imaging conditions were examined. In arrangement (1), the longitudinal axis of the applicator was parallel to the travel direction of the CT gantry, and the tip of the applicator was in the center of the gantry. CT scout images were acquired, while an 192Ir source microSelectron v.2c (Elekta, Sweden) was in the applicator under conditions detailed in Table 1. The effects of different imaging conditions and applicator geometry were examined on the accuracy of source detection. All tube voltages were set to 120 kVp. Arrangements (2) and (3) were used to examine whether the proposed method affects the source detection when the applicator was not in the center of CT gantry. In arrangement (4), an actual clinical situation was simulated; imaging of an applicator inserted into a patient at a fixed position is difficult in practice, hence it must be imaged on an arbitrary position. As presented in Figure 2, X-ray tube was oriented TOP when it was above the bed, BOT when it was below the bed, and LAT when it was on the right-hand side of the bed (when viewed from the applicator tip).
Fig. 2
CT scout image acquisition indicating imagingdirections. TOP, LAT, and BOT images were taken fromupper, right side, and bottom sides in the CT gantry, respectively
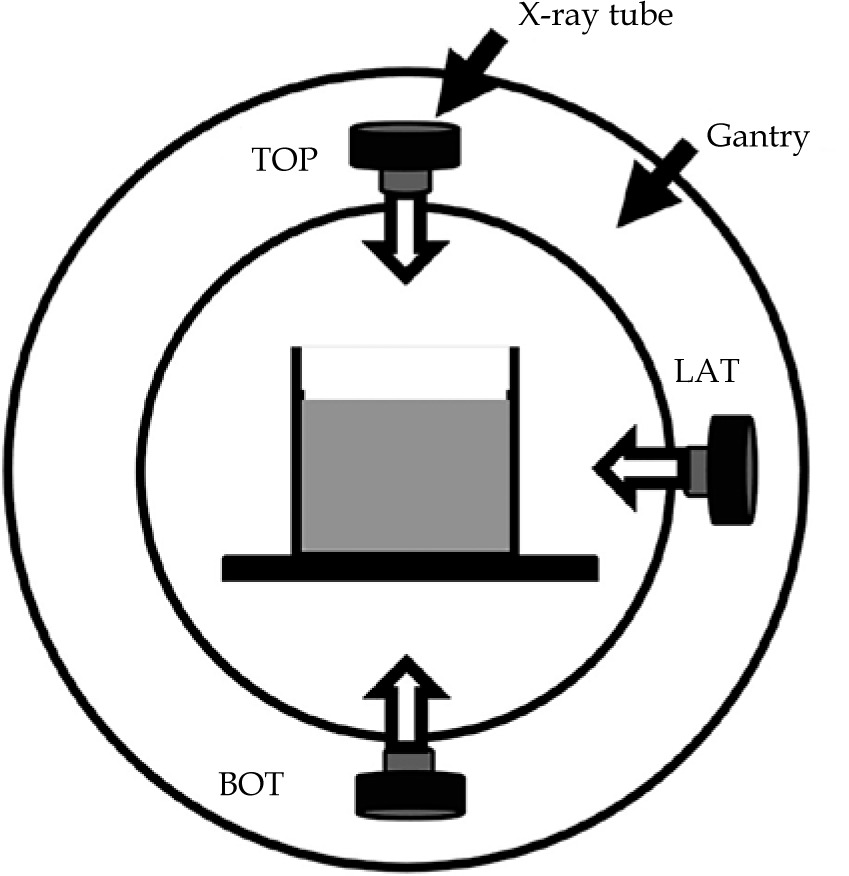
Table 1
CT scout imaging conditions and applicator geometries for four different arrangements
Source dwell position detection program
A program to detect the source dwell position from CT scout images was created using MATLAB 2019a (MathWorks, MA, United States); this program analyzed coordinates of the first and second dwell positions of the source in three dimensions by combining either TOP or BOT images, which were in XZ plane with LAT image, which was in YZ plane, as shown in Figure 3.
Fig. 3
Axial directions with respect to experimental phantom set-up. X and Z directions are vertical and parallel, respectively, to the direction of CT gantry movement direction. Y direction is from lower to upper side of the water phantom
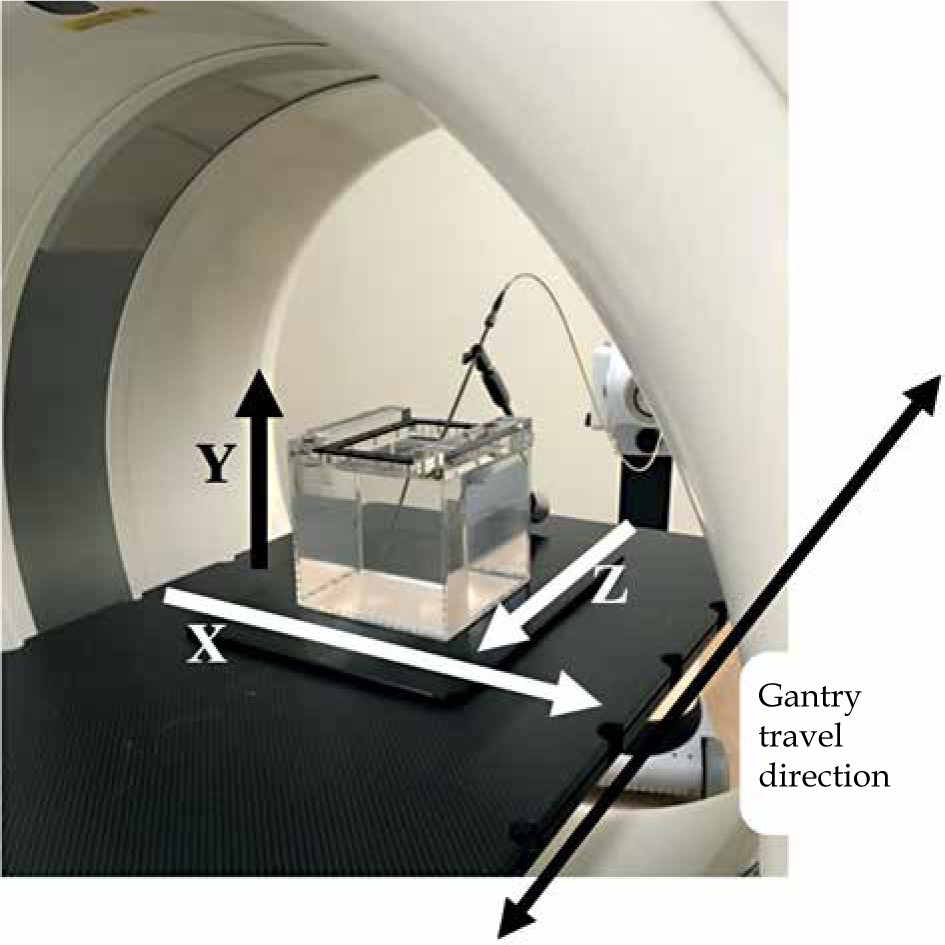
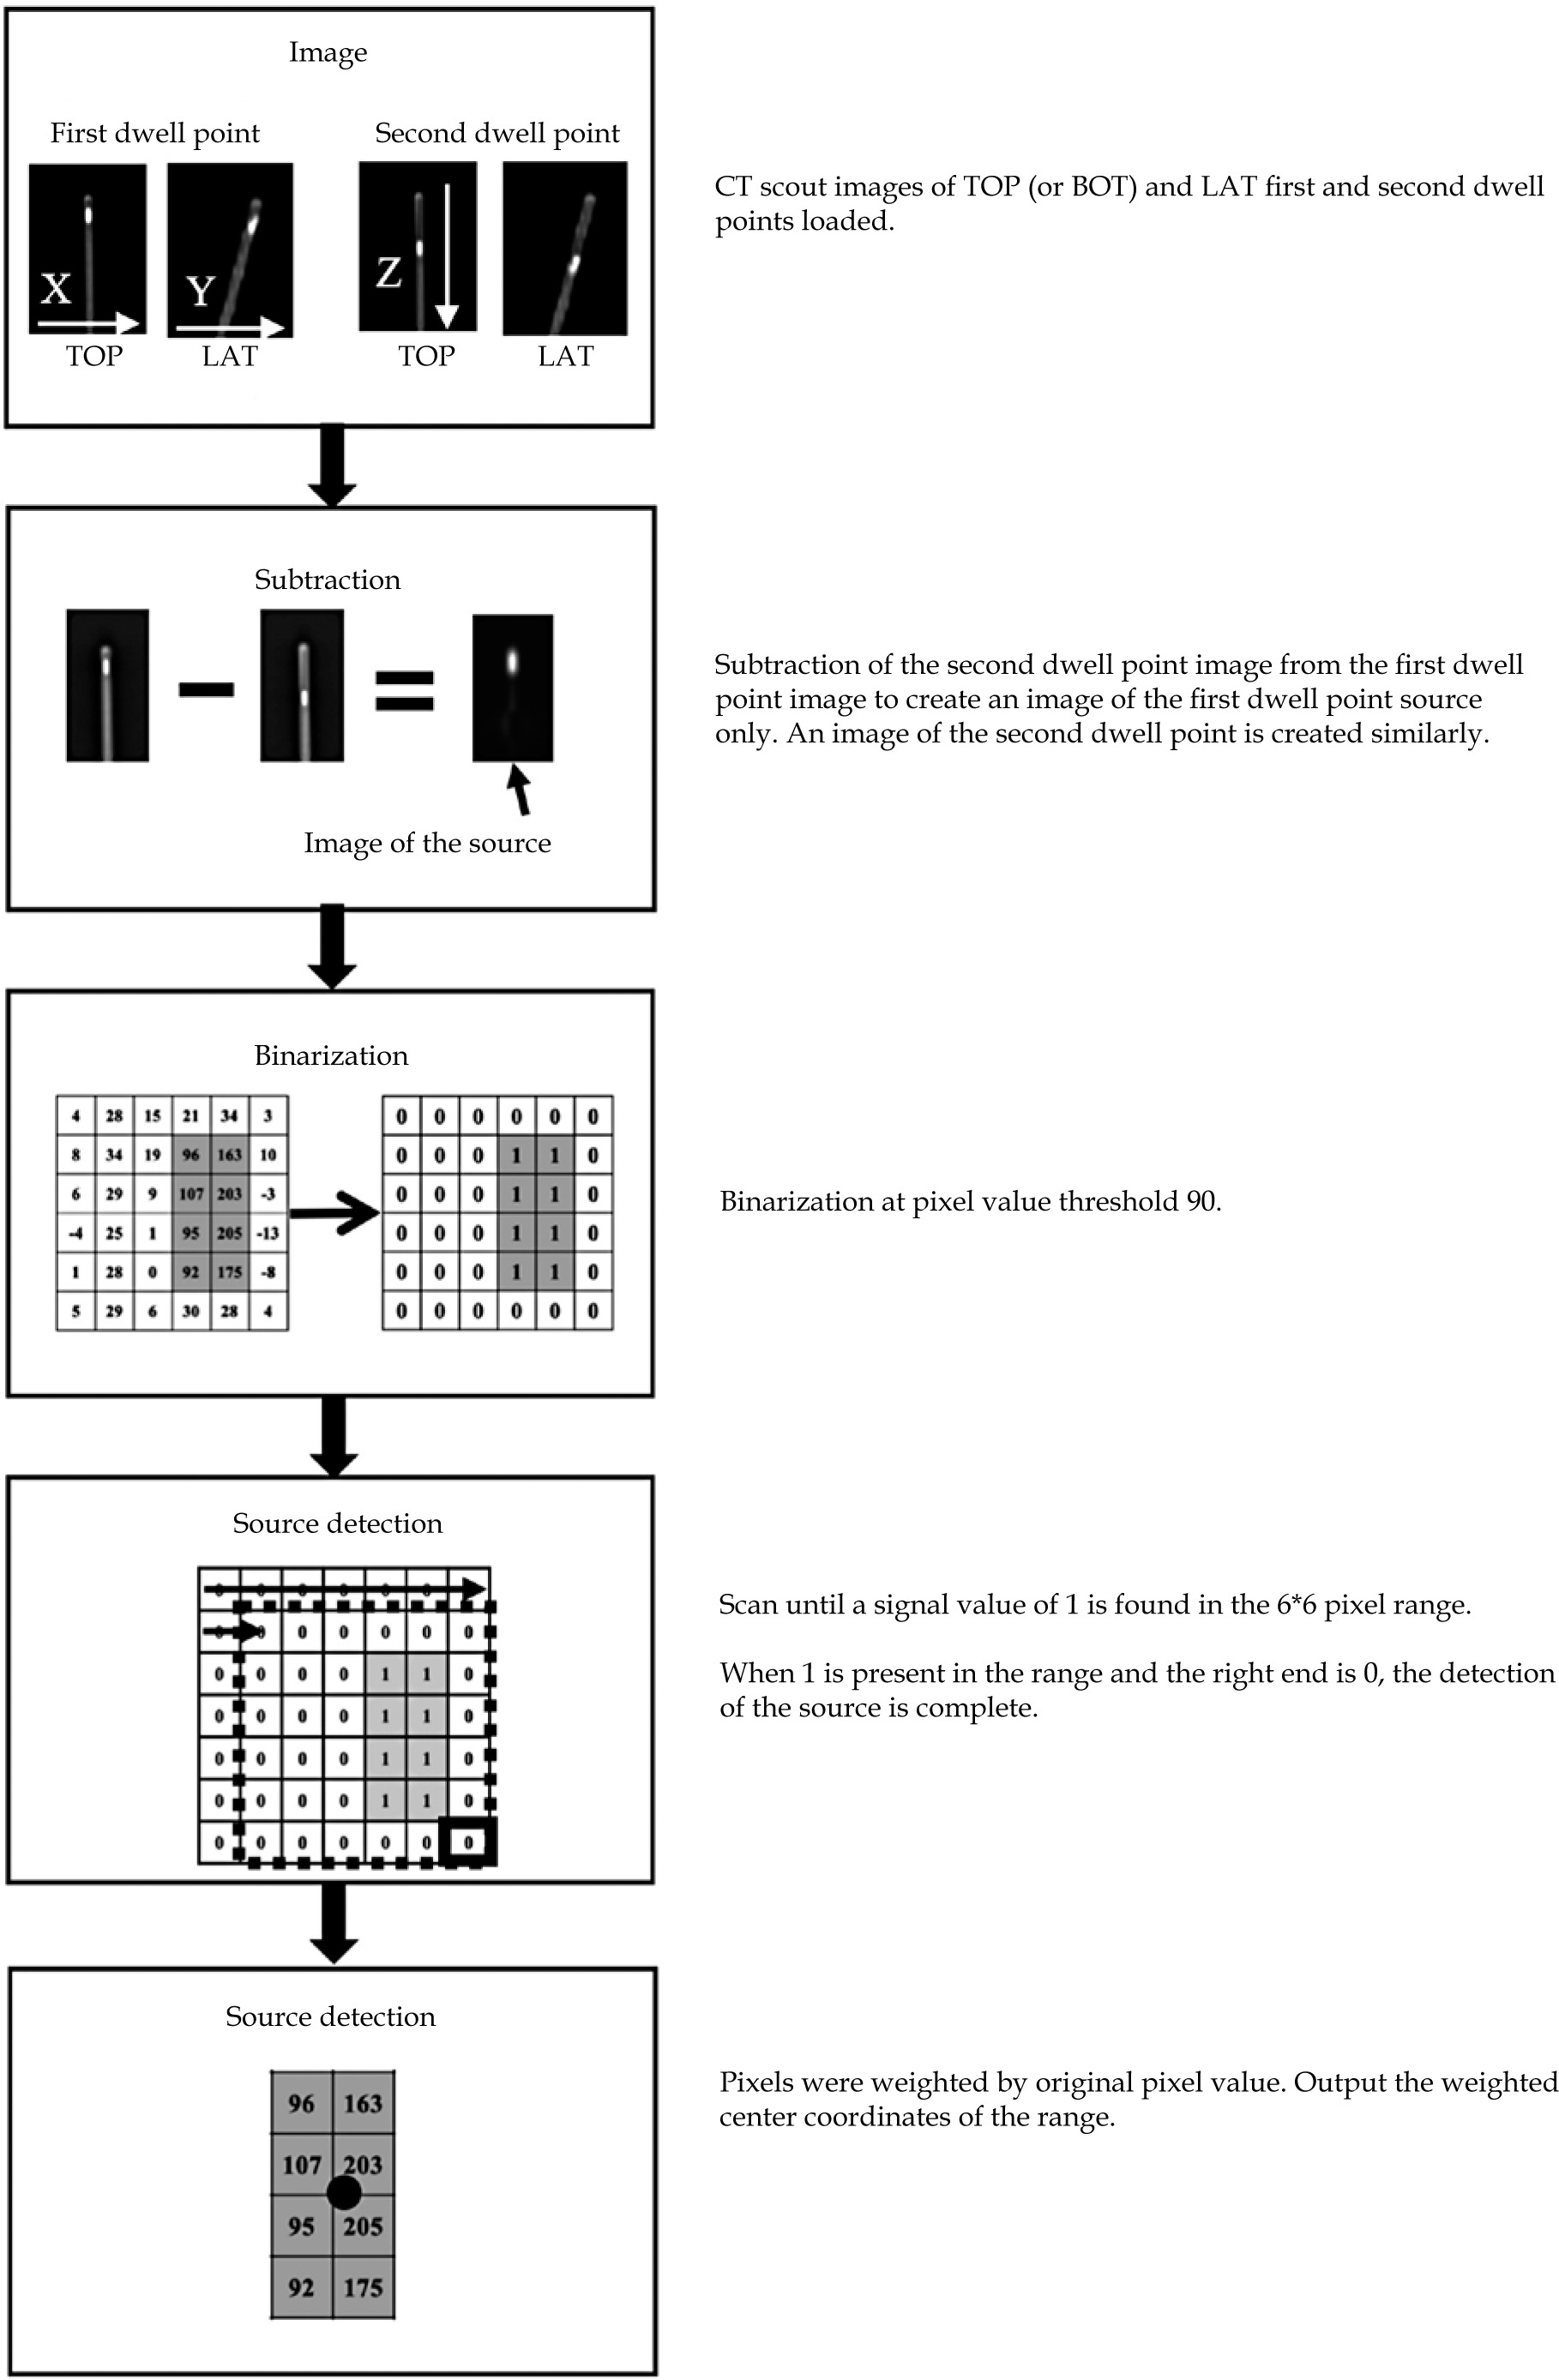
Figure 4 demonstrates a representation of MATLAB program. An image of the source at the first dwell position was created by subtracting an image taken at the second dwell point from a loaded image taken at the first dwell point. Similarly, an image of the source at the second dwell position was created by subtracting an image taken at the first dwell point from an image taken at the second dwell position. Binarization was performed with a pixel value threshold of 90. This value was determined to be the threshold pixel value, at which the source and the rest of the range could be distinguished based on an analysis of a combination of TOP and LAT images from the standard arrangement (1). Detection was carried out in a 6 pixels squared range, starting from the upper left of the image when the signal value was 1, and concluding at the lower right edge when the range reached 0. In the detected range with a signal value of 1, pixels were weighted by the original pixel value. The weighted center of the range was then used as a coordinate of the source dwell position. The number of pixels in the image was 512 pixels squared, with 1 mm/ pixel. In addition, an 8-direction labeling process was applied, so that the source could be recognized even if it was not placed parallel to a specific axis. The detected source dwell coordinates were only compared with the treatment plan in the z-direction. The source dwell position of the treatment plan was obtained in digital imaging and communications in medicine (DICOM) format. In accordance with AAPM TG56 guidelines [20], the system was judged appropriate when the coordinates of the source detected by the program were within ± 1 mm of those detailed in the treatment plan.
Results
Effects of different imaging conditions
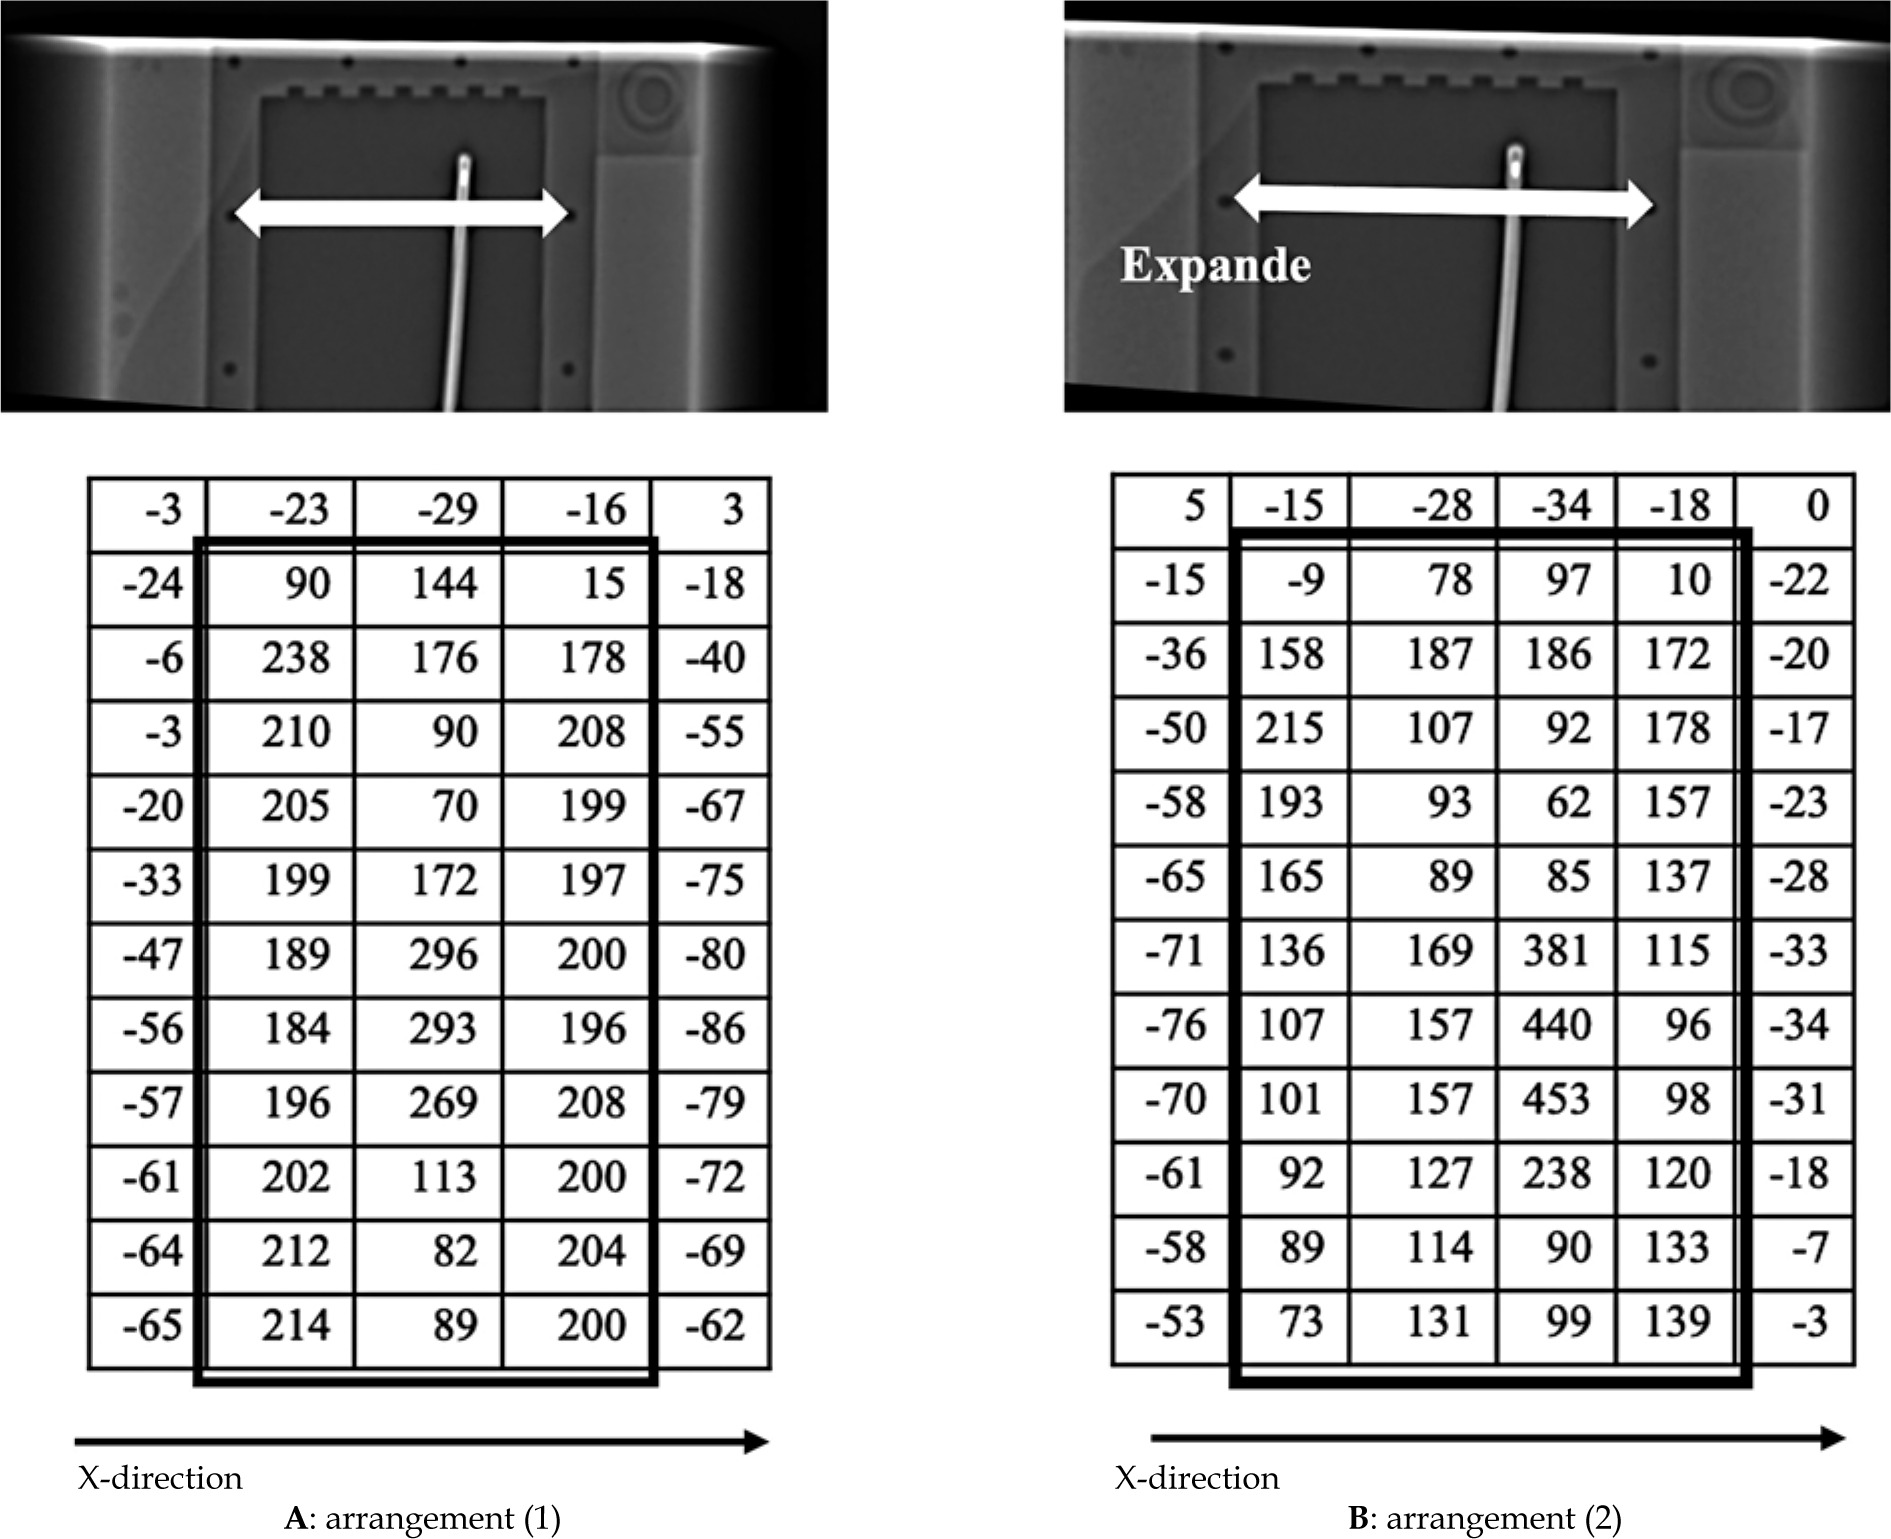
The source was visually confirmed to be inside the applicator under all conditions in CT scout images acquired in this study. The average of subtracted pixel values in the range taken to include the applicator tip, source, and surrounding pixels against standard arrangement (1) were ±0.42 for (1-b) and ±0.47 for (1-c). Figure 5 shows BOT images and pixel values for arrangements (1) and (2). Pixel values corresponded to the applicator tip and source area for different phantom placement positions. The image of the water phantom in Figure 5B was enlarged. The width of the water phantom lid fastener, indicated by a two-way arrow, increased by 127%, from 8.6 mm to 10.9 mm. The enlargement of the image in the x-direction was visually clear in BOT images. Close to the applicator tip, the positive range of pixel values was one pixel wider in the x-direction (Figure 5B), as indicated by the bold rectangle.
Comparison of source dwell position coordinates obtained from detection and the treatment plan
The (x, z) coordinates were obtained from the analysis of TOP and BOT images, and the (y, z) coordinates were obtained from the analysis of LAT images using the in-house MATLAB program. Table 2 shows the difference between z-coordinates obtained from each image from the in-house program and the treatment plan. The mean and standard deviation (1 SD) of the difference were –0.47 ±0.25, –0.24 ±0.20, and –0.39 ±0.19 mm for TOP, LAT, and BOT images, respectively. Values exceeding this range were found in TOP images at the first dwell position and BOT images at the second dwell position for arrangement (1-c), and in LAT images at the second dwell position in arrangement (2). All values were within ±1 mm under all conditions.
Table 2
Difference between program output and treatment plan coordinates
The source coordinate was undetectable in the analysis of TOP and LAT images for arrangement (1-b). In addition, the analysis of TOP and LAT images for arrangement (1-c) output more coordinates than the number of actual dwell positions. In Table 2, the nearest value to the z-coordinate of the treatment plan is shown. According to periodic quality control at our institute, the source was confirmed to be within ±0.5 mm of the designation of irradiation equipment using a source dwell position confirmation tool (Elekta, Sweden).
Discussion
Differences in ct scout images due to different imaging conditions
Variations in the tube current did not result in differences in pixel values of CT scout images. Therefore, we can conclude that our program can detect the source regardless of imaging conditions, when the tube current is within the range of 20-45 mA. Previous studies have reported that the object to be imaged appears vertically elongated in images when it is not in the gantry center or extremely far from X-ray tube, and horizontally elongated when it is close because of the magnification ratio [21]. In the phantom position arrangement (2), the applicator was located far from the X-ray tube. In TOP image in arrangement (2), the image was enlarged in the z-coordinate of the applicator. However, no differences were observed in the position or number of pixels with high values, suggesting that the magnification in the z-direction was less than 1 mm. In arrangement (3), the applicator was positioned at the edge of both TOP and BOT images. The image was enlarged in the x-coordinate in BOT image, with one additional row of pixels with a positive value, indicating the presence of the applicator. Therefore, the expansion in the x-coordinate was greater than 1 mm. This enlargement was caused by a fan beam. Scout images are produced using a fan beam X-ray collimated in 0.6 mm/detector in the center of the gantry. In the z-direction, the X-ray width was 0.6 mm, which was very narrow; therefore, the impact for enlargement was very small. In the x-direction, 6 detectors that were lined up in an arc were applied. The enlargement occurred in the x-direction for TOP and BOT images, and in the y-direction for LAT images. Therefore, the positions in x- and y-directions were inaccurate. In addition, depending on the distance from the gantry center, objects being imaged could be magnified or demagnified. Therefore, in this study, only z-direction coordinates analyzed by the system were compared with those of the treatment plans.
Detection of source dwell position using in-house matlab program
The source dwell position was within ±1 mm of that defined in the treatment plan in all images, which was within the tolerance limit for dwell position accuracy recommended by AAPM TG56 [20]. However, even though they were within acceptable limits, the coordinates of the detected source dwell position tended to have a negative displacement with respect to the treatment plan, that is, closer to the connection between the applicator and irradiation equipment. This may be because of the structure of the source. The core of the source is sealed inside a stainless-steel capsule, and the center of the source core is 0.25 mm closer to the tip than the center of the capsule. Coordinates of the source dwell position in the planning system were defined as the center of the source core. In contrast, the proposed method that considers a range of high pixel values as the source, outputs the center of the source capsule as the coordinates of the source center. Therefore, the value obtained by our proposed method would be negative compared with that defined in the treatment plan. When investigating the effect of different imaging conditions, the analysis became impossible when the binarization threshold value was 90 for (1-b) and (1-c) arrangements. This might be because several points were mis-detected as sources. The source of the subtraction image produced for analysis consisted of a series of five pixels values exceeding the threshold of 90. The distance per pixel was 1.0 mm, indicating that a series of five pixels covers a larger area than the actual source. The program is designed not to recognize a single pixel or more than five pixels that exceed the threshold value as a source to prevent false detections, which may be the reason for the source not being detected by the program. As shown in Figure 6, another reason for misdetection was that the pixels with values exceeding 90 were next to each other in the area corresponding to the applicator in TOP images for arrangement (1-c), resulting in the recognition of multiple sources. Figure 6 shows a subtracted image for detecting the source at the second source position. In the image, there are two high pixel value areas, one is a part of the applicator wall around the first position and the other is the second source position. When the binarization threshold was 90, the system detected both areas as a source position. Some pixel values also exceeded 90 in TOP subtraction image in arrangement (1), as shown in Figure 7. However, these were not recognized as sources because the neighboring pixels did not exceed the value of 90.
Fig. 6
TOP subtraction image for detecting second source position in arrangement (1-c) and corresponding pixel values. Bold lines indicate applicator and the second dwell position. Dotted rectangle area indicates the first dwell position. There are some pixels with high positive pixel values. Along applicator wall around the first dwell position, two pixels over 90 exist next to each other
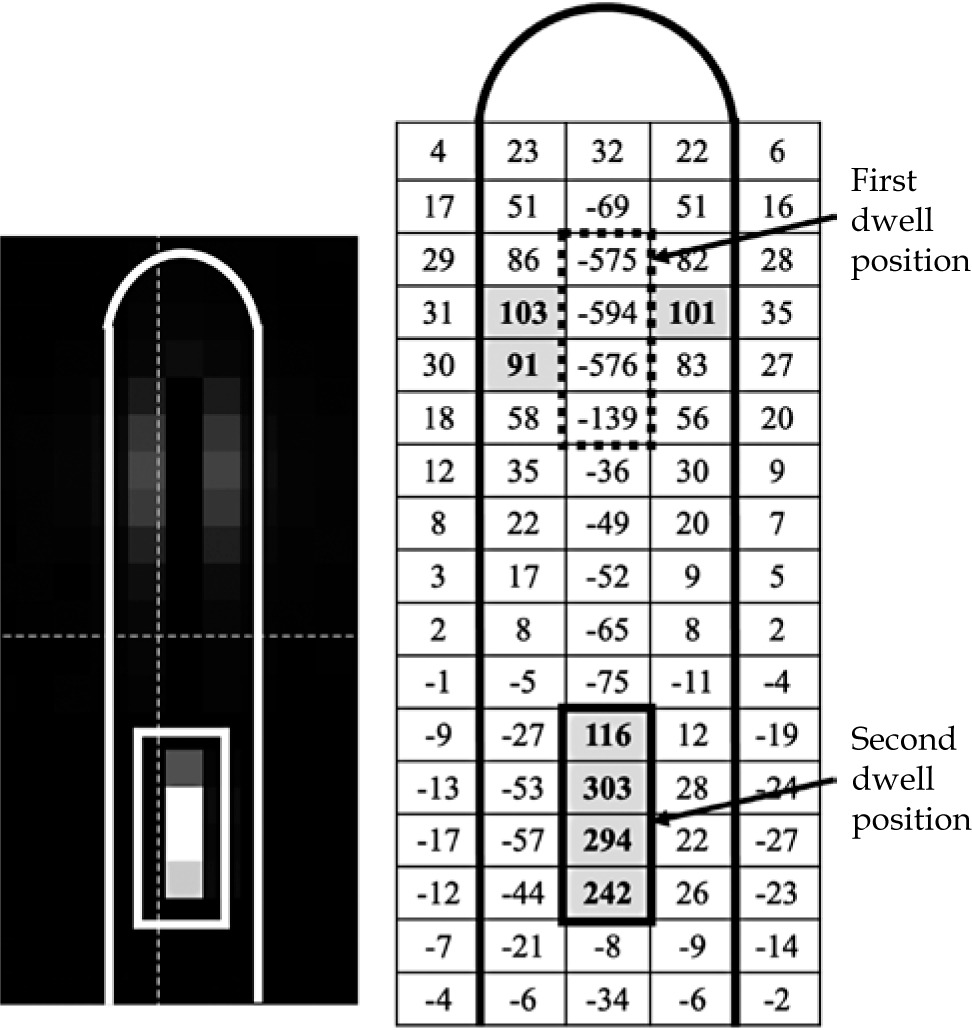
Fig. 7
TOP subtraction image for detecting second source position in arrangement (1) and corresponding pixel values. Only one pixel over 90 is present at around first dwell position

To properly analyze the undetectable CT scout image combinations, the threshold value was increased to 100 for TOP and LAT images for arrangements (1-b) and (1-c). With this change, the coordinates of source dwell position were detected. The analysis was successful when the threshold was increased to 100, because pixels with a value of over 100 only existed individually in the remaining portion of the applicator and were not identified as a source. In the effect of different imaging conditions section, we concluded that the imaging conditions do not result in a significant difference in the pixel values of the images; however, the images were undetectable for arrangements (1-b) and (1-c). Therefore, in the proposed system, small differences in pixel values affect source detection, and the results of this study are comparable to those reported in the existing literature. Watanabe et al. reported a difference between the simulated source position of the check cable and the source dwell position analyzed by a pinhole camera of 1.5 ±0.7 mm in longitudinal direction of the source [15]. In the report about an analysis of images acquired using the sources by an electronic portal imaging device for a quality control, the difference with an average of 0.26 mm and a maximum of 0.5 mm was shown between the observed source dwell position and that of the treatment plan [17]. However, these reports analyzed source dwell intervals. In contrast, in the current study, we analyzed the source dwell position in terms of absolute coordinates. The ICRP report of erroneous irradiation cases [5] reported some cases, in which the dwell position in the applicator was different from that in the treatment plan, because the length of the applicator was not entered accurately in the treatment plan. The system developed in this study may be able to detect these cases to be detected because it considers absolute coordinates. Studies on instances, which the analysis failed could lead to more accurate analysis that can be used in clinical practice.
Conclusions
Quality control is performed regularly at the facility where this study was conducted. Quality control using a proper tool has confirmed that the source can be stopped within ±1 mm of the target position. Comparison of coordinates of the source dwell position with the treatment plan using the in-house MATLAB program and CT scout images was possible with an accuracy of within ±1 mm. The source dwell position can be properly analyzed by acquiring images as close to the gantry center as possible to avoid applicator enlargement in the CT scout image. The system proposed in this study can be easily implemented using existing equipment for image-guided brachytherapy, and can analyze the absolute coordinates of the source dwell position. This can prevent inaccurate irradiation by analyzing whether HDR brachytherapy was performed properly. The system should be upgraded for more studies and for clinical use.