

Purpose
Interstitial and intracavitary brachytherapy treatment is most commonly planned, based on computed tomography (CT) scans of patients with implanted catheters or applicators. Most clinical treatment plans are still calculated according to the classical TG-43 formalism, using a line source and anisotropic dose function in pure water [1, 2]. However, dose information regarding Hounsfield unit (HU)-related electron density information from CT scans arouse growing interest in clinical routine.
Recent algorithms of commercial treatment planning systems (TPS), such as Oncentra®Brachy (Elekta AB, Sweden) or BrachyVision™ (Varian Medical Systems Inc., USA) [3-8] allow for more sophisticated calculations considering variable electron densities with individual radiation scattering and absorption functions. These so-called ‘model-based dose calculation algorithms’ (MBDCA) are designed for clinical use following the guidelines of TG-186 report [3]. MBDCA either use CT numbers (i.e., Hounsfield unit-based electron densities) or manually assigned electron densities for specific tissues or materials in irradiated regions of interest (ROI). Oncentra®Brachy TPS supports manual density allocation, with a limited number of pre-defined material types as well as CT-based electron density and mass density conversion, with a HU-related lookup table according to a method of Knöös, Nilsson, and Ahlgren [9] (which is only limited to a HU maximum of 3365 in the software). This electron density conversion formalism is intended for human tissue due to a limitation that it assumes only a minor content of high atomic number materials (high-Z). It is not designed for application with metal implants and other high-Z materials with HU ≥ 1000 [9], as most X-ray concentrated contrast agents.
However, iodinated contrast agents may be requested for treatment planning CT scans to enhance visibility of tumors and organs at risk. The presence of contrast agents will affect HU numbers and consequently HU-based TG-186 dose calculations.
Previous investigations have already shown the measurable dosimetric effects of radiographic contrast agents in balloon applicators and catheter heterogeneities [8, 11-16]. A 2 cm phantom layer filled with 367 mg/cm3 iodine concentration instead of water between iridium-192 (192Ir) high-dose-rate (HDR) source and parallel plate ion chamber, resulted in a relative dose reduction down to 90% and 91% in the measured dose and Monte Carlo calculations, respectively [13]. Model-based calculation instead of TG-43 formalism close to steel catheters inside a breast implant target volume significantly reduced the calculated volume, receiving 150% and 200% (V150% and V200%) [8]. Contrast agents may also be applied for intended dose sparing of organs at risk, up to 15% (bladder and rectum walls in vaginal balloon packing) [16].
In this study, we investigated the effect of contrast agent in the surrounding of the brachytherapy source. A phantom model was applied to evaluate the impact on the dose to specific ROI for interstitial implants, and HU-based dose calculation with significant concentrations of contrast agent was used for CT imaging. The effect of diluted contrast agent on electron densities and dose calculations for 192Ir brachytherapy source was compared with the measured dose in the presence of contrast agent. The effects were demonstrated in a water phantom model with an interior reservoir filled with diluted contrast agent.
Material and methods
Phantom and study design
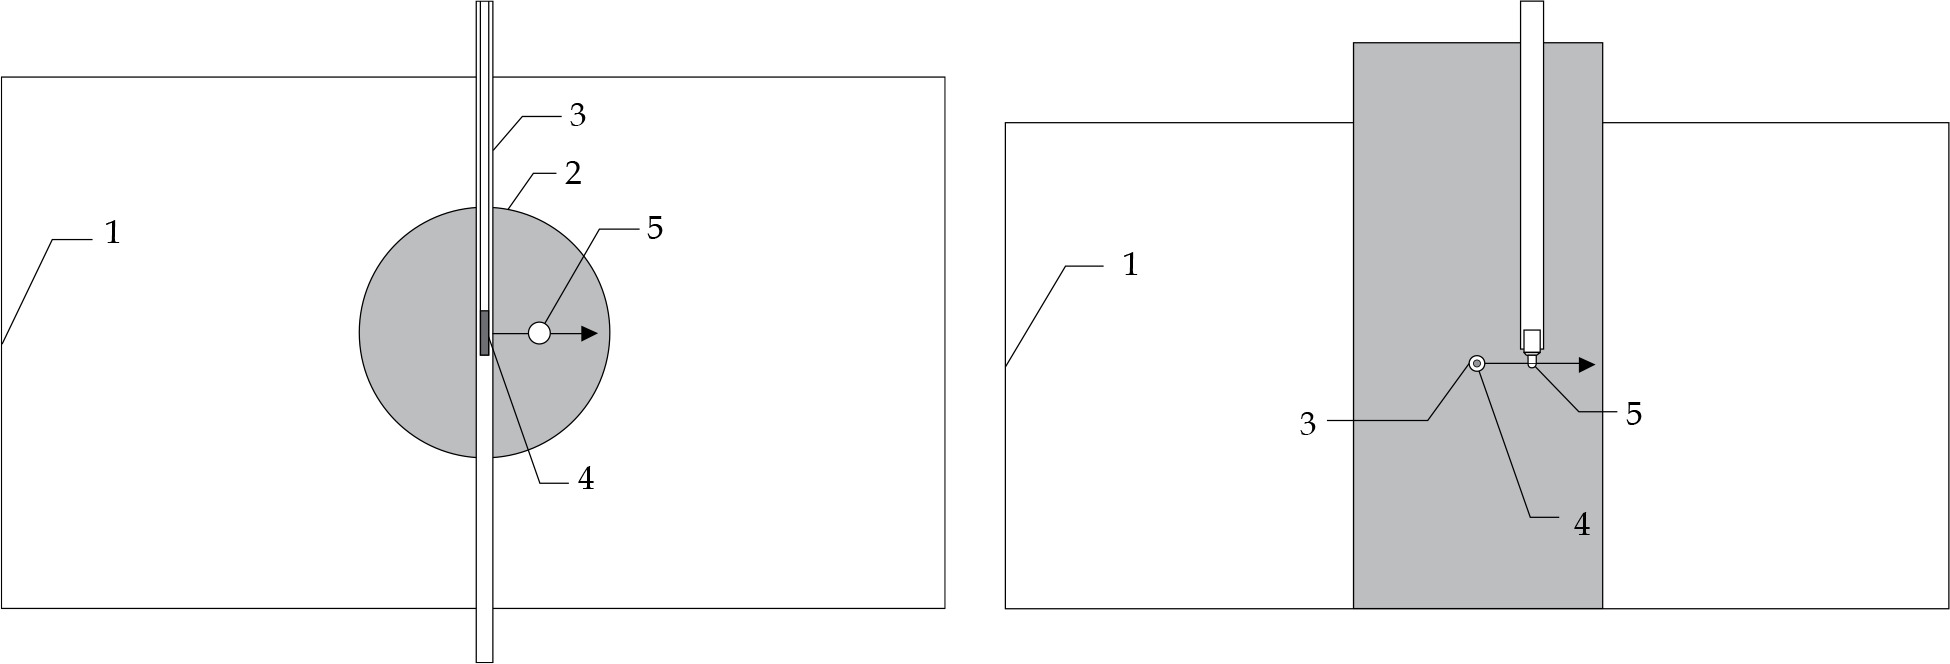
A phantom with a water-filled polyethylene box was used to examinate dose calculations and dose measurements based on CT scans (Figure 1). To simulate the presence of iodinated contrast agent inside a specific ROI, a reservoir was centrally placed in the phantom and filled with 700 cm3 diluted iodinated contrast agent. The commercial contrast agent Imeron® 350 (Bracco Imaging S.p.A, Italy) mainly consists of iomeprol with 350 mg iodine concentration per ml. Imeron® 350 was diluted with distilled water to obtain concentrations of 25, 50, 100, 200, and 300 mg iodine per ml. Pure water (0 mg/ml iodine concentration) was used as a reference. A 1.9 mm interstitial brachytherapy steel needle was centrally positioned in the reservoir, and a small PinPoint® ionization chamber (PTW, Freiburg, Germany) was used to measure relative dose.
Fig. 1
Schematic drawing of experimental setup (top and front views). Water filled 30 × 17 × 15 cm3 phantom geometry (1) with interior reservoir of 8 cm diameter (2), 200 mm long interstitial brachytherapy steel needle with 1.9 mm diameter (3), 192Ir source (4), and PinPoint® chamber PTW 31016 with 4.3 mm outer diameter (5) for dose measurements. The arrow indicates the scanning direction of the chamber
Computed tomography
Computed tomography images of the phantom were acquired with a Philips Brilliance Big Bore Oncology CT scanner at 120 kV, with a typical pelvis brachytherapy protocol using 204 mA tube current (250 mAs). Image reconstruction from helical data was done for 1.5 mm slice thickness for further use with Oncentra®Brachy TPS. Scans were performed with pure water and the diluted contrast agent up to 300 mg/ml iodine.
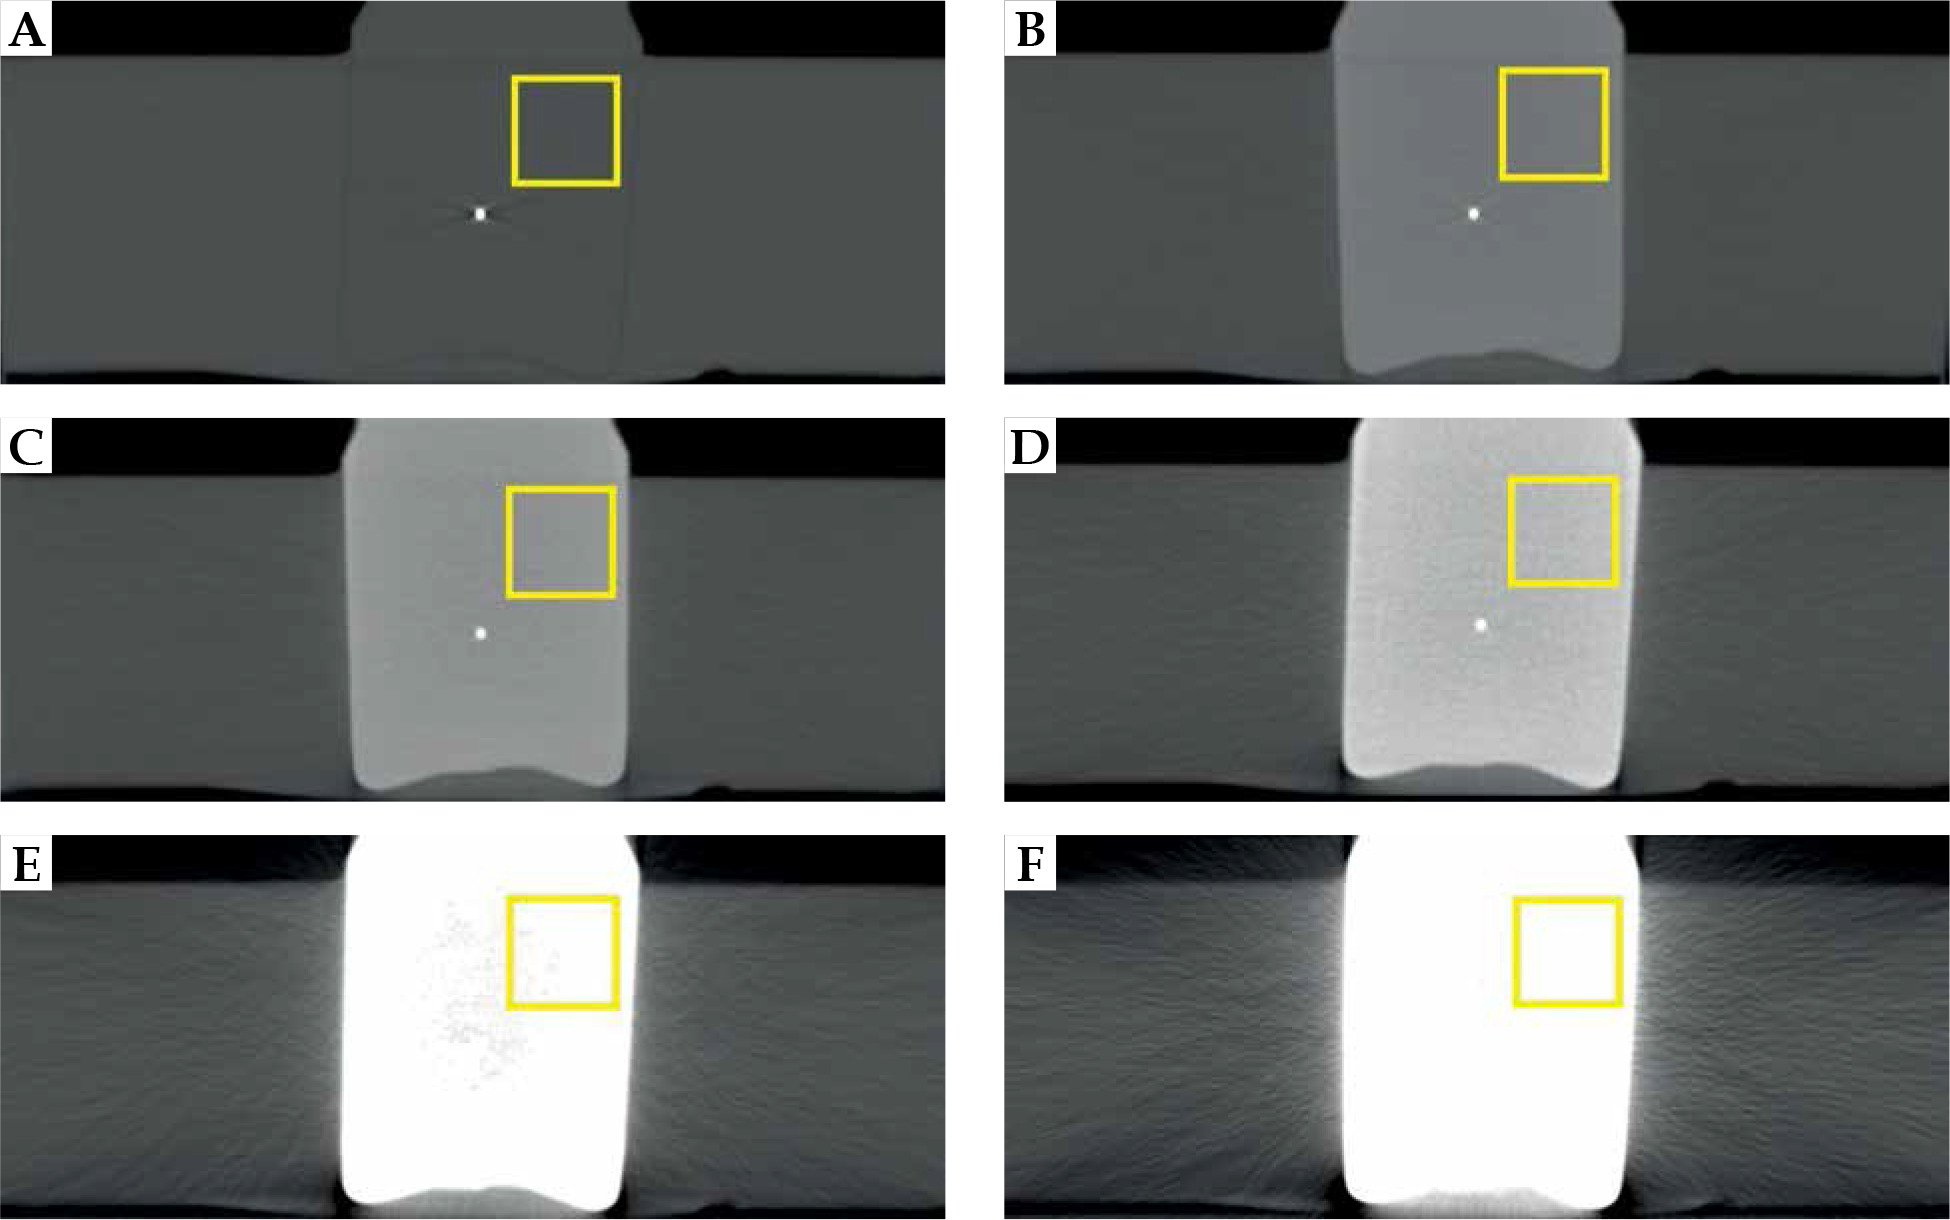
The CT numbers for the diluted contrast agent were obtained by evaluating rectangular ROIs of 1980 CT voxels (925 mm2) within the centrally located reconstructed slice of the phantom (Figure 2). Electron densities ρe(CT) were derived from the CT data according to a method of Knöss et al. [9].
Fig. 2
Central CT slices (axial view) for water (A) and different contrast agent concentrations inside the reservoir (B-F: 25, 50, 100, 200, and 300 mg/ml iodine concentration). Pixel values inside the highlighted squares were used to determine the averaged HU values
with A = 3.30 and B = 3.40 for –1000 < HU < 150, and A = 3.65 and B = 1.22 for 150 < HU < 1000. The relationship between HU and ρe used in the treatment planning system was based on this equation [10].
To compare the diluted contrast agent (contains iodine as high-Z chemical element) with human tissue (only low- and medium-Z chemical elements), four selected tissue equivalent materials from a Gammex 467 tissue characterization phantom (Sun Nuclear Corp., USA) were also scanned at 120 kV tube voltage: LV1-liver, CB2-resin with 30% CaCO3, CB2-resin with 50% CaCO3 and SB3 cortical bone.
Calculation of electron densities from chemical structure
In addition, a second approach was used to derive electron densities ρe(calc) from chemical composition of a compound. For each concentration of diluted contrast agent, the parts of iomeprol and water were calculated, including mass densities and relative fractions of chemical elements, as it was explained by Seco and Evans [17]:
with the mass density of the compound ρm, the atomic mass unit u, the atomic number to atomic weight ratios of the chemical elements
According to the manufacturer specification, Imeron® 350 with 350 mg/ml iodine concentration contains 71.44 g iomeprol per 100 cm3. For further calculations, it was assumed that the contrast agent dilutions only consist of iomeprol (C17H22I3N3O8, molar weight 777.087 u, mass density 2.27 g/cm3 [18]) and water (H2O, molar weight 18.015 u). Low concentrated other ingredients of Imeron®, like trometamol and hydrochloric acid, were neglected in calculations. Contrast agent and water were mixed in different ratios, as presented in Table 1, with their resulting mass densities ρm and weighted sums of <Z/A >.
Table 1
Volume ratios used to prepare different iodine concentrations, followed by their calculated mass densities (at 20°C) and mean Z/A values. Pure water and pure Imeron® 350 are also listed. Only iomeprol and water were considered in these calculations, and molecular interaction effects to the volume of the liquid mixture were neglected
Electron densities ρe(calc) of Gammex 467 tissue-like compounds were calculated based on their chemical compositions, published by Landry et al. [19].
Dose measurements and CT-based collapsed cone dose calculations
Dose calculations and dose measurements were performed in the same setup for one 192Ir single-source position in the center of the reservoir. Radial dose distribution was calculated for each dilution using corresponding CT data set. A set of dose points from 1.0 mm up to 30.0 mm distances perpendicular to the center of the source axis was defined for the calculations. For measurements, the set of dose points started from 3.1 mm due to geometrical limitation. Smaller distances were not possible, as the needle and the ion chamber were in touch at a distance of 3.1 mm between their central axes.
Dose measurements were carried out in the above-described phantom placed inside a tank of MP3 motorized water phantom system (PTW, Freiburg, Germany), similarly described by Rossi et al. [20]. Iridium-192 source of Elekta Flexitron® afterloader was positioned in the geometric center of the contrast agent reservoir according to Figure 1 for each measured set of points. A small PTW 31016 PinPoint® chamber was automatically moved by the motorized system perpendicular to Flexisource axis in 0.5 mm steps within the contrast agent reservoir. Dose-rate was integrated for 5 seconds per step using a TANDEM electrometer and MEPHYSTO mc2 software (PTW, Freiburg, Germany).
These axial dose point measurements were acquired for water and all contrast agent dilutions. The effect of source position fluctuations was minimized according to Schoenfeld et al. [21] by searching a maximum dose-rate position in Y and Z directions for every source cycle, with 0.1 mm step resolution.
The measured data of different contrast agent concentrations were always evaluated relative to the measured pure water data as reference. This enabled us to assess the data independently of calibration effects and correction factors. PinPoint® chamber, with a volume of 0.015 cm3 has an almost constant relative response (variation < 1%) with respect to expected radial variation of the mean photon energy [22]. Therefore, an impact to the measured dose related to additional beam hardening due to the presence of iodine, can be neglected. Thus, all known correction factors for volume averaging, position of the chamber’s effective point of measurement, and radiation quality [21] resulted in the value of 1.
Finally, the relative consideration of measured and calculated data eliminated the dominating geometrical 1/r2 dependency and small attenuation factor of the steel needle (~1.7%) in all evaluations and from the graphs in Figures 3 and 4.
Fig. 3
A) Results of dose point calculations in the TPS for pure water and diluted contrast agent in the reservoir. All collapsed cone ACE data was calculated HU-based with corresponding CT data starting at the applicator surface. B) Results of dose point measurements with PinPoint® ionization chamber, starting at the closest possible distance. All data are relatively normalized to the dose measured in pure water
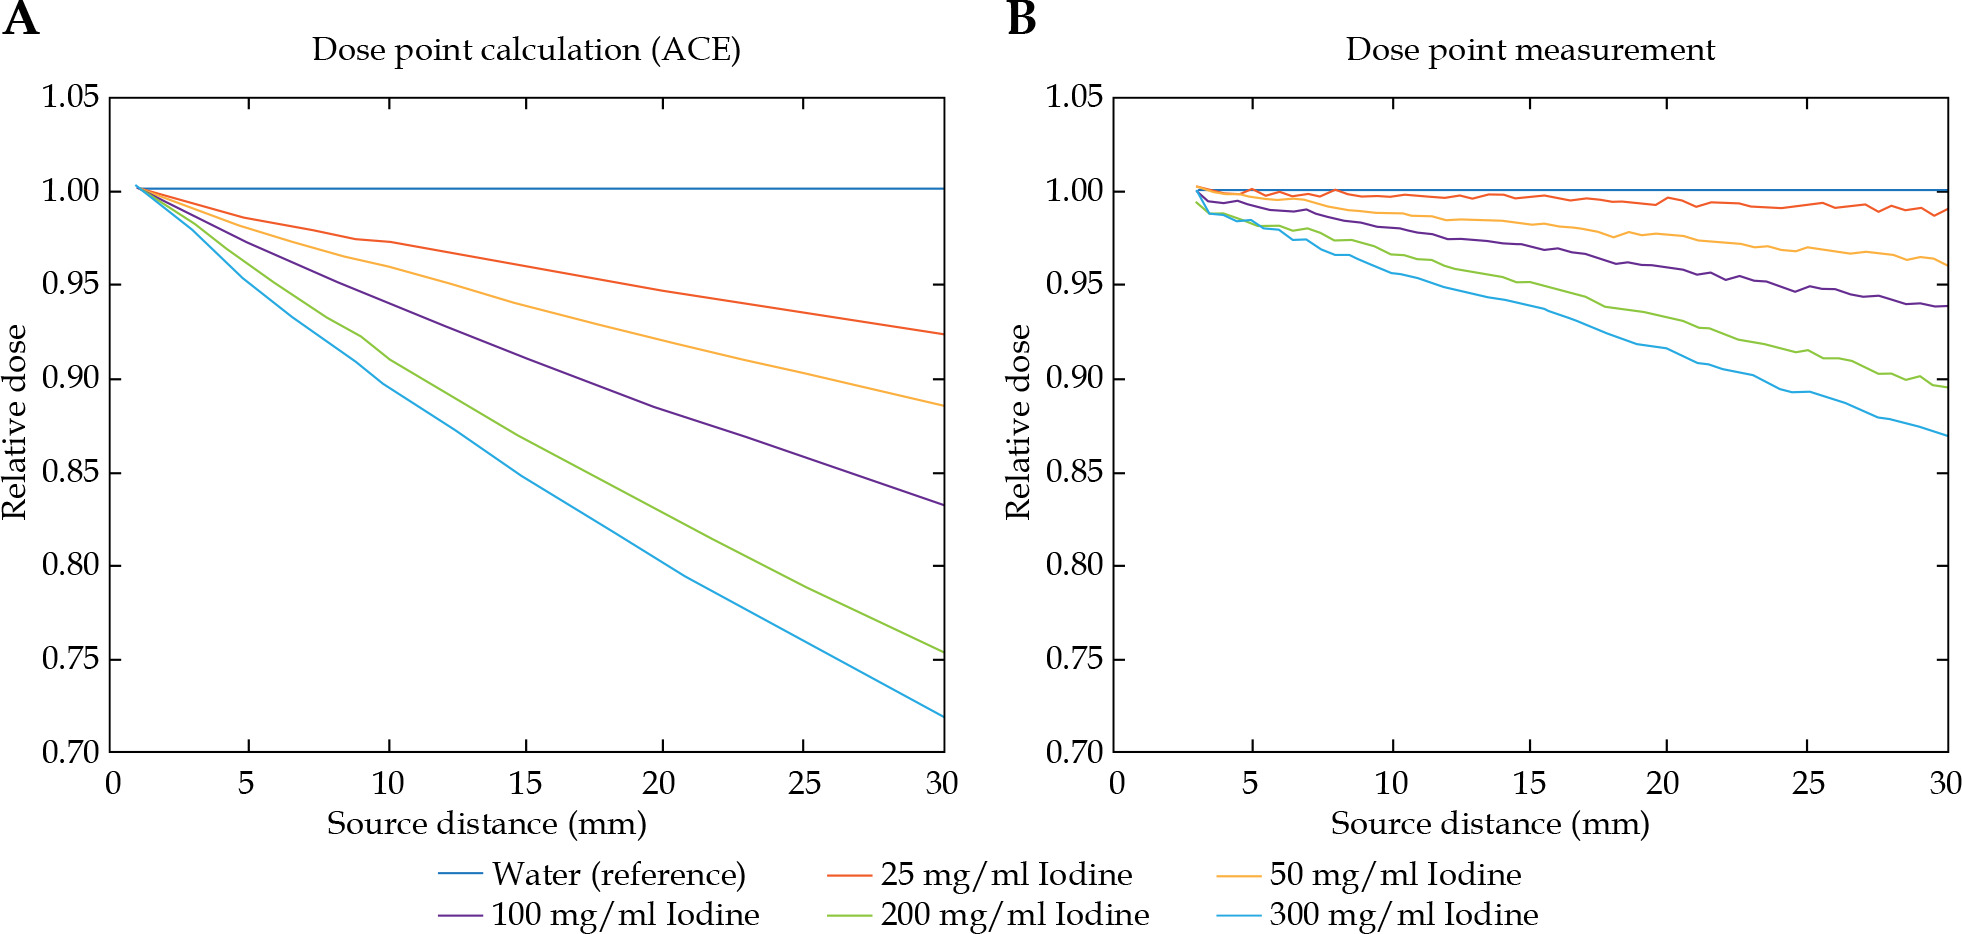
Fig. 4
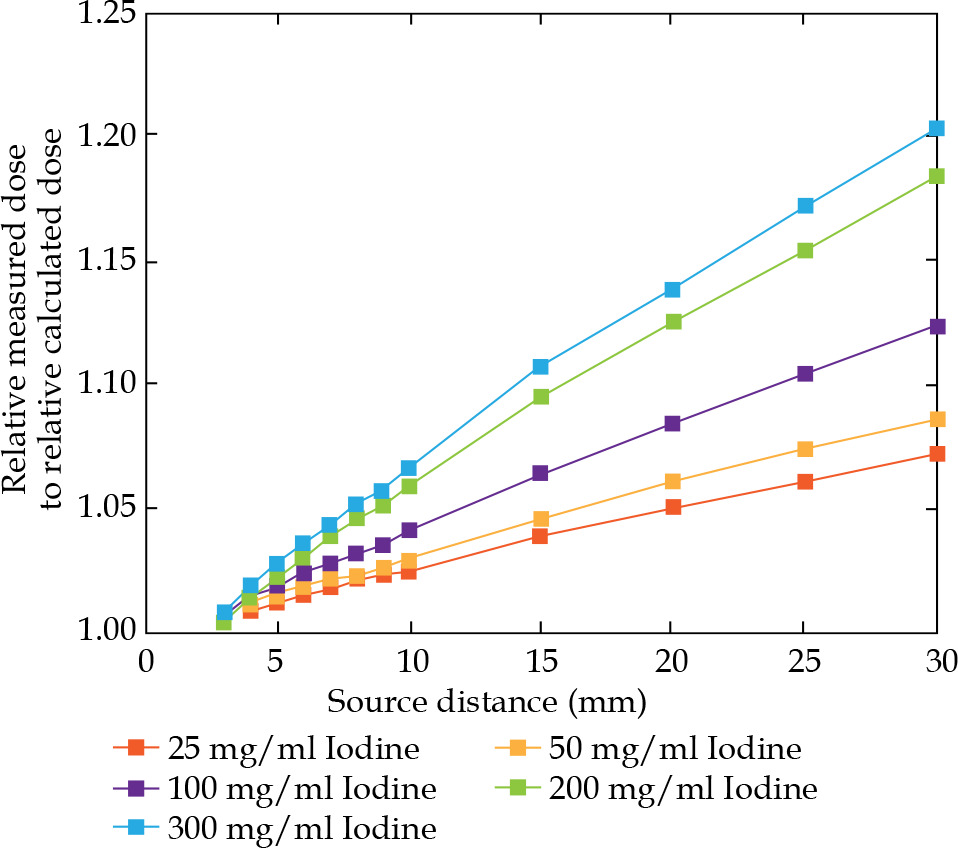
Ratio of measured normalized dose points to normalized calculated dose points depending on the source to detector/dose point distance
Dose calculations were performed with ACE collapsed cone algorithm of Oncentra®Brachy [4]. TPS was commissioned based on the published consensus data of Flexisource [23]. Mass density was HU dependently assigned to each voxel of 3D-CT data, with a lookup table that applies the method of Knöös et al. [9] as described in the CT section. Dose was calculated with high accuracy level of the software, applying 1 × 1 × 1 mm3 voxels in a 10 cm bounding box, and 2 × 2 × 2 mm3 voxels in a 20 cm bounding box, based on isocenter of the active dwell position [4, 5].
Results
Electron densities derived from CT and calculated from chemical structure
The electron densities derived from both approaches, i.e. obtained from CT and calculated from chemical compositions, are shown in Table 2 and illustrated in Figure 5.
Fig. 5
Relative electron density versus mass density dependence obtained from CT data and calculated from the chemical composition of water and contrast agent dilu- tions from 25 mg/ml to 300 mg/ml iodine concentrations. Corresponding data of tissue equivalent phantom materi- als are also included
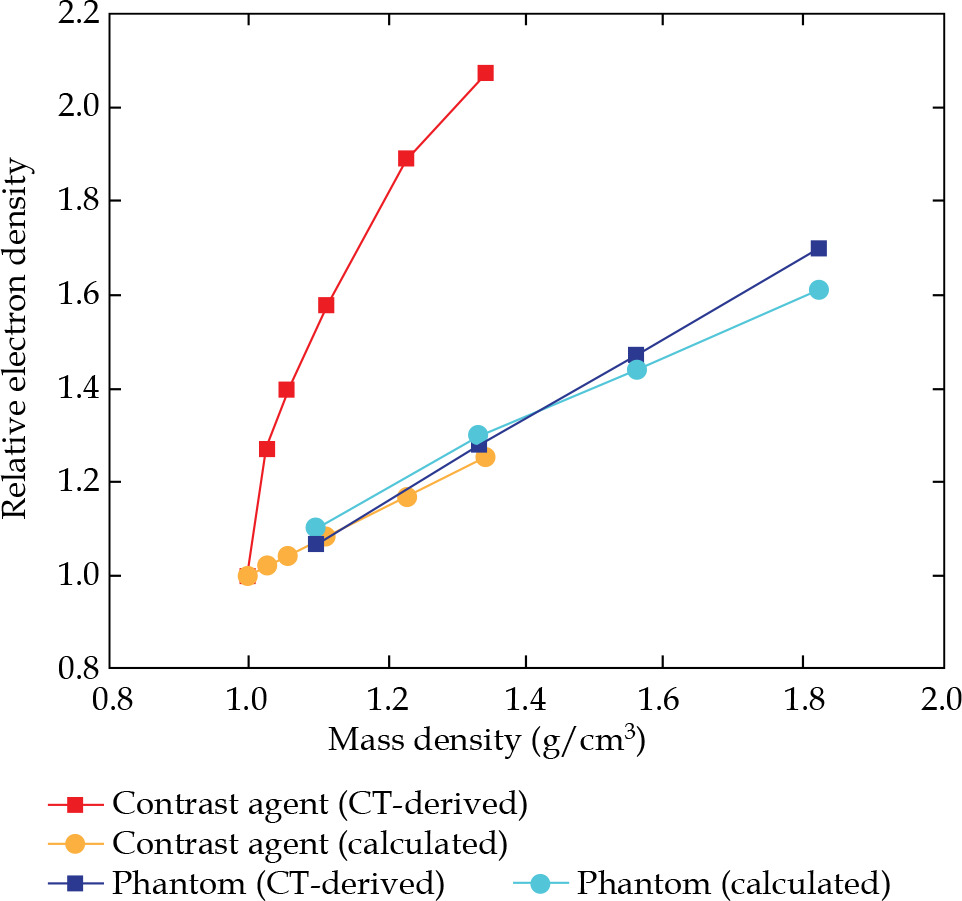
Table 2
Measured HU numbers (HUCT) and derived electron densities (ρe,CT), absolute and relative to water of the contrast agent dilutions and selected Gammex phantom materials. Standard deviations result from statistical evaluation of CT data. Mass densities (ρm) and calculated electron densities (ρe,calc) of each atomic composition, absolute, and relative to water
The measured mean HUCT numbers obtained from CT scans and their derived electron densities of the contrast agent dilutions and of the selected tissue equivalent materials, are also listed in Table 2. Reduced X-ray transmission related to higher iodine concentrations resulted in increasing standard deviation and saturation effects of the determined HU values. According to Equation 1, for both, diluted contrast agent and phantom materials, electron densities and electron densities relative to water were calculated. The mass densities and the calculated electron densities that were obtained from the chemical compositions were calculated by applying Equation 2.
Both approaches yielded different values for electron densities. The comparison of contrast agent dilutions showed significant higher values for the HU-based electron densities. With increasing iodine concentration, the relative deviation ranged from +24% for 25 mg/ml, up to +65% for 300 mg/ml. The CT derived relative electron densities obtained from Gammex phantom materials showed only moderate deviations from the calculated values. Their relative deviations ranged from –5.5% for the SB3 cortical bone, up to +3.1% for the LV1-liver equivalent phantom material.
Dose point evaluation
Figure 3A demonstrates dependency of the calculated dose as a function of the radial source distance and of the iodine concentration. Each set of dose points for the diluted contrast agent was calculated relative to the corresponding set of dose points in water. In consequence, the radial 1/r2 decay was cancelled out in the diagram.
Figure 3B shows dependency of the measured dose as a function of the radial source distance and the iodine concentration. Each set of dose points for the diluted contrast agent was normalized to the corresponding set of dose points in water.
For further comparison of data displayed in Figure 3, the derived ratio of measured normalized dose points to normalized calculated dose points is shown in Figure 4.
The discrepancy between dose calculation and dose measurement increased with the iodine concentration as well as with the size of contrast bulk. Penetrating small contrast agent bulks resulted in small dose errors, i.e. approximately 1% to 3% for 5 mm depth of penetration. The errors increased up to 7% for lower concentrations and up to 20% for higher concentrations of the contrast agent for the largest measured penetration depth of 30 mm.
Discussion
In clinical treatment planning, contrast agents are widely used to enhance visualization of soft tissue. This study showed that the presence of iodinated contrast agent affected model-based dose calculations if electron densities derived from HU numbers were used for treatment planning. The electron densities of all contrast agent dilutions obtained from CT data were significantly higher than the calculated values from the chemical composition. These deviations were related to CT X-ray spectrum that was dominated by lower energy photons. They mainly interact with matter through photo-electric effect, in particular with high-Z elements, due to prominent Z4 dependence. Due to the resulting high X-ray attenuation for iodine and other high-Z materials, the electron densities derived from CT data are overestimated. This also results in an overestimation of attenuation for 192Ir radiation quality. These facts are in accordance with the general Monte Carlo simulations of radiation energy-dependence of mass attenuation coefficients (µ/ρ), and the effective electron densities for different iodinated contrast agents published by Al-Buriahi and Tonguc [24].
Because of the overestimated densities derived from HU, dose calculation algorithm falsely assumes a too strong photon interaction with the matter. This results in a stronger calculated photon attenuation and mass energy absorption and consequently, manifests itself in a too steep depth dose gradient. The relative deviation between measurement and calculation increases with increasing iodine concentration and deeper penetration into the contrast bulk. Measured dose was always higher than the corresponding HU-based calculation.
From the clinical perspective, this leads in the case of substantially concentrated contrast agent in a risk structure, to an actual higher dose exposure than indicated in treatment plan, which can increase the risk of undesirable side effects. In the case of concentrated contrast agent in clinical target volume, the dose underestimation manifests itself in extended calculated dwell times, i.e., the treated dose will exceed the intended dose of all target volumes and risk structures.
When contrast agent is used to visualize tumor-related information, such as soft tissue and lymph nodes, the typical iodine concentration in CTV does not exceed 25 mg/ml (i.e., 450 HU) when planning CT data is acquired. In such cases, the deviation of ACE calculated and delivered dose will differ in less than 2% at ≤ 10 mm source distance, and might be of minor importance for a clinical outcome.
The error in dose calculation should be considered relevant from 450 HU. In such rare situations, a manual assignment of associated tissue type (i.e., without considering contrast agent) or even of water is more appropriate. For one thing, the actually measured differences according to Figure 3B were always less prominent than the HU-based calculated differences, as shown in Figure 3A. Furthermore, the measured dose and the dose to water in Figure 3B differ significantly less than the corresponding HU-based calculated dose and the measured dose, as presented in Figure 4. On the other hand, the relevant contrast agent influence in most clinical situations becomes even smaller due to physiologically-induced decrease in concentration with advancing time between CT acquisition and radiation treatment.
Conclusions
The present work demonstrates that the standard HU to electron density , as it was explained by Seco and Evans [17]: conversion formalism of Oncentra®Brachy ACE algorithm overestimates the electron densities of diluted iodinated contrast agent. In presence of contrast agent, the delivered dose will be higher than the corresponding calculated dose. Under such circumstances, the user should keep in mind that HU-based dose calculations will result in erroneous dose information. A discrepancy of 2% to 7% per each 10 mm penetration depth depending on the contrast agent concentration from 25 mg/ml (450 HU) to 300 mg/ml (2600 HU) can be estimated.