

Purpose
Prostate cancer (PC) is the second most commonly occurring cancer in men, with 1.3 million new cases and 360,000 deaths from PC worldwide in 2018 [1].
For localized PC, the curative treatment strategies available are radical prostatectomy or radiation therapy. Radiation therapy can be delivered by different modalities, such as external beam radiation therapy (EBRT), low-dose-rate brachytherapy (LDR-BT, permanently implanted radioactive seeds), and high-dose-rate brachytherapy (HDR-BT). For low-risk and favorable intermediate-risk PC, brachytherapy as monotherapy is a common treatment approach. Combining EBRT with brachytherapy as a boost is indicated for intermediate- and high-risk PC patients [2].
Apart from considering the clinical characteristics of PC before choosing the most suitable curative treatment approach, current guidelines suggest shared decision-making based on patient’s preferences, life expectancy, prior symptoms, and expected treatment-related adverse effects, mainly urinary or rectal toxicity and erectile dysfunction [3-5].
Several studies have been performed to compare disease control rate between different treatment strategies, showing that radiotherapy and surgery have comparable efficacy but different toxicity profiles [3-5]. Studies comparing various radiotherapy treatment modalities collectively imply that combining brachytherapy with EBRT seems to be superior to EBRT alone [6, 7]. In fact, a randomized controlled study analyzed 216 patients with low-, intermediate-, and high-risk PC, and showed a 31% reduction of recurrence-risk with HDR-BT combined with EBRT compared to treatment with EBRT alone [8]. Despite the potential benefit of HDR-BT and EBRT combination therapy, a decreasing trend in utilization of this treatment approach has been observed in intermediate- and high-risk PC patients [9, 10]. The proposed reasons for this decline include decreased training in brachytherapy, limited capacities of radiation facilities in delivering brachytherapy, and invasiveness of the treatment [9, 10]. Furthermore, as some studies have shown, an increased risk of urinary toxicity when using dose escalation with combination therapy and concerns for adverse effects could be another reason for the decreasing trend [10].
To facilitate physicians in predicting toxicity risks and therefore in planning, the most favorable treatment for PC patients with predictive models that estimate the probability of a certain toxicity outcome have been developed [11-15]. Interestingly, most of these models predict outcomes of interest following EBRT, and scarcely any predicting toxicity after treatment with combined HDR-BT and EBRT can be found [16, 17].
Using a retrospective study design from a prospectively collected database, and including consecutive PC patients treated with combination of EBRT and HDR-BT, we aimed to evaluate the toxicity rates of this treatment approach. Considering the scarce evidence on the predictive role of different parameters, we also aimed to identify treatment-, patient-, and tumor-related risk factors for developing acute and late urinary, rectal and erectile toxicities, and if possible, create predictive models for acute and late toxicities of grade ≥ 2. Such models will potentially help physicians to be more confident in expected toxicities and increase their use of combination therapy.
Material and methods
Study cohort
A retrospective cohort study was conducted, including consecutive patients with histologically confirmed intermediate- and high-risk PC, treated with combination therapy of EBRT and HDR-BT with curative intention and identical total doses in the Department of Oncology at Örebro University Hospital (ÖUH) between 2008 and 2018.
The treatment consisted of EBRT with a total dose of 42 Gy in 14 fractions (3 Gy/fraction 3 times a week), starting 2 weeks after a HDR-BT boost of 14.5 Gy in 1 fraction. Total equal dose with 2 Gy per fraction (EQD2) for this schedule was 101 Gy (α/β = 3) referring to PC cells and late reacting tissue, and 75 Gy (α/β = 10) for acute reacting tissue. Fiducials were applied during the brachytherapy treatment. EBRT was given with 3 dimensional conformal EBRT from 2008-2013 (3D-CRT), and volumetric modulated arc therapy (VMAT) was applied later on. Clinical target volume (CTV) was defined as prostate capsule seen on computer tomography for EBRT and on ultrasound (US) for HDR-BT. Planning target volume (PTV) was defined as CTV +7 mm for EBRT, and PTV = CTV for HDR-BT. Risk organs (urethra and rectum) were delineated 5 mm beyond CTV for HDR-BT. Dose constraints and how HDR-BT is applied are published elsewhere [18].
Patients were derived from a prospectively collected database of 2,517 PC patients treated with radiation therapy with curative intention.
We excluded patients with lymph node metastasis or distant metastatic disease at diagnosis, patients treated with EBRT only or BT only, patients who received combined EBRT and HDR-BT with other doses than those mentioned above, and patients who did not complete the planned course of radiotherapy.
Using the above-mentioned inclusion and exclusion criteria, 359 patients were eligible and included in the study cohort.
Data collection
Data extracted from the database included tumor characteristics, treatment-related parameters, and toxicity at baseline and during follow-up. Dosimetric data retrieved from brachytherapy dose planning system were included in the database. However, no dosimetric parameters from EBRT were included.
Outcomes of interest, definitions, and follow-up
Patients were followed-up according to the institution’s clinical practice, with a clinical visit at the end of radiotherapy, telephone follow-up with an oncology nurse 3 weeks after the end of radiotherapy, and a standardized questionnaire sent by mail every 6 months after radiotherapy during the first 3 years and then annually until 10 years after the treatment. At all follow-up occasions, a physician or trained oncology nurse graded and recorded patient’s highest grade of symptoms according to the international RTOG toxicity criteria [19]:
Lower urinary tract symptoms (LUTS): No (G0): 0-1 nocturia; Mild (G1): 2-3 nocturia, single dysuria/urgency; Moderate (G2): 3-4 nocturia, sporadic dysuria/urgency, need of medication; Severe (G3): > 4 nocturia, severe urgency, need of temporary catheterization; Permanent (G4): need of permanent catheter.
Rectal symptoms (RS): Normal (G0): 1-2 daily defecations; Mild (G1): 3-4 daily defecations, single urgency or bloody stools; Moderate (G2): > 4 daily defecations, frequent urgency or bloody stools, need of medication; Severe (G3): continuous problems and/or need of surgical treatment.
Erectile dysfunction (ED): Normal erectile function (G0); Moderate (G1): weak or not consisting of erection; Complete (G2): total loss of erectile function.
To differentiate between toxicity due to treatment and pre-existing symptoms, symptoms after the treatment were classified as toxicity if the severity (grade) was increased compared to baseline.
We, therefore, define toxicities as the occurrence of symptoms in patients without pre-existing symptoms at the same level. Toxicity was defined as acute when it occurred within 3 weeks after the end of treatment, and late if it occurred later (at least 6 months after the end of treatment since there was no formal follow-up between 3 weeks and 6 months).
Patients suffering from pre-existing symptoms classified with the highest grade (not considered at risk) were excluded from the analyses of that particular toxicity.
Statistical analyses
Cumulative incidences of toxicities grade ≥ 2 were estimated by the complement of Kaplan-Meier estimator (Kaplan-Meier with reversed y-axis). Patients lost to follow-up were considered as mainly non-informative censoring, meaning they had the same risk to develop toxicities as patients still under follow-up. Death (without prior toxicity) during follow-up was a competing event, and ignoring this might lead to a slight overestimation of a cumulative incidence, but it was considered negligible assuming that less than 10% of patients died during follow-up.
Potential predictors (which can be seen in Table 1) for toxicities grade ≥ 2 were evaluated through bivariate analyses performed using chi-square-tests for dichotomous variables, Cochran-Armitage tests for ordinal variables, and logistic regressions for continuous variables. For urinary and rectal toxicities, independent analysis were performed for acute and late toxicities. P-values < 0.05 were considered significant, indicating a potential correlation of interest. However, a large number of comparisons makes it inappropriate to draw conclusions only from p-values at that level.
Table 1
Baseline characteristics and dosimetric parameters. Last columns reflect relationships between parameters and toxicities grade ≥ 2. P-values < 0.10 are written out and p-values > 0.10 are replaced by N.S. for “non-significant”. Hyphens means that the relation was not tested due to low clinical relevance. P-values marked with an asterisk reflect a negative relationship
[i] PTV – planning target volume; D90 – dose received by 90% of prostate volume; V100 and V200 – volume of prostate receiving 100% and 200% of total dose (14.5 Gy); VolU, VolRw, and VolRm – total volume of the urethra, rectal wall, and rectal mucosa within the drawn dose-planning ultrasound image; DmaxU, DmaxRw, and DmaxRm – maximum dose received by the urethra, rectal wall and rectal mucosa; D10U, D10Rw, and D10Rm – dose received by 10% of the most radiation-exposed urethral, rectal wall, and rectal mucosal volume; D0.1ccRm, D1.0ccRm, and D2.0ccRm – dose received by 0.1, 1.0, and 2.0 cm3 of the most radiation-exposed rectal mucosa; EBRT – external beam radiotherapy; ADT – androgen deprivation therapy
Finally, we made multivariable analyses to evaluate more complex relationships. This could potentially result in prognostic models for predicting toxicities grade ≥ 2. Before the multivariable analyses, all variables were controlled for collinearity. If the correlation coefficient between two variables exceeded 0.9, one of them was removed. The multivariable analyses performed by multiple logistic regression, included all variables from the bivariate analyses (except from those removed due to collinearity). In addition, patients with incomplete data were removed from the multivariable analyses. In the bivariate analyses, acute and late rectal toxicities were analyzed separately, but the cases were too few for separate multiple logistic regressions; therefore, all rectal toxicities were analyzed together in this part.
Models were optimized by a backward stepwise procedure, minimizing AIC (Akaike information criteria). The resulting models were further trimmed by removing insignificant predictors. All predictors with p-values exceeding 0.05 were removed if the reduced model was not significantly (p < 0.05) weaker according to a likelihood ratio test. The procedure was repeated until no predictor could be removed without significantly weaken the model. All analyses were performed in R version 3.6.1.
Results
Study cohort
In total, 359 patients were included in the study cohort. The median age was 70 (range, 51-81) years. The median follow-up was 45 (range, 2-132) months. Regarding androgen deprivation therapy (ADT), 248 patients (69%) were treated with bicalutamide monotherapy, 27 patients (8%) with combined ADT, and 15 patients (4%) with GnRH agonist only.
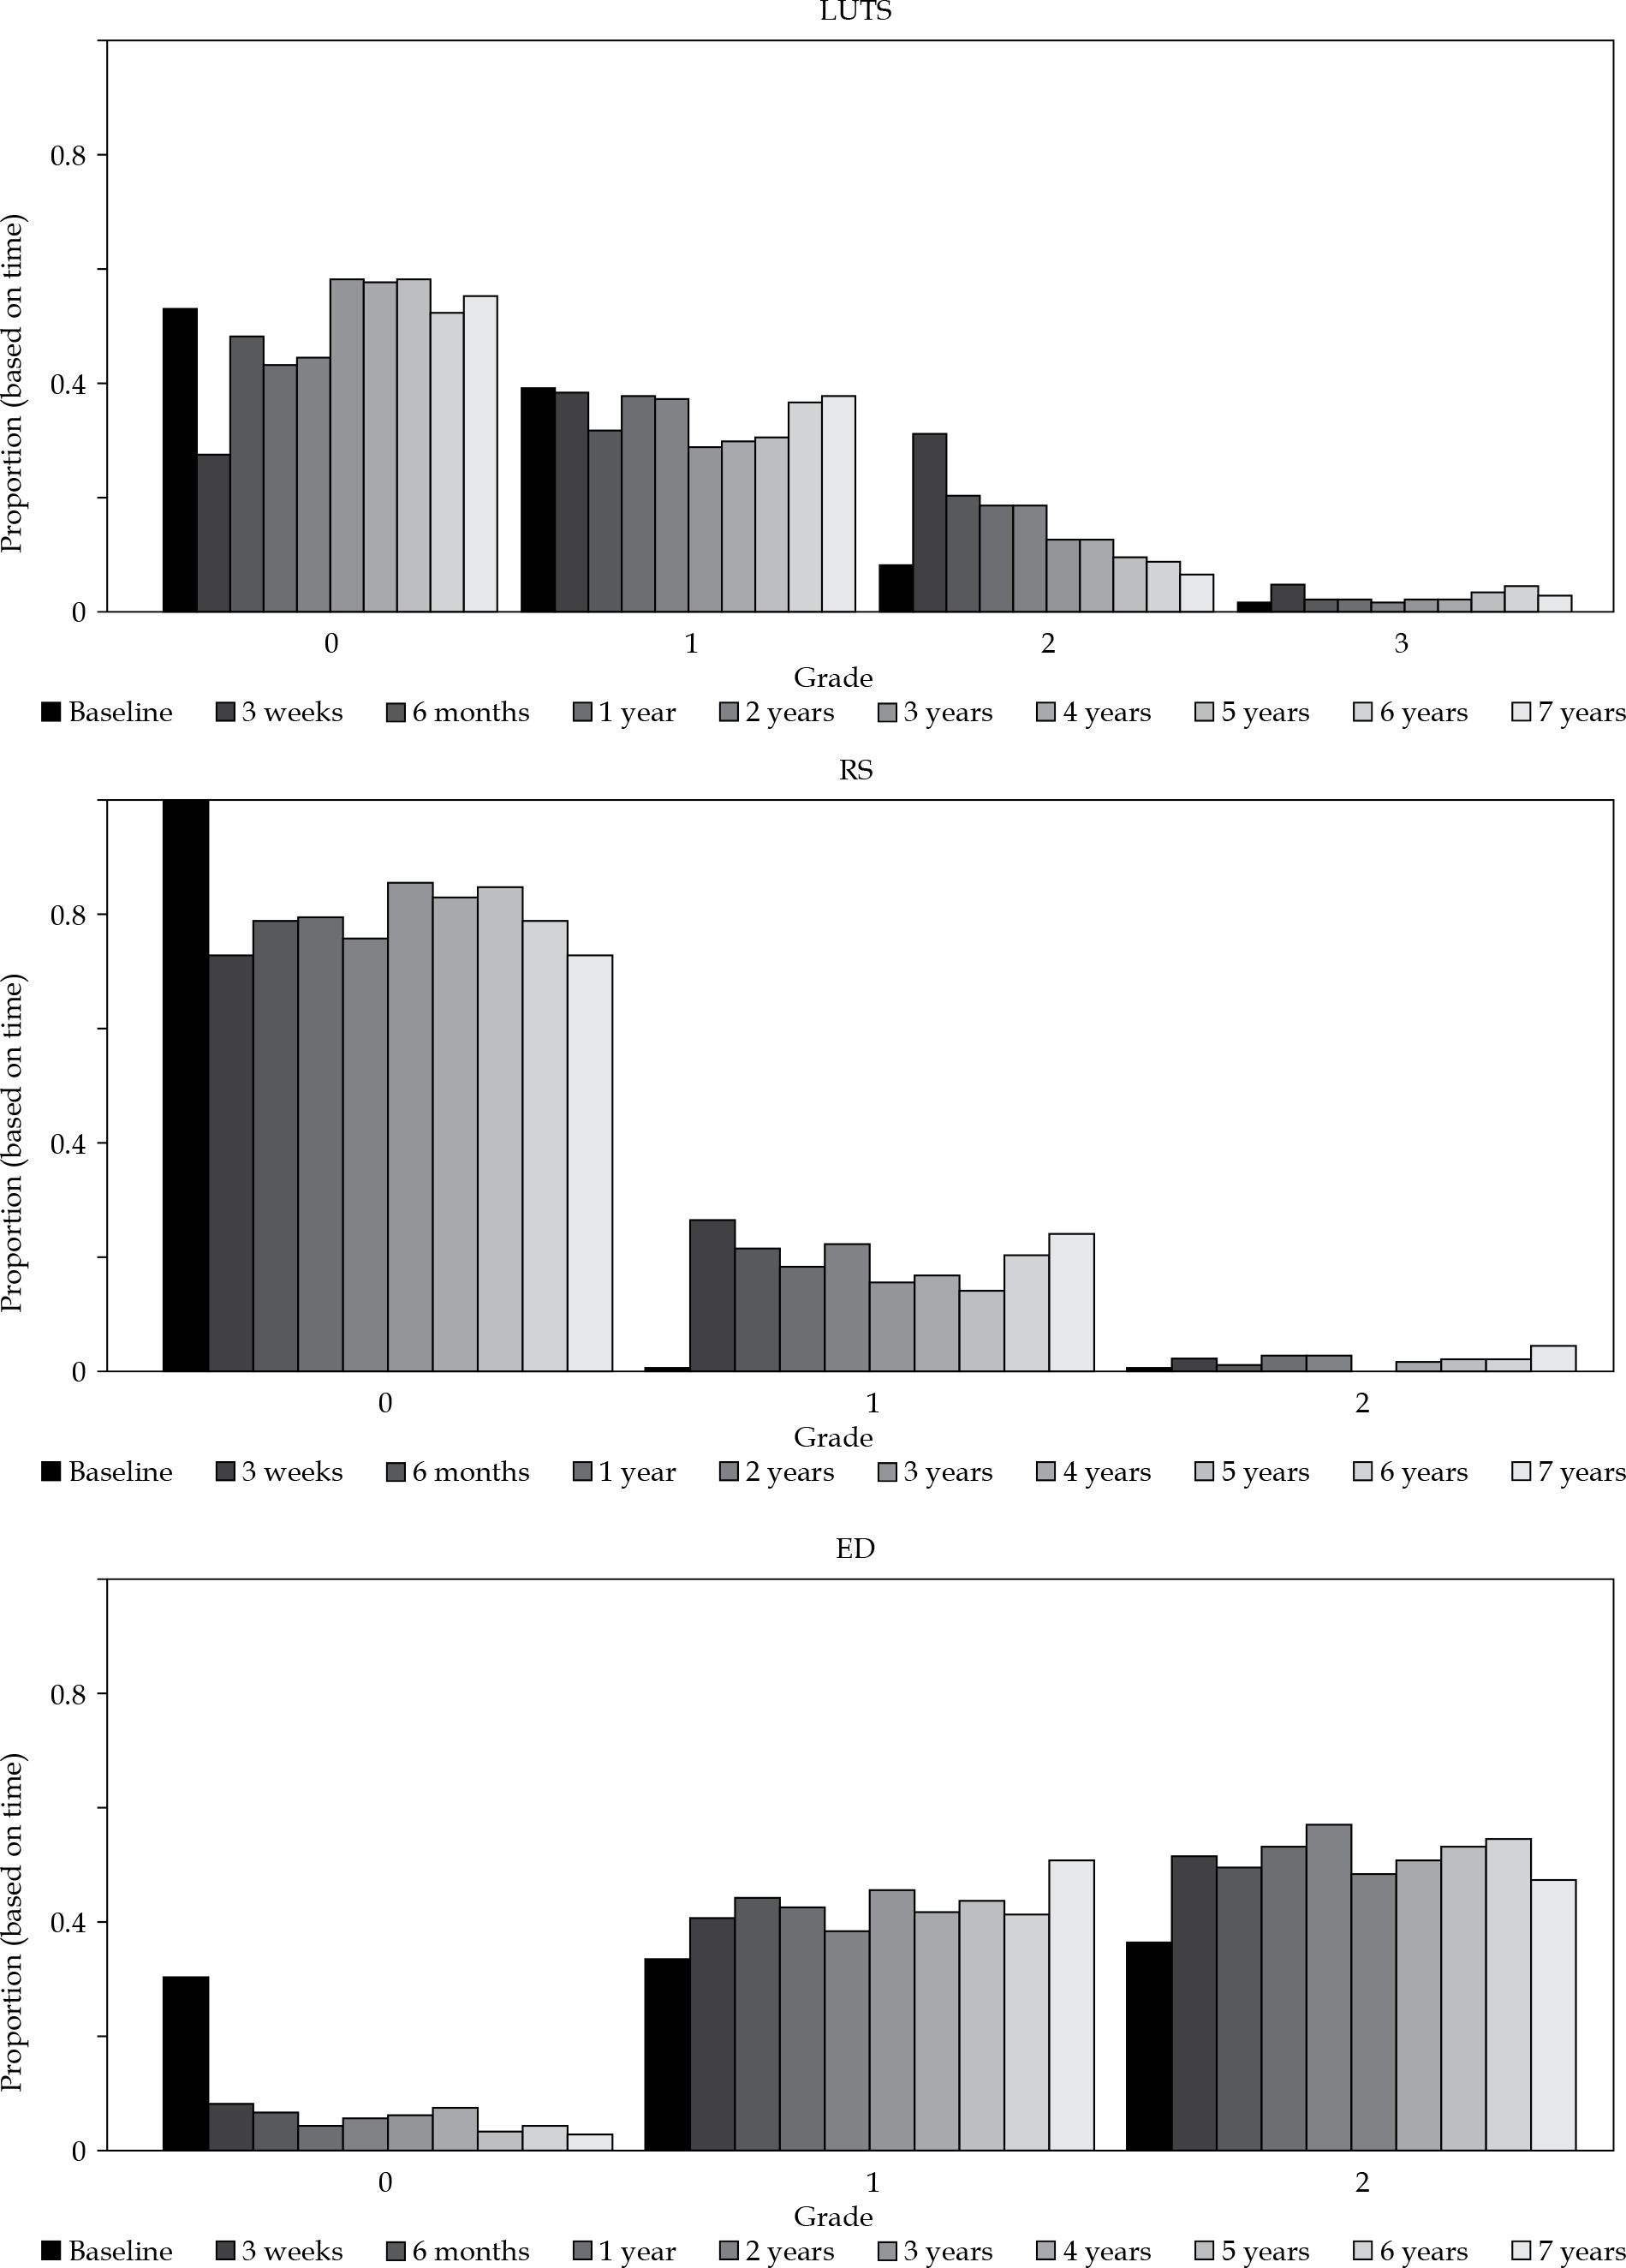
The crude occurrence rates of symptom scoring for LUTS, RS, and ED at baseline and during follow-up of the cohort are presented in Figure 1. Since we lacked information about baseline RS for all the patients, analyses were based on an assumption that baseline status was G0 for all the patients.
Fig. 1
Baseline and follow-up status for lower urinary tract symptoms (LUTS), rectal symptoms and erectile dysfunction. Proportion of the patients with data, n = 357 (baseline), 356 (3 weeks), 328 (6 months), 306 (1 year), 262 (2 years), 245 (3 years), 145 (4 years), 133 (5 years), 75 (6 years), 51 (7 years)
Three patients were found to have distant- and five lymph node metastases directly after the end of radiotherapy. These patients remained in the analyses of toxicity rates since they received the same treatment as the others. In addition, seven patients had undergone transurethral resection of the prostate (TUR-P) prior to radiotherapy, which could theoretically affect the risk for LUTS. Since the fraction of patients with LUTS grade ≥ 2 was not significantly different in this group compared to the others, we decided not to exclude this patient group from the analyses.
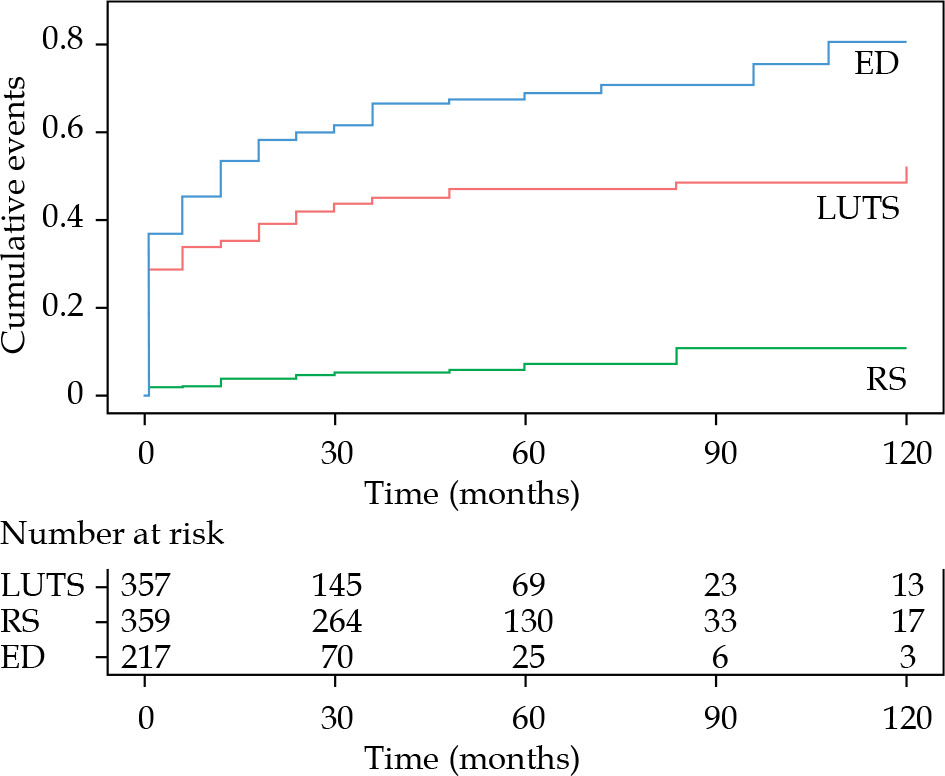
Cumulative incidence of toxicities
The estimated cumulative incidences of toxicities grade ≥ 2 are presented in Figure 2. The toxicity with the highest cumulative incidence was ED, followed by LUTS, whereas the incidence of RS remained low throughout the follow-up.
Urinary toxicity rates over time
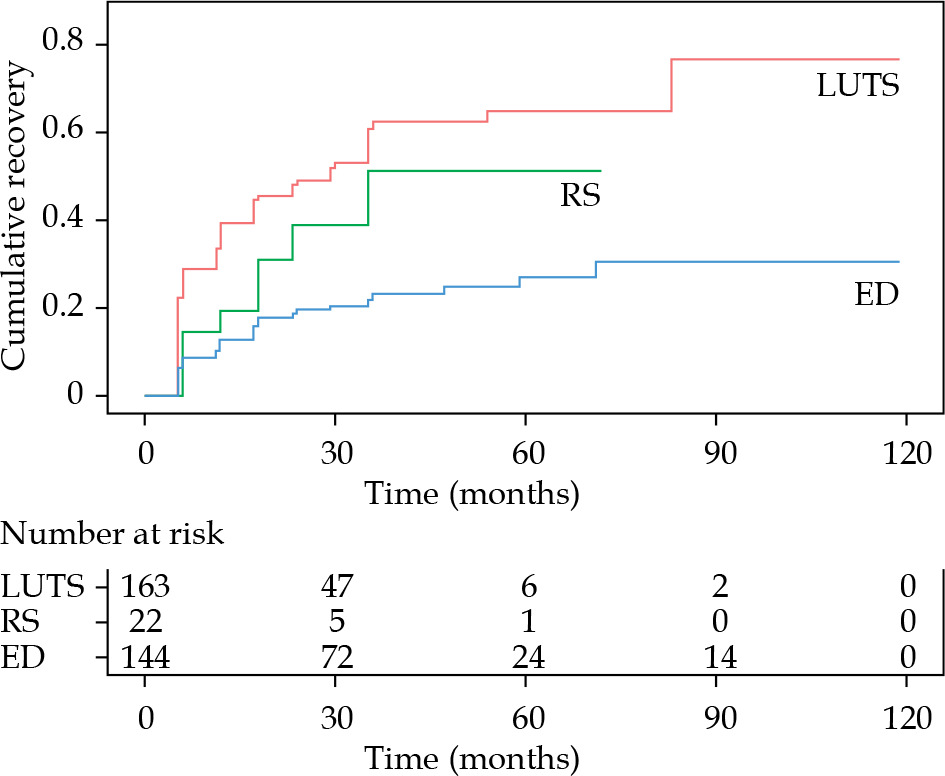
Of 326 patients without pre-existing LUTS grade ≥ 2, 154 (47%) presented with grade ≥ 2 LUTS at any time during follow-up, 102 with acute, and 52 with late toxicities. The recovery rate of acute LUTS (based on information from the patients last contact during follow-up) was 73% (35% to grade 0; 38% to grade 1), whereas the recovery rate of late LUTS was 60% (27% to grade 0; 33% to grade 1). In Figure 3, Kaplan-Meier analysis of LUTS recovery is presented. At their last follow-up, 40 (12%) patients (of the 326 included) had a remaining grade 2 LUTS and 7 (2%) had grade 3.
Fig. 3
Cumulative recovery (complement of the Ka- plan-Meier estimator). Every time a toxicity grade ≥ 2 is improved to a lower toxicity grade it is counted as an event. Time is counted from the point where the toxicity first occurred
Regarding the 31 patients with pre-existing grade ≥ 2 LUTS, 9 (29%) were worsened at any time after the treatment. At their last follow-up, 17 patients (55%) were improved compared to baseline, and 4 (13%) were worsened. No grade 4 LUTS was observed at any time. Details about LUTS based on baseline status are presented in Table 2.
Table 2
LUTS based on baseline status. Absolute numbers with percentages in parenthesis. Patients with shorter follow-up than 6 months were excluded from the last follow-up calculations. For example, it could be seen that among patients without baseline LUTS, 44% had grade 1 LUTS after 3 weeks, and 9% had grade 2 LUTS at their last follow-up
Rectal toxicity rates over time
Of the 359 patients, 22 (6%) presented with grade 2 RS at any time during follow-up, 6 with acute, and 16 with late toxicities. Of these 22 patients, 9 recovered to grade 1 and 9 recovered completely. 176 patients (49%) presented with grade 1 RS at any time during follow-up, of whom 83 had acute and 93 had late toxicities. Of these 176 patients, 112 (64%) recovered. No grade 3 or 4 RS was observed. Figure 3 shows Kaplan-Meier analysis of RS recovery.
Erectile dysfunction rates over time
Of 103 patients without pre-existing ED, all the patients had grade ≥ 1 dysfunction at any time during follow-up, 84 with acute, and 19 with late toxicities. At their last follow-up, 7 patients (7%) recovered to grade 0, whereas 60 cases (58%) experienced grade 1 and 36 (35%) grade 2 ED. Of 114 patients with pre-existing grade 1 ED, 81 (71%) had grade 2 dysfunction at any time during follow-up, 49 with acute, and 32 with late toxicities. Of the 81 patients with grade 2 ED, 28 (35%) recovered to grade 1 and 52 cases (46%) had remaining grade 2 ED at their last follow-up. Of 125 patients with pre-existing grade 2 ED, 91 (73%) had remaining grade 2 dysfunction at their last follow-up, whereas 34 (27%) were improved. Figure 3 demonstrates Kaplan-Meier analysis of ED recovery.
Multivariable analyses
The correlation coefficient between the independent variables exceeded 0.9 in a few cases (indicating a strong collinearity). It was 0.99 between PTV and V100, 0.96 between DmaxRm and D0.1ccRm, 0.94 between D0.1ccRm and D1.0ccRm, and 0.93 between D1.0ccRm and D2.0ccRm. It was decided to remove PTV, D0.1ccRm, and D1.0ccRm from the multivariable analyses.
The trimmed model for predicting acute LUTS grade ≥ 2 was based on 304 patients and included just age (p = 0.01, odds ratio [OR] = 1.07, 95% confidence interval [CI]: 1.02-1.13%).
The trimmed model for predicting late LUTS grade ≥ 2 was based on 298 patients and included just V100 (p = 0.007, OR = 1.03, 95% CI: 1.01-1.05%).
The trimmed model for predicting RS grade ≥ 2 was based on 259 patients, and included V100 (p = 0.0009, OR = 1.10, 95% CI: 1.04-1.16%), the number of positive biopsies (p = 0.018, OR = 0.71, 95% CI: 0.53-0.94%), and D2.0ccRm (p = 0.03, OR = 0.90, 95% CI: 0.81-0.99%).
The trimmed model for predicting ED grade 2 was based on 187 patients, and included androgen deprivation therapy (p = 0.0003, OR = 4.07, 95% CI: 1.89-8.77%) and V200 (p = 0.009, OR = 1.77, 95% CI: 1.15-2.71%).
Discussion
In our study cohort of the 359 PC patients treated with HDR-BT combined with EBRT, we were unable to develop predictive models that could be used in clinical practice to predict treatment-related toxicities. We observed, however that both, the acute and late LUTS and RS caused by this treatment approach, were mostly mild (grade 0-1) with high recovery rates, with only few patients developed toxicities of higher grades (≥ 2). For patients without pre-existing ED, all the patients presented with an impaired function after treatment, and only a few recovered completely.
Regarding toxicity rates of this treatment approach, our data are in accordance with prior cohorts using similar doses and toxicity definitions [16, 17]. The added value of our study cohort is the detailed information on the pattern of recovery after toxicity that provides some interesting insights. The recovery rates for LUTS and RS were relatively high, but with nearly half of patients suffering from any grade LUTS at the end of follow-up and one-fifth from RS. Most of the patients with remaining toxicity at the end of follow-up suffered from low-grade toxicity. Although the number of patients not recovering from LUTS or RS can be considered as low in group-level analyses, suffering from LUTS or RS due to treatment at individual level is a difficult situation that can negatively impact individual’s quality of life [20]. On the contrary, the recovery pattern in patients suffering from ED was different since only few patients recovered to a normal erectile function.
In terms of identifying potential predictive factors for toxicity, we found few statistically significant correlations between certain parameters and toxicity in the bivariate analyses. However, the multivariable analyses did not provide much additional information. In summary, age seems to be a risk factor for acute LUTS, V100 (interchangeable with PTV) for late LUTS, and rectal toxicities (acute and late). For ED, usage of ADT and V200 appears to be risk factors.
Previous studies investigating potential predictive factors for toxicity in PC patients treated with radiation therapy have shown contradictory results, with some studies suggesting a correlation between various dosimetric parameters with LUTS or RS, whereas others, including the present study, failed to confirm these correlations. Chicas-Sett et al. [16] investigated late rectal toxicity (LRT) in a cohort of 300 patients treated with a combination therapy. A significant correlation was found between D2.0cc and LRT grade 1-3. However, no threshold dose was established because of small differences in D2.0cc values between patients who did and did not develop toxicity; therefore, no predictive model was obtained. In another study by Kragelj et al. [17], primary objective was to assess a predictive ability of HDR-BT parameter D2.0cc of the rectum, as the international GEC-ESTRO recommendations [20] suggest it as a predictor of LRT caused by a combination therapy. A new parameter based on the sum of mean dose from EBRT and D1.0cc of the rectum was created, and proven to be the only statistically significant predictor of LRT.
There can be several reasons for these discrepancies, such as differences in dose constraints among treatment centers (for example, in ÖUH, the D10Rm must be ≤ 65% of the total BT dose) as well as differences in treatment and follow-up routines. In addition, the use of different scales for grading toxicities and cut-offs (such as grade ≥ 1 instead of ≥ 2), leading to higher or lower numbers of outcome-events among studies as well as differences in baseline patients’ characteristics, e.g., regarding comorbidities, could also be contributing factors to these discrepancies. Furthermore, parameters influencing statistical analyses, including sample size, number of events, and different approaches, on which parameters to include in multivariable models might also, in part, explain these discrepancies.
Due to the above-mentioned uncertainties, predictive models based on analyses from one treatment center would most likely be applicable only to patients treated and followed according to similar, if not identical, guidelines.
Limitations
The present study has several limitations that should be considered when interpreting the results. The sample size and the number of toxicity events were relatively low, thus influencing the possibility to perform statistical analyses with adequate power. In addition, the available potential predictive parameters for toxicity were fairly limited due to lack of relevant information. Specifically, dosimetric data were only retrieved from brachytherapy dose planning system, which means that dosimetric data for EBRT were not included. Furthermore, the bladder was not included in the brachytherapy dose planning; thus, no doses received by the bladder were considered in the analyses.
Conclusions
In our study cohort, we were unable to develop predictive models, which could be used in clinical practice to predict radiation-related toxicities in PC patients treated with HDR-BT and EBRT. However, the severity of toxicities due to combination therapy was in general mild or moderate and temporary with high recovery rates, whereas the incidence of severe toxicities was considerably low. Our findings are reassuring that this treatment approach as curative therapy for localized PC is well-tolerated.