

Purpose
Prostate-specific antigen (PSA) changes demonstrate certain dynamic in patients treated for prostate cancer (PCa), often referred to as ‘PSA kinetics’. Maximum PSA value is vital for initial staging, and PSA nadir (nPSA) is associated with prognosis in patients treated with external beam radiotherapy (EBRT) for localized PCa [1] as well as the time to its occurrence [2]. However, a recent meta-analysis of Gharzai et al. found that biochemical and local failure should not be considered as surrogate end-points for overall survival, unlike metastasis-free survival (MFS) [3].
The use of a definitive biochemical recurrence (BCR) threshold, as defined by Phoenix criteria [4] is also limited in brachytherapy (BT)-based treatment of PCa by relatively common occurrence of PSA-bouncing [5, 6]. This phenomenon is defined as an increase of PSA level by ≥ 0.2 ng/ml over the value of nPSA, and followed by a spontaneous decrease to the level of initial nPSA or lower. PSA bounce is attributed to an anti-tumor immune response [7], and its occurrence is associated with superior prognosis [5, 6, 8, 9], but it might be more difficult to correctly diagnose in patients undergoing androgen deprivation therapy (ADT) due to intermediate- or high-risk group PCa [10].
In this article, we aimed to assess the prognostic value of PSA-kinetics for MFS, and to evaluate the added value of using multiple PSA-related indices in PCa patients treated with EBRT, high-dose-rate (HDR) BT boost, and ADT.
Material and methods
Study population and patients’ selection
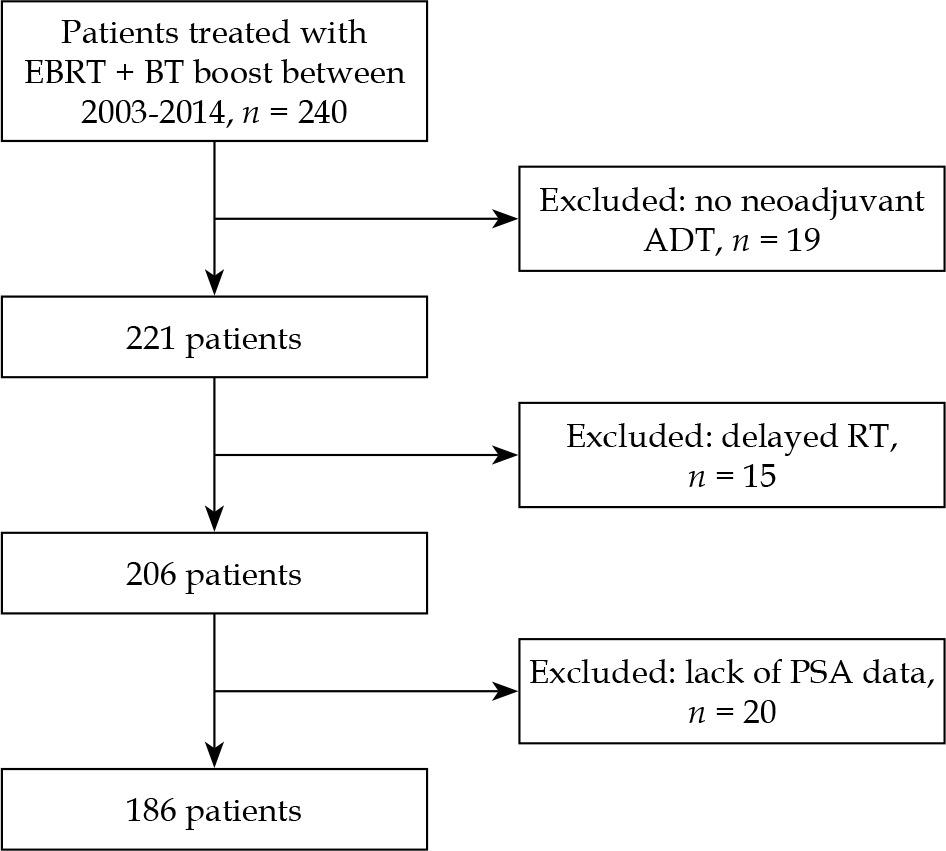
Initial study cohort comprised of 240 consecutive patients treated with EBRT + BT boost between 2003 and 2014 at a single tertiary institution. Study period was based on a limited data availability of patients treated before 2003, and initiation of a different BT boost fractionation scheme after 2014. For final analyses, we included data of 186 patients from that cohort, who underwent neoadjuvant ADT, followed by EBRT and BT boost. Exclusion criteria were substantially delayed initiation of radiotherapy (RT) and missing data. Study flowchart is presented in Figure 1. This retrospective study was approved by bioethics committee of Maria Sklodowska-Curie National Research Institute of Oncology, Gliwice, Poland (approval No. KB/430-82/21).
Radiotherapy delivery and ADT
Majority of patients were treated with 54 Gy (n = 114, 61.3%), 64 Gy (n = 9, 4.8%), or similar total dose (n = 2, 1.1%) in 2 Gy fractions combined with a single fraction 10 or 10.5 Gy BT boost, between 2003 and 2009. From 2008 to 2014, 61 (32.8%) patients were treated with 46 or 50 Gy EBRT combined with two fractions of 10.5 Gy HDR-BT boost. Elective pelvic radiotherapy up to 44 Gy (n = 123, 66.1%), 46 Gy (n = 13, 7%), or 44 Gy (n = 12, 6.5%) was performed in 148 (79.6%) of patients. To account for different radiotherapy fractionation schemes, a biologically effective dose (BED) was calculated using α/β of 3 Gy and the following equation:
where n is the number of fractions and d is the fraction dose. Each BED was a sum of separately calculated BED for EBRT and BT boost.
Each of the patients received neoadjuvant ADT, followed by concomitant ADT in 161 cases (86.6%) and adjuvant ADT in 144 cases (77.4%). Median duration of neoadjuvant ADT was 4.2 months (interquartile range [IQR], 3.3-6), up to a total of median 16.4 months of ADT (IQR, 7.7-29.1). In majority of the patients, ADT comprised of gonadotropin-releasing hormone modulator combined with non-steroidal anti-androgen drug (n = 144, 77.4%). Gonadotropin-releasing hormone modulator was used in monotherapy in 32 cases (17.2%), and 10 of the patients received non-steroidal anti-androgen drugs as a sole agent (5.4%). None of the patients had a medical intervention relevant to PCa treatment before the initiation of neoadjuvant ADT.
Definition of prognostic factors and end-points
PSA nadir was defined as the lowest serum PSA value recorded after initiation of ADT but before any salvage treatment. A decrease in PSA level, likely due to a change in laboratory or method of measurement only, was not considered an nPSA. Time to PSA nadir was calculated from the onset of ADT. Moreover, pre-specified PSA nadir threshold values were analyzed based on the available literature data. Pre-treatment prognostic factors included maximum value of PSA, TNM staging, and ISUP Gleason grade group [11].
PSA bounce was defined according to the literature data [9] as a temporary rise in PSA level by ≥ 0.2 ng/ml over the value of pre-bounce nPSA, followed by a spontaneous decrease to the same level or lower. Time to PSA bounce was calculated from the onset of RT to the peak PSA during the bounce. BCR was defined as an occurrence of nPSA + 2 ng/ml, and time to BCR was calculated from the ADT implementation.
Primary end point was MFS, defined as the time from the initiation of ADT to the diagnosis of distant metastasis or cancer-related death. Diagnosis was based on medical imaging performed during follow-up either routinely or due to rising PSA or clinical symptoms. In each case, the initial M0 status was confirmed by at least bone scintigraphy, pelvic and abdominal computed tomography, and chest radiography.
Cases lost to follow-up or deceased due to non-cancer-related causes were censored using the date of last known follow-up.
Statistical analysis
Patients’ characteristics were summarized using mean and standard deviation (SD) for continuous variables with normal distribution or median, and values of lower and upper quartile (interquartile range, IQR) for continuous variables with other than a normal distribution. Normality of distribution was verified using Shapiro-Wilk test. Nominal variables were summarized as numbers with appropriate percentages. To identify the best cut-off of nPSA differentiating between patients with good or poor MFS, Cutoff finder was applied [12], with significance in log-rank test as a method for cut-off determination. Kaplan-Meier survival curves were used to compare MFS between patients, who did or did not achieve pre-specified nPSA levels. Univariate and multivariate Cox proportional hazards models reporting hazard ratios (HR) with 95% confidence intervals (95% CI) were used to analyze the effect of PSA kinetics on MFS while controlling for clinical variables. nPSA was multiplied by 10 when this parameter was included in Cox proportional hazards models to facilitate the interpretation of HRs. PSA bounce was used as a time-dependent covariate in Cox regression models. Concordance statistic (c-index) and Akaike information criterion (AIC) were calculated to evaluate multivariate models, and a likelihood ratio test was used to compare multivariate models with or without PSA kinetics parameters. P-values below 0.05 were considered statistically significant. Statistical analyzes were performed using R software version 4.1.1.
Results
The final database included 186 patients, with a median of 18 PSA measurements per patient (IQR, 12-28) over a median follow-up of 110 months (IQR, 52-149 months). The majority of the patients presented with PCa of either high- (n = 92, 49%) or intermediate- (n = 91, 49%) risk groups. Patients’ clinico-pathological features are presented in Table 1.
Table 1
Clinical characteristics of the study group
The 5- and 10-year MFS were 95% and 84% respectively. Distant metastasis occurred in a total of 26 patients throughout follow-up. The most frequent metastasis sites were bones (n = 20, 77%), followed by lymph nodes (n = 10, 38%), lungs (n = 3, 12%), and liver (n = 1, 4%), including eight patients with simultaneous metastases to multiple sites. The metastases were most commonly diagnosed through follow-up bone scintigraphy (n = 9, 35%), positron emission tomography scan (n = 8, 31%), computed tomography (n = 6, 23%), or magnetic resonance imaging (n = 3, 12%).
Prognostic value of PSA nadir
The nPSA (median, 0.011; IQR, 0.007-0.057 ng/ml) was significantly associated with the risk of metastasis in univariate analysis (HR = 1.09, 95% CI: 1.05-1.13, Table 2), and remained an independent prognostic factor in multivariate analysis after adjusting for clinical stage, Gleason grade group, and maximum PSA level, as presented in Table 3. The nPSA < 0.2 ng/ml occurred in 167 (89.8%) patients. Patients with nPSA < 0.2 ng/ml were characterized by significantly superior metastasis-free survival (HR = 0.25, 95% CI: 0.11-0.58). The median time to nPSA occurrence was 11 months (IQR, 8-18 months), and was not associated with MFS in univariate or multivariate analysis (Tables 2, 3).
Table 2
Univariate Cox proportional hazards regression analysis for metastasis-free survival in 186 patients treated with EBRT combined with BT boost and ADT for localized prostate cancer
[i] BT – brachytherapy; ECOG – the Eastern Cooperative Oncology Group score; Gleason grade group – International Society of Urological Pathology 2014 grade group system; BED – biologically effective dose; nPSA – PSA nadir; ADT – androgen deprivation therapy; TURP – transurethral resection of the prostate
Table 3
Multivariate Cox proportional hazards regression models for metastasis-free survival including prostate-specific antigen nadir (nPSA) and time to nPSA in 186 patients treated with EBRT combined with BT boost and ADT for localized prostate cancer
Pre-specified PSA thresholds
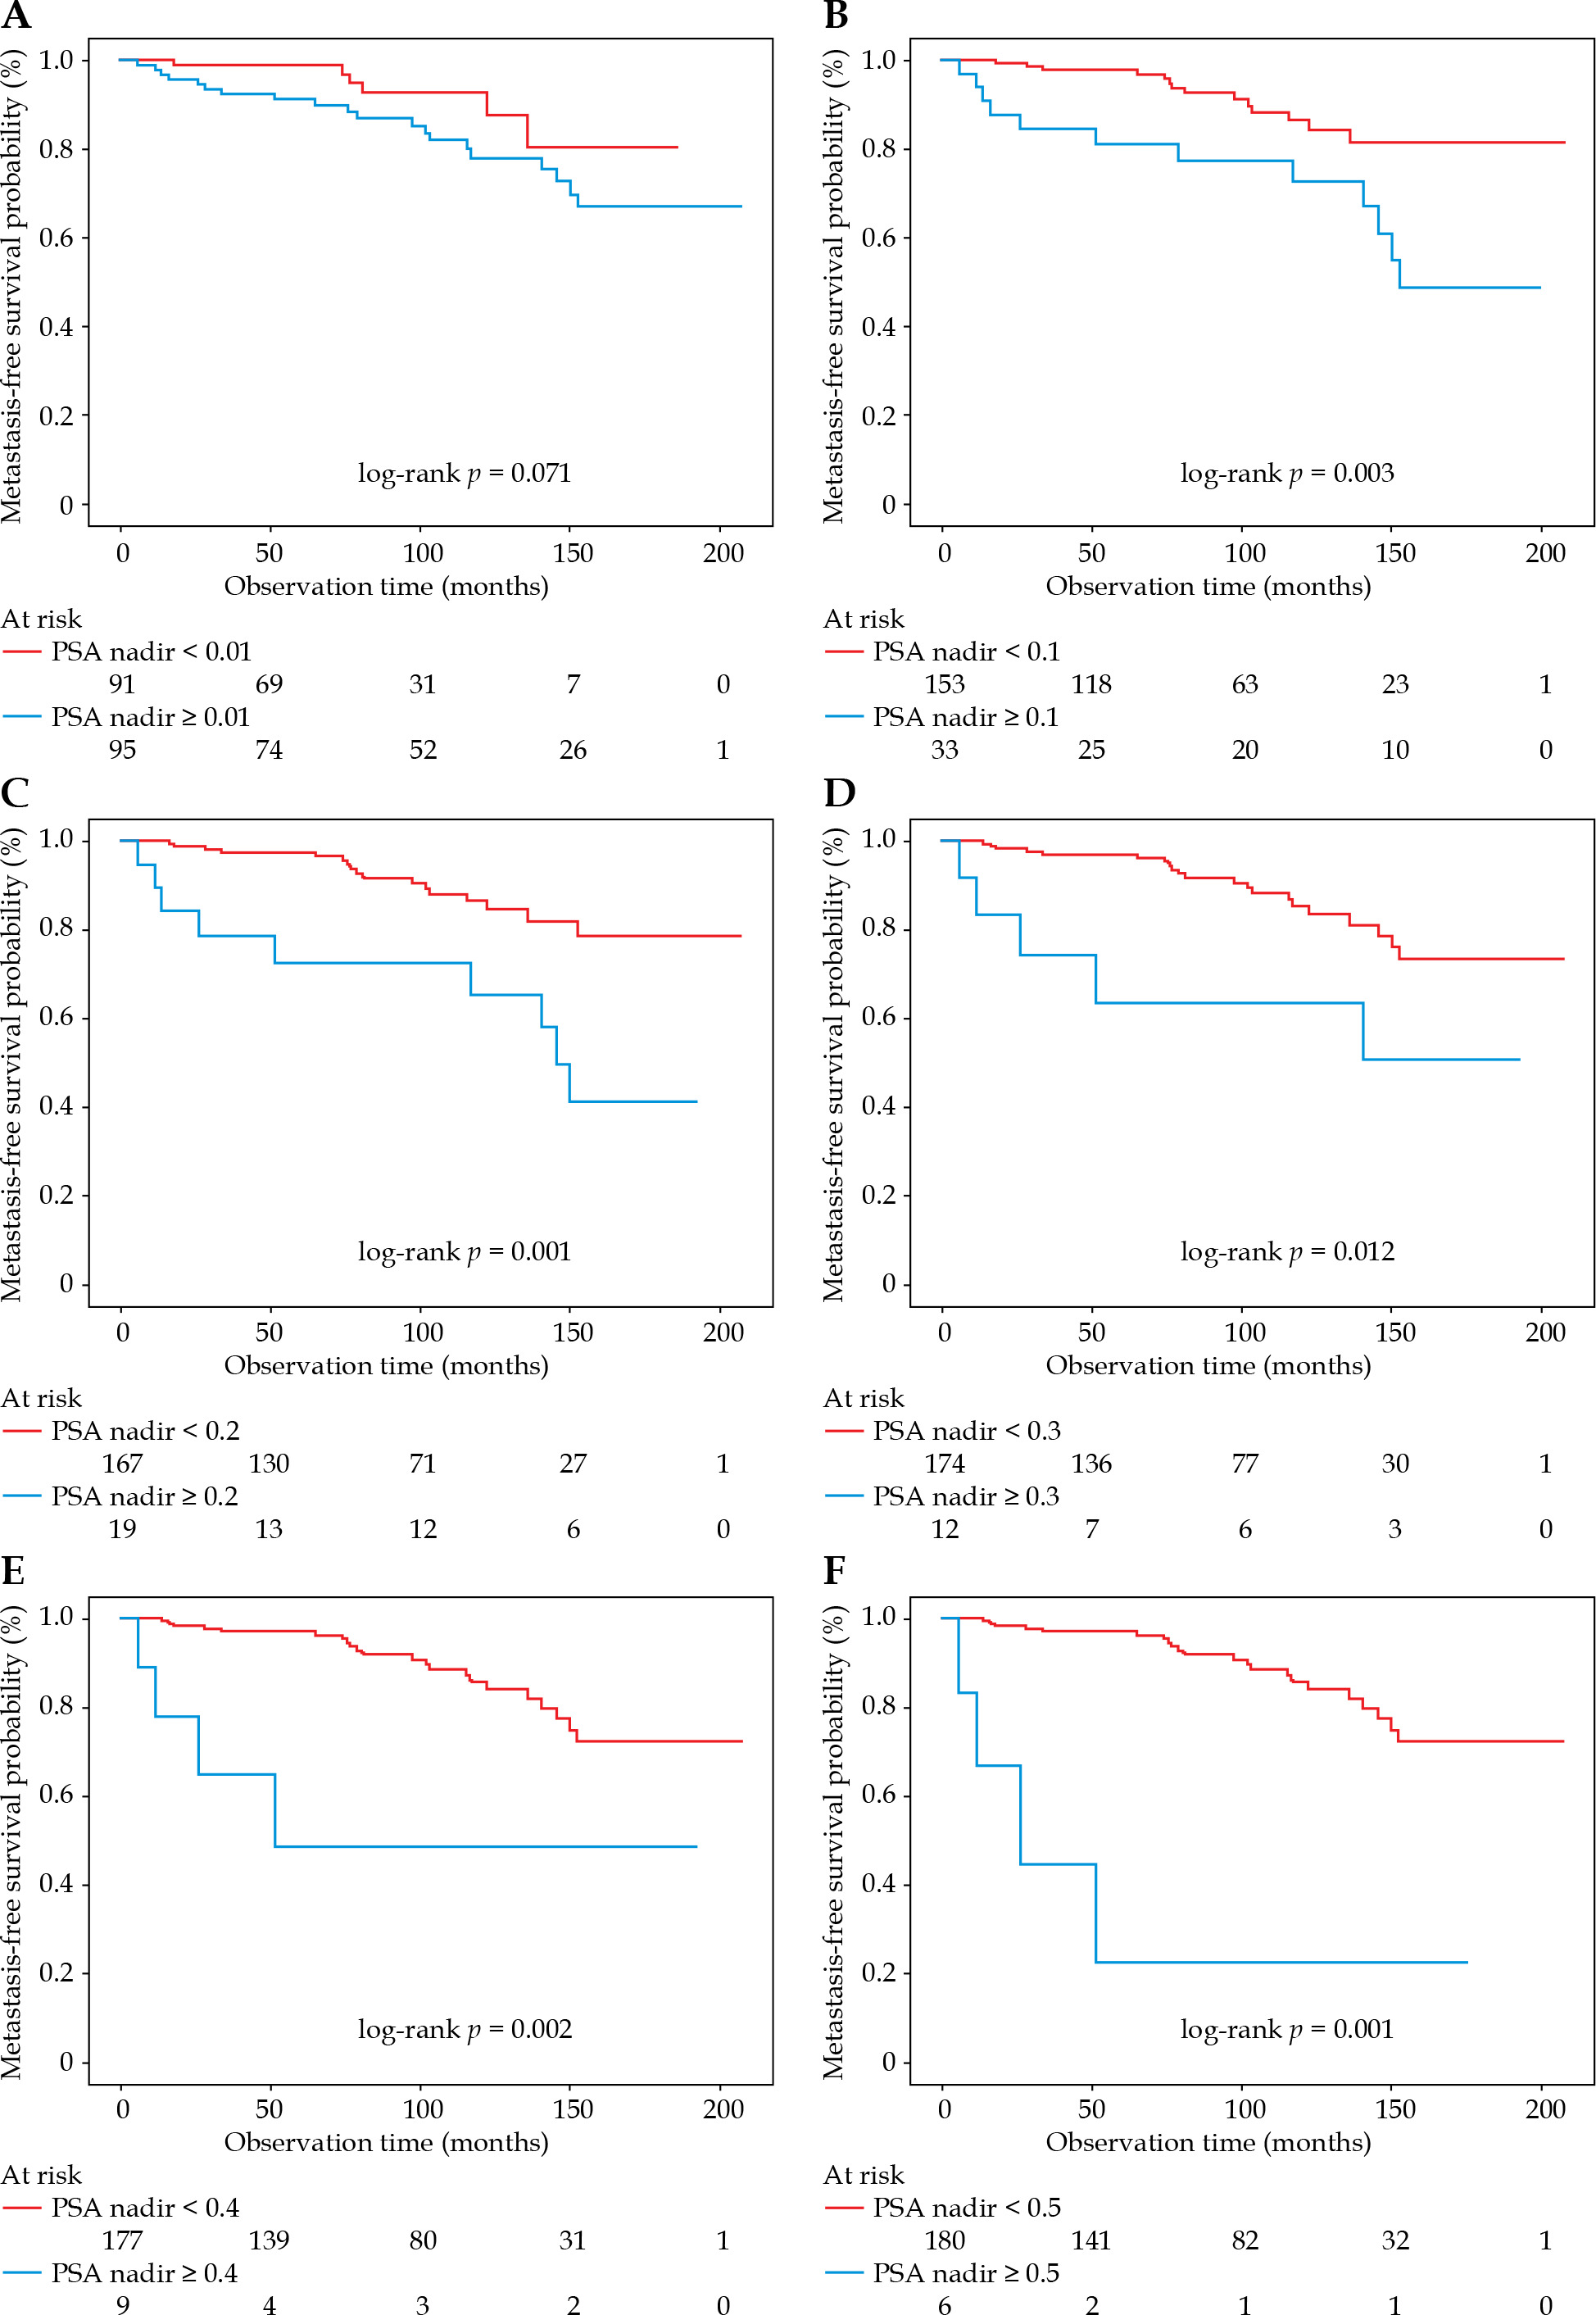
There was a statistically significant difference in MFS between patients stratified by nPSA, reaching threshold values of 0.1, 0.2, 0.3, 0.4, or 0.5 ng/ml (Figure 2B-F), but not < 0.01 (Figure 2A). Cutoff finder analysis [12] suggested nPSA = 0.208 to be the most optimal for dividing patients into those with good or poor MFS, and consecutively, the corresponding threshold of nPSA < 0.2 ng/ml was selected for further analysis. The median MFS in patients who did not experience nPSA < 0.2 was 94 months, and the median MFS did not reach during follow-up in patients who experienced nPSA < 0.2 (Figure 2C, p = 0.001).
PSA bouncing
Twenty-three patients (12.4%) experienced PSA bounce after a median of 24 months (IQR, 14-29 months) after starting radiotherapy to a median level of 0.479 ng/ml (IQR, 0.334-0.838 ng/ml). In the majority of the cases, the PSA bounce occurred after the completion of adjuvant ADT (n = 19, 83%), while in 4 cases (17%), the patients were still undergoing ADT. Five patients had a bounce amplitude > 1 ng/ml. In univariate analysis, PSA bounce as a time-dependent variable, was not associated with MFS (p = 0.142). In multivariate analysis, while correcting for TNM stage, Gleason grade group, maximum PSA level, and nPSA, only nPSA (HR = 1.13, 95% CI: 1.07-1.19 per change in 10 ng/ml), Gleason grade group 5 vs. 1/2 (HR = 3.49, 95% CI: 1.29-9.47), and TNM stage > T1c vs. T1c (HR = 4.03, 95% CI: 1.01-16.05) were significant predictors of MFS (Table 4).
Table 4
Multivariate Cox proportional hazards regression analysis for metastasis-free survival with prostate- specific antigen (PSA) bounce as time-dependent variable in 186 patients treated with EBRT combined with BT boost and ADT for localized prostate cancer
Clinical application of PSA kinetics
Including nPSA in a multivariate model predicting MFS, significantly improved model performance (p < 0.001 in likelihood ratio test) compared to pre-treatment prognostic factors (model 1 vs. model 3 in Table 3). Time to nPSA, on the other hand, did not add a predictive value (p = 0.893 in likelihood ratio test). The c-index for the model including nPSA as a continuous variable was 0.80 compared to 0.78 for a model with nPSA < 0.2 ng/ml, and 0.68 for a model with pre-treatment prognostic factors alone.
Discussion
PSA kinetics has been widely discussed in the literature in multiple applications, but there is limited data on their value in a setting of EBRT combined with BT boost and ADT as independent prognostic factors for the risk of distant failure. PSA kinetics provide a useful practical tool in patients treated for intermediate- and high-risk prostate cancer; however, clinical application is substantially different from initial risk stratification. PSA kinetics can improve accuracy of the risk assessment model, but according to definition, only during follow-up. Considering that, prognostic data provided by nPSA reaching values below 0.2 ng/ml is available at a median of 6 months, and 11 months for absolute nPSA. PSA kinetics can suggest when to increase the frequency of follow-up visits in patients at a higher risk of developing distant metastasis, or conversely, when to reduce the number of follow-up visits in applicable cases, which is often important due to advanced age and reduced mobility of patients.
There are several pivotal findings of our study. First, the nPSA was found to be an independent prognostic factor. Second, the cutoff value of 0.2 ng/ml was found to be most informative for MFS, consistently with commonly used nPSA threshold in metastatic PCa patients [13]. The strength of using 0.2 ng/ml threshold value lies in the earlier median time of occurrence of 6 months, in applicable cases, compared to a median of 11 months for absolute nPSA. Moreover, since nPSA in our dataset was characterized by similarly low values in many patients, possibly leading to unstable HR estimation for nPSA as continuous variable, using a cutoff value of 0.2 ng/ml to make conclusions regarding its prognostic value seems more reliable. Third, the time to nPSA was not statistically significant prognostic factor in our analysis. We hypothesize that more rigorous regime of PSA testing, especially before the initiation of RT, could improve discriminatory ability of the time to nPSA. Fourth, there was no significant association between PSA bounce and MFS in the time-dependent analysis.
ADT presents a synergistic effect with RT through modulation of radiosensitivity, facilitation of RT delivery associated with prostatic volume reduction, and elimination of sub-clinical micro-metastasis [14]. It has been shown that in patients treated with radiotherapy and ADT, PSA nadir was associated with patients’ prognosis. For example, PSA levels exceeding 0.3 ng/ml after radiotherapy and short-term ADT [15], and exceeding 0.5 ng/ml after RT and 6 months of ADT [16], are associated with poor outcomes, including a negative effect on cancer-specific survival. The PSA nadir, however, in most cases, does not reflect the effect of irradiation, but hormone sensitivity and response to ADT, and can occur even before the onset of RT. The nPSA is also found in patients treated with RT alone, but the values tend to be higher compared with nPSA in patients treated with RT combined with ADT [16, 17].
The combination of ADT and BT has been regarded as controversial in the literature, and the discussion remains on the subject of optimal indications, timing, and duration. ADT has a documented detrimental effect on patients’ quality of life [18] and is generally not recommended as a part of radiotherapy-based primary treatment of low- and favorable intermediate-risk PCa patients [19]. A systematic review by Keyes et al. has even suggested that in unfavorable intermediate- and high-risk groups of patients, despite beneficial effect on BCR, ADT might be associated with potential detriment to overall survival [14]. A recent propensity-score matched analysis of ADT used in patients treated with EBRT + HDR-BT boost for PCa, although favorable for ADT, failed to show statistically significant improvement in terms of clinically significant outcomes [20]. However, current NCCN guidelines [19] endorse short-term ADT (4-6 months) as an optional addition to EBRT + BT boost in unfavorable intermediate-risk PCa patients, and long-term (1-3 years) ADT as a mandatory part of treatment for high- and very-high risk patients. That considered, the subject of neoadjuvant versus adjuvant ADT in combination with radiotherapy remains controversial, with recent meta-analysis [21] suggesting that adjuvant ADT might be associated with improved outcomes.
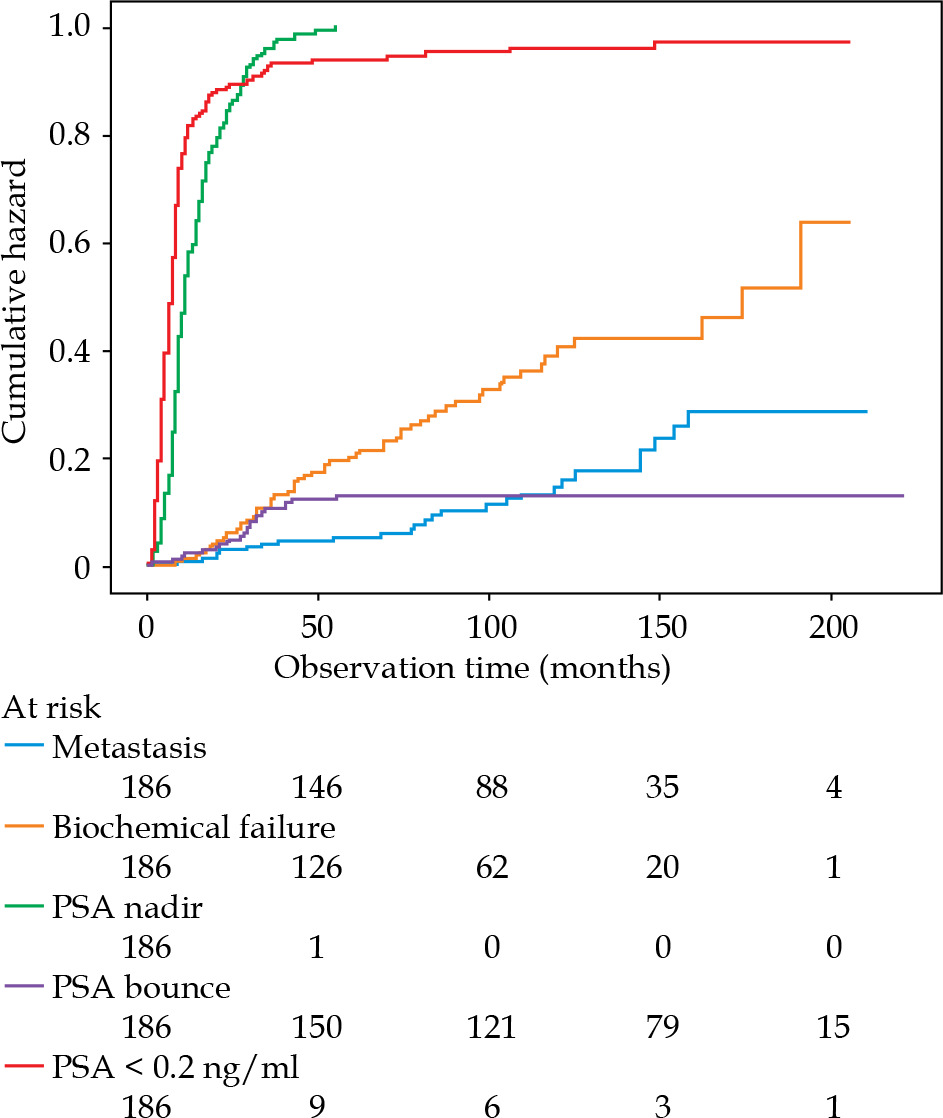
Currently, there is no evidence that PSA bouncing is associated with improved MFS in patients treated with ADT combined with EBRT and BT boost. The available data focuses on the risk of BCR [9, 22], which has been recently shown to be a suboptimal intermediate end point for clinical trials among PCa patients [3]. On the other hand, our study included patients who received BT boosts using a fraction dose of approximately 10 Gy. Giving that, the probability of PSA bounces increases with fraction dose [23] and perhaps this index could prove to be useful in patients receiving a single-fraction BT boost with a higher fraction dose. PSA bounce is challenged by a few important limitations related to definition of the index. PSA bounce can only be identified retrospectively. Therefore, PSA bounces exceeding 2 ng/ml, which account for approximately 35% in patients treated with EBRT combined with BT boost [9], might be mistaken for BCR. For example, in our study, fifty-nine patients experienced BCR. The median time to BCR after ADT initiation was 75 months (IQR, 42-114 months). The occurrence of PSA bounces and BCR was similar during the first two years of follow-up, as shown in Figure 3. However, only as few as 5 PSA bounces exceeded 1 ng/ml, and the median PSA bounce was relatively low (0.479 ng/ml) suggesting that some of PSA bounces could have been falsely recognized as BCR.
Fig. 3
Occurrence of treatment failures and prostate-specific antigen (PSA)-related indices over time in 186 patients treated with EBRT combined with BT boost and ADT for localized prostate cancer
Long-term ADT can suppress the occurrence of PSA bounce, which usually appears between first and second year after EBRT combined with BT boost [9]. However, short-term ADT can result in PSA rise following testosterone recovery, approximately 16.3 months after treatment [24], which sometimes mimics PSA bounce [25]. In some patients, PSA level can even exceed BCR threshold. We hypothesize that in some of these cases, early salvage treatment is implemented before a spontaneous PSA decrease, and thus, the PSA rise is falsely regarded as a treatment failure. PSA can also temporarily increase in association with daily activities, such as exercise or sex [26]. Moreover, similarly to other prognostic factors found throughout follow-up, PSA bounce is prone to the so-called ‘immortal time bias’ [27]. There is a period of certain metastasis-free observation, equal to a median time to PSA bounce, and if not accounted for through time-dependent methods of analysis, comparisons such as log-rank testing, can falsely suggest MFS benefit.
We acknowledge the limitations of the study. The study included retrospectively collected data of 186 patients treated within a long-study period. The patients were treated with two different brachytherapy fractionation schedules, various combinations of EBRT and elective pelvic irradiation, different ADT durations, and in a few cases, would no longer be considered candidates for ADT according to the current standards [14]. The Gleason scores were adjusted to 2014 ISUP Gleason grade groups according to EAU guidelines, but as suggested in original paper [11], some of the older Gleason 6 patterns would now be rated as 7; thus, underestimating the risk. Moreover, the vast majority of PSA tests were made at the same laboratory, but at least some of the measurements were made with different laboratory assays. The PSA measurements were not evenly distributed in time between the patients, which might have affected the time-to-nPSA and PSA bounce analysis. Generally, the patients were monitored every 3 months during the first 1-2 years, every 6-12 months, up to 5 years after RT, and once a year thereafter. However, there were differences associated with the patients’ and physicians’ preferences, which we were unable to account for due to the retrospective nature of this analysis. A lack of prospectively maintained standard for the diagnosis of PSA bouncing might also have caused some of the bounces to be falsely recorded as BCRs.
Conclusions
Lower values of nPSA are significantly associated with a decreased risk of developing metastasis in PCa patients treated with EBRT combined with HDR-BT boost and ADT, and significantly improve the accuracy of prognostic model for MFS compared to pre-treatment risk factors alone. The occurrence of PSA bouncing, however, was not found to be statistically significantly associated with MFS in these patients. There is a persistent need to improve risk-stratification in patients treated with EBRT combined with HDR-BT boost and ADT, and prospective trials are necessary to definitively assess the prognostic value of PSA kinetics.