
Introduction
Acoustic rhinometry (AR) is a diagnostic method for non-invasive measurement of intranasal spaces. It uses the reflection of a sound wave converted into electrical impulses and generated during the nasal cavity assessment. An AR set consists of a sound generator, a sound tube, a wave-sending microphone, an amplifier, a computer (equipped with analogue-to-digital converters) and an anatomical or conical nasal adapter. The spatial resolution of an AR set falls within the 0.33–0.47 cm range, and the measurement points mark the rhinometric curve at 3.3–4.7 mm intervals. Factors such as noise (up to 74 dB), temperature fluctuations or lack of tightness of the adapter with a rhinometric tube substantially affect the final result of the test. It is recommended by the Committee on Acoustic Rhinometry Standards of the European Rhinologic Society that AR tests should be performed according to the basic principles of accuracy (accuracy of measurement), repeatability (consistency of measurements), reproducibility (consistency of measurements when changes are made, such as changes of apparatus or the tester), spatial resolution (the capacity to distinguish between spaces along the distance axis) [1]. The general availability of AR, the ease of its application (in children at the age of 5 or older), and the high specificity and sensitivity of the method make it a good tool for assessing the extent of nasal obstruction [2]. It is particularly useful in assessing the bone structure of the nasal cavity (nasal septum deviation) and nasal cavity polyps, in obstructive sleep apnoea diagnosis, as well as in assessing the effectiveness of therapeutic treatment or surgical treatment, and in nasal provocation tests. The last of the applications above, which is particularly recommended in EAACI Position paper on the standardization of nasal allergen challenges [3], adds to the role of this objective nasal patency assessment technique.
The rhinometric curve: interpretation in the broad sense of the term
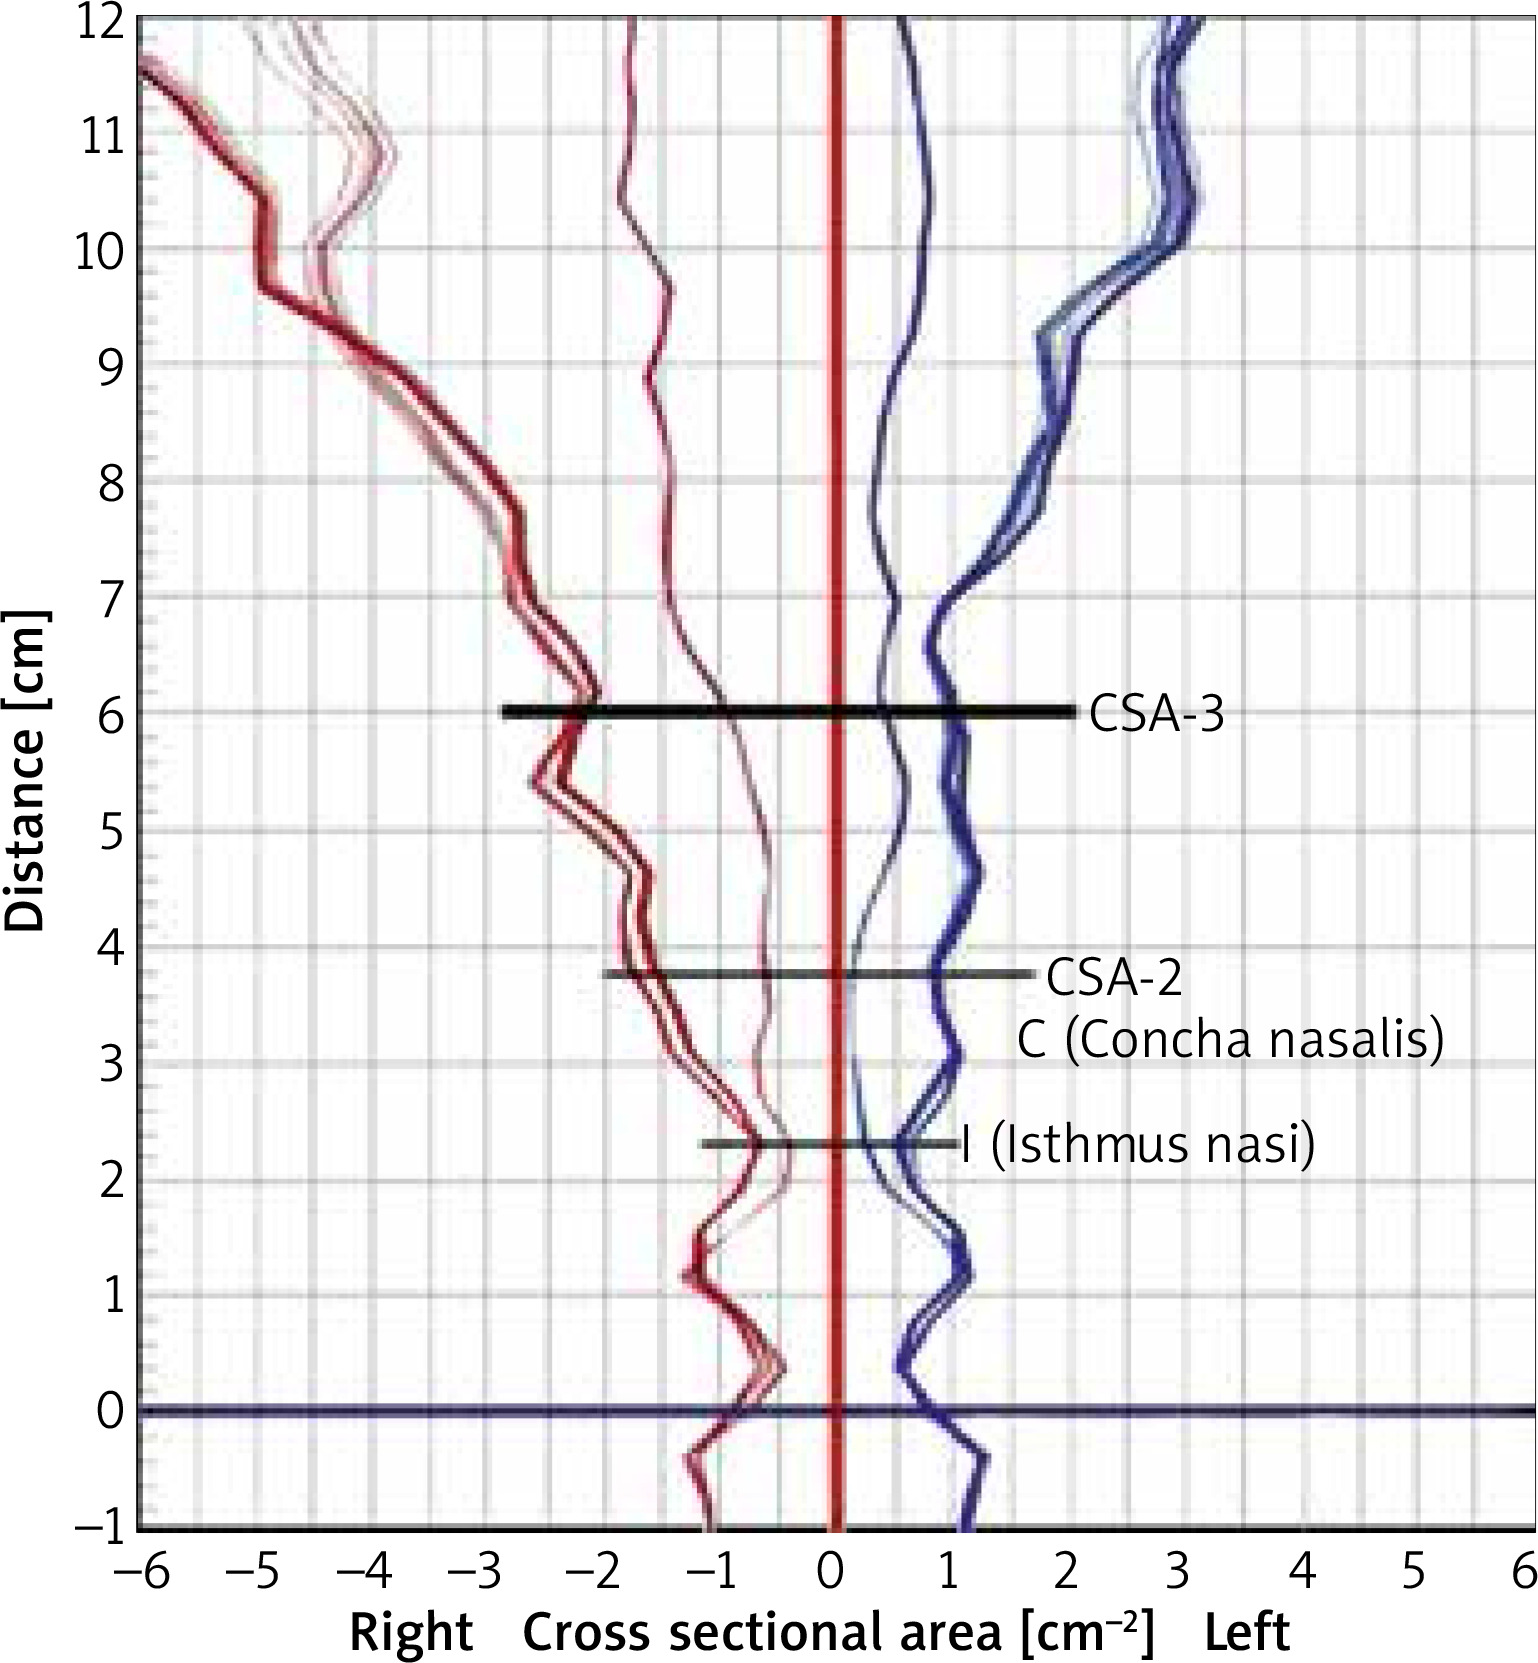
The rhinometric curve provides plenty of valuable information that can be used to verify the extent of nasal obstruction or nasal patency on the one hand and is very useful in differential diagnosis of rhinitis conditions on the other. A secondary effect of the reflection of a sound wave is a diagram showing cross-sectional areas at a certain depth of the nasal cavity: the X axis shows the length of the nasal cavity and records longitudinal parameters of the nasal cavity, while the Y axis shows the size of the cross-sectional areas at various points of the nasal cavity and records transverse parameters of the cavity (Figure 1). The different points on the AR curve indicate the following: 0: the start of the nasal cavity, I: the nasal isthmus (isthmus nasi): the peak point of the first AR curve wave, which corresponds to the first narrowing of the nasal cavity, C: the head of the inferior nasal concha (concha nasalis): the peak point of the narrowing of the second AR curve wave, which corresponds to the second narrowing of the nasal cavity, E: the distal section of the head of the inferior nasal concha, F: the top point of the elevation of the AR curve between points I and C. The areas at the above points indicate the following: 0-I: the vestibule of the nose, I-C the distance between the nasal isthmus and the head of the inferior nasal concha, C-E: the end of the nasal concha, E-G: the nasopharynx space. Nasal patency is indicated by narrowing of points. The position of these points varies depending on the internal structure of the nasal cavity and/or the severity of the swelling of the mucous membrane in the nasal cavity. Nasal obstruction in AR is assessed by measuring the v value, namely the minimal cross-sectional area, which is usually the value at point I before the nasal allergen provocation test or at point C after the test; the vv value – by measuring the volume of the nasal cavity; and the vvv value – by measuring the cross-sectional areas (CSAs) of the nasal cavity on the AR curve for different CSA ranges [4].
In the literature, the most frequently assessed area of the nasal cavity is the minimal cross-sectional area (MCA). MCA is represented by a value on the Y axis which corresponds to point I, which is a nasal valve (MCA1: a value of less than 0.28 cm2 indicates nasal septum deviation) and the head of the inferior nasal concha at point C (MCA2 in a positive nasal allergen provocation test). The first point is located 3.3 cm away from the start of the nasal cavities and the other – 4.0 cm away. MCA measurement as a method of assessing the most reactive areas seems inappropriate for the reason that the analysis covers an area with variable parameters. The position of MCA1 in a healthy person should be the same as wave I. If the patient suffers from severe nasal septum deviation, the area under assessment moves to the back part considerably. In contrast, MCA1 is normally located at point I before the nasal allergen provocation test and at point C after the test. There are significant differences between cross-sectional areas in terms of ethnic origin, and these differences are explained by differences in the length of the nasal cavity [5, 6]. In an attempt to determine reference values, average values were estimated for the following populations of subjects: the Caucasian race: 0.72 ±0.02 cm2, the Oriental race: 0.62 ±0.19 cm2, the African Americans: 0.88 ±0.22 cm2, the American Indians: 0.70 ±0.16 cm2, and the Asians: 0.75 ±0.03 cm2 [6–9].
An assessment of any intranasal area may also include measuring the volume of, for example, the vestibule of the nose, the nasal cavity between the anterior and posterior edges of the nasal concha, or of the nasopharynx. Analyses by some authors measure only the vestibule of the nose. Others consider the vestibule as an integral part of the nasal cavity. Yet others exclude the first segment and measure the volume over the 2–7 cm segment of the nasal cavity. The volume of the nasal cavity is measured using AR most frequently for the 0–6 cm segment or the 0–7 cm segment. Volume changes can be measured more precisely if the 2–5 cm segment of the rhinometric curve is analysed. The reference values for the measured volume and the area under analysis are as follows: Total V = 5.86 ±1.40 cm3, V1 = 1.54 ±0.36 cm3, V2 = 1.66 ±0.52 cm3, V3 = 2.64 ±0.70 cm3 [10].
In contrast, a review of the literature shows that cross-sectional areas are a good alternative method of rhinometric curve assessment as it is possible to measure specific points on the Y axis (located 3.3 cm and 4.0 cm from the start of the nasal cavity (CA 3.3; CA 4.0) [3, 4]. An interesting interpretation of the AR curve is proposed by Polish researchers. The start of the rhinometric curve was considered to be the first narrowing, which is wave O. Another analysed area of the broader space of the nasal cavity is, according to the researchers, positioned between waves O and F (CA is greater than 5%) and the curve gradually becomes a narrowing (wave 1). Further calculations included only those F waves which were less than 1.23 away from wave 0. In other cases, waves F and 1 were considered as no data. Interestingly, the analysis used a number of cut-off points such as: 1.15 for the 0 wave search range only; 1.8 for the 1 and 0 wave search range; 1.23 and 2.47 as the limit values of the distance between waves 0 and F and waves 0 and 1. The CSA-3 cm value was measured only if waive 1 was detected. The first wave (CSA-0) visible on the curve was usually the same distance away from the start of the adapter. As indicated by the results of rhinometric measurements, that wave was detected at depths ranging from 0.59 cm to 0.83 cm. However, in severe nasal septum deviation cases, the CSA-0 wave may not occur [5]. In an attempt to assess the reference values for the areas under analysis, the reference values for the cross-sectional area at specified points on the rhinometric curve are estimated as follows: CSA1 = 0.73 ±0.27 cm2, CSA2 = 1.74 ±0.47 cm2, CSA3 = 3.23 ±0.83 cm2 [10].
Critical factors in the assessment of intranasal areas include sex and variable anthropometric parameters of the head, which reflect the age of the subjects [10–12]. Wojas et al. have proved in their studies that the height of subjects correlated with their age: for subjects aged 6 to 18 years, the correlation coefficients were 0.89 for female subjects and 0.92 for males, which translates into the reference values for the measured cross-sectional areas. From a practical perspective, it means that regard may be had to the age of subjects when determining reference values for rhinometric measurements. The measurable rhinometric parameters correlated with the age of subjects (p < 0.000001), but their correlation with sex was considerably weaker. In the case of subjects aged 12 or younger, no statistically significant differences were found between the males and the females. In terms of the surface area of the nasal valve and the average cross-sectional area at the depth of 3 cm outside the nasal valve, significant differences between male and female subjects were identified only for subjects aged 17 years or older [5].
The rhinometric curve: interpretation of the curve in nasal allergen provocation tests
The measured (CA) points on the rhinometric curve that correspond to the cross-sectional areas of the nasal cavity at specific depths of the cavity are particularly useful in nasal allergen provocation tests (NAPTs) [13, 14]. In its consensus statement (the EAACI’s Position paper on the standardization of nasal allergen challenge) [3], recognised the cognitive benefits and value of AR in the assessment of the response of the mucous membrane of the nasal cavity to an allergising agent. Moreover, the specificity and sensitivity of the technique under discussion make it a highly recognised instrument among techniques for objective assessment of intranasal areas. NAPTs with substantially positive results are assessed if the value for cross-sectional areas of the nasal cavity (CSA-2) falls by 40% or more. In contrast, NAPTs with moderately positive results are assessed if the CSA-2 value falls by 20%. It needs to be noted that a subjective assessment of symptoms occurring during the early and late phases of the allergic reaction (55 mm ≥ on the VAS scale) is critical to a complete assessment of the response of the mucous membrane of the nasal cavity. Lebel score, Linder score, Total nasal score: height ≥ 5 points) [3]. In contrast, Amber et al. have proposed to assess the NAPT on the basis of volume changes and the minimal cross-sectional area (MCA), where a NAPT is regarded as positive if the volume/MCA value falls by ≥ 25% [10]. It seems that an assessment of the MCA value as a whole rather than MCA-1 MCA-2 separately carries a risk of interpretation in general terms: the MCA value before the NAPT is positioned in the region of the nasal isthmus and moves deeper into the nasal cavity during the early phase, and it is measured at the head of the inferior nasal concha. It seems, therefore, that an assessment after the NAPT in relation to the initial point (MCA-1), where no significant nasal patency changes occur (during the NAPT), is not really correct. Moreover, the co-existing nasal cycle may significantly affect the overall MCA value. Consequently, it seems necessary in an NAPT assessment to measure the value for MCA-2 located at the target location of the allergic reaction throughout the test process, i.e. during the initial examination, after the administration of a control solution and after local application of an allergen.
An interesting solution is proposed by Samoliñski et al., who introduced the concept of relative reactivity for each point on the AR curve, i.e. for the points spaced at an interval of 3.3 mm determining cross-sectional areas. These points are connected to produce a reactivity curve. This curve is a representation, in percentage terms, of changes in the CA value at different points on the AR curve when the measurements for two states are compared, such as the value measured after the NAPT in relation to the initial, pre-NAPT value for the subject’s nasal cavity. The reactivity of the mucous membrane of the nasal cavity is regarded as that for which an NAPT results in substantial changes to the volume or cross-sectional areas of the nasal cavity occur as compared to the initial examination or after the administration of a control solution. This reactivity is calculated according to the following formula: Re = CAII – CAI/CAI × 100%, where Re is the reactivity value, CAI is the cross-sectional area of the nasal cavity as measured during the initial examination or after the administration of a control solution, and CAII is the cross-sectional area of the nasal cavity after the NAPT. The term more reactive side is also introduced, meaning the side where an NAPT results in substantial changes to the volume or cross-sections areas of one of the sides of the nasal cavity (as compared to the initial examination or after the administration of a control solution). In order to determine the more reactive side, it is necessary to compare differences in the reactivity values between the left side and the right side and, subsequently, to decide which of the two sides is more reactive: it is the one for which the value is more negative, indicating a stronger reaction of the mucous membrane to an allergen [4]. Determining the more reactive side of the nasal cavity is particularly important if the risk that the nasal cycle will affect the final result of the NAPT is to be minimised [15, 16].
It is critical for the purposes of interpreting the results of NAPTs to estimate the position of the strongest allergic reaction. It needs to be remembered that the points identified on the rhinometric curve vary depending on the age and sex of subjects, reflecting the length of the nasal cavity. The hypothesis may be proposed that the length of the nasal cavity affects the position of the area where the mucous membrane of the nasal cavity is the most reactive. In the case of subjects with long nasal cavities, as opposed to those with short cavities, the area is located at 1 cm to the back end of the AR curve. It is usually the case that no significant changes to point I are identified in terms of the anatomical or functional structure of the assessed area (the nasal isthmus, the osteochondral framework) [17–19]. Another aspect is the determination of a corresponding segment with the highest relative reactivity. Studies by Samoliñski show that the segment is positioned 3–4 cm away from the end of the adapter, known as the ascending arm of wave C. The more intensive changes in the cross-sectional areas of nasal cavities are found over a 3-cm segment after point C (CA-C3). It is easy to find this parameter in a figure showing the results of AR measurements. This new method of assessing the results of NAPTs has been shown to be consistent with the clinical condition of the patient and the patient’s self-assessment during the test.
Conclusions
AR, being an objective nasal patency measurement technique, is an excellent alternative in the diagnosis of nasal cavity diseases. Assessed with the use of cross-sectional areas of the nasal cavity over appropriate segments of the rhinometric curve, it seems to be a faithful representation of changes in the course of the NAPT.


