
Introduction
Atopic dermatitis (AD) is the most common chronic inflammatory disorder in children, with a prevalence of up to 20% [1]. In most cases, the diagnosis is made before the second year of life. AD is responsible for considerable decreases in quality of life and increases in health care system costs [2–4]. The underlying mechanisms of AD are not yet fully understood, although substantial progress has been made in understanding the pathogenesis of this disease [5].
It has been reported that preterm neonates are affected by AD less frequently than term children do [6–8], but the exact reason for this phenomenon has not yet been identified. However, a few hypotheses have been proposed. One of these hypotheses describes a change in the T-helper 1 (Th1)/T-helper 2 (Th2) lymphocyte balance in preterm patients. A greater thymus size may lead to a lower risk of developing Th2-type inflammation due to changes in the balance of thymic cell populations in favour of Th1 cells. Another reason may be a shorter time of exposure to Th2 cytokines during pregnancy in preterm infants [6, 9]. Another hypothesis is that T helper 17 (Th17) cell activity may also be involved as cytokine interleukin 17A (IL-17A) is involved in the inflammatory process in older patients with AD [10].
Aim
The main aim of this study was to assess the size of the thymus and the levels of Th1, Th2 and Th17 cytokines in preterm and term children at birth, at term-equivalent age (TEA) in preterm children, and during a follow-up visit in the second year of life, with reference to the possible diagnosis of AD made at this time. To the best of our knowledge, no published study has analyzed this connection yet. Understanding this association may be crucial for further investigations of AD pathophysiology.
Material and methods
Study population
This observational, prospective study was conducted in the neonatal intensive care unit (NICU) in Poland. Forty-seven patients were categorized into two groups according to gestational age (GA) at birth: preterm (born at < 37 weeks of gestation) and term (born at 37 weeks of gestation or later). The exclusion criteria were early-onset sepsis, intrauterine growth restriction (IUGR), a family history of immunodeficiency, intrauterine infection, serious life-threatening inborn defects, or severe birth asphyxia (defined as an Apgar score < 5 points 5 min after birth). On the basis of a literature review, the minimum total sample size was estimated to be 28, assuming a statistical power of 75%, a significance level of 0.05, a χ2 effect size of 0.5 for AD diagnosis, a statistical power of 80%, and a minimum difference of 3 cm3 in the thymic index (Ti) or 100 pg/ml in IL-10 concentration after phytohemagglutinin (PHA) stimulation between the groups [11–15].
Study design
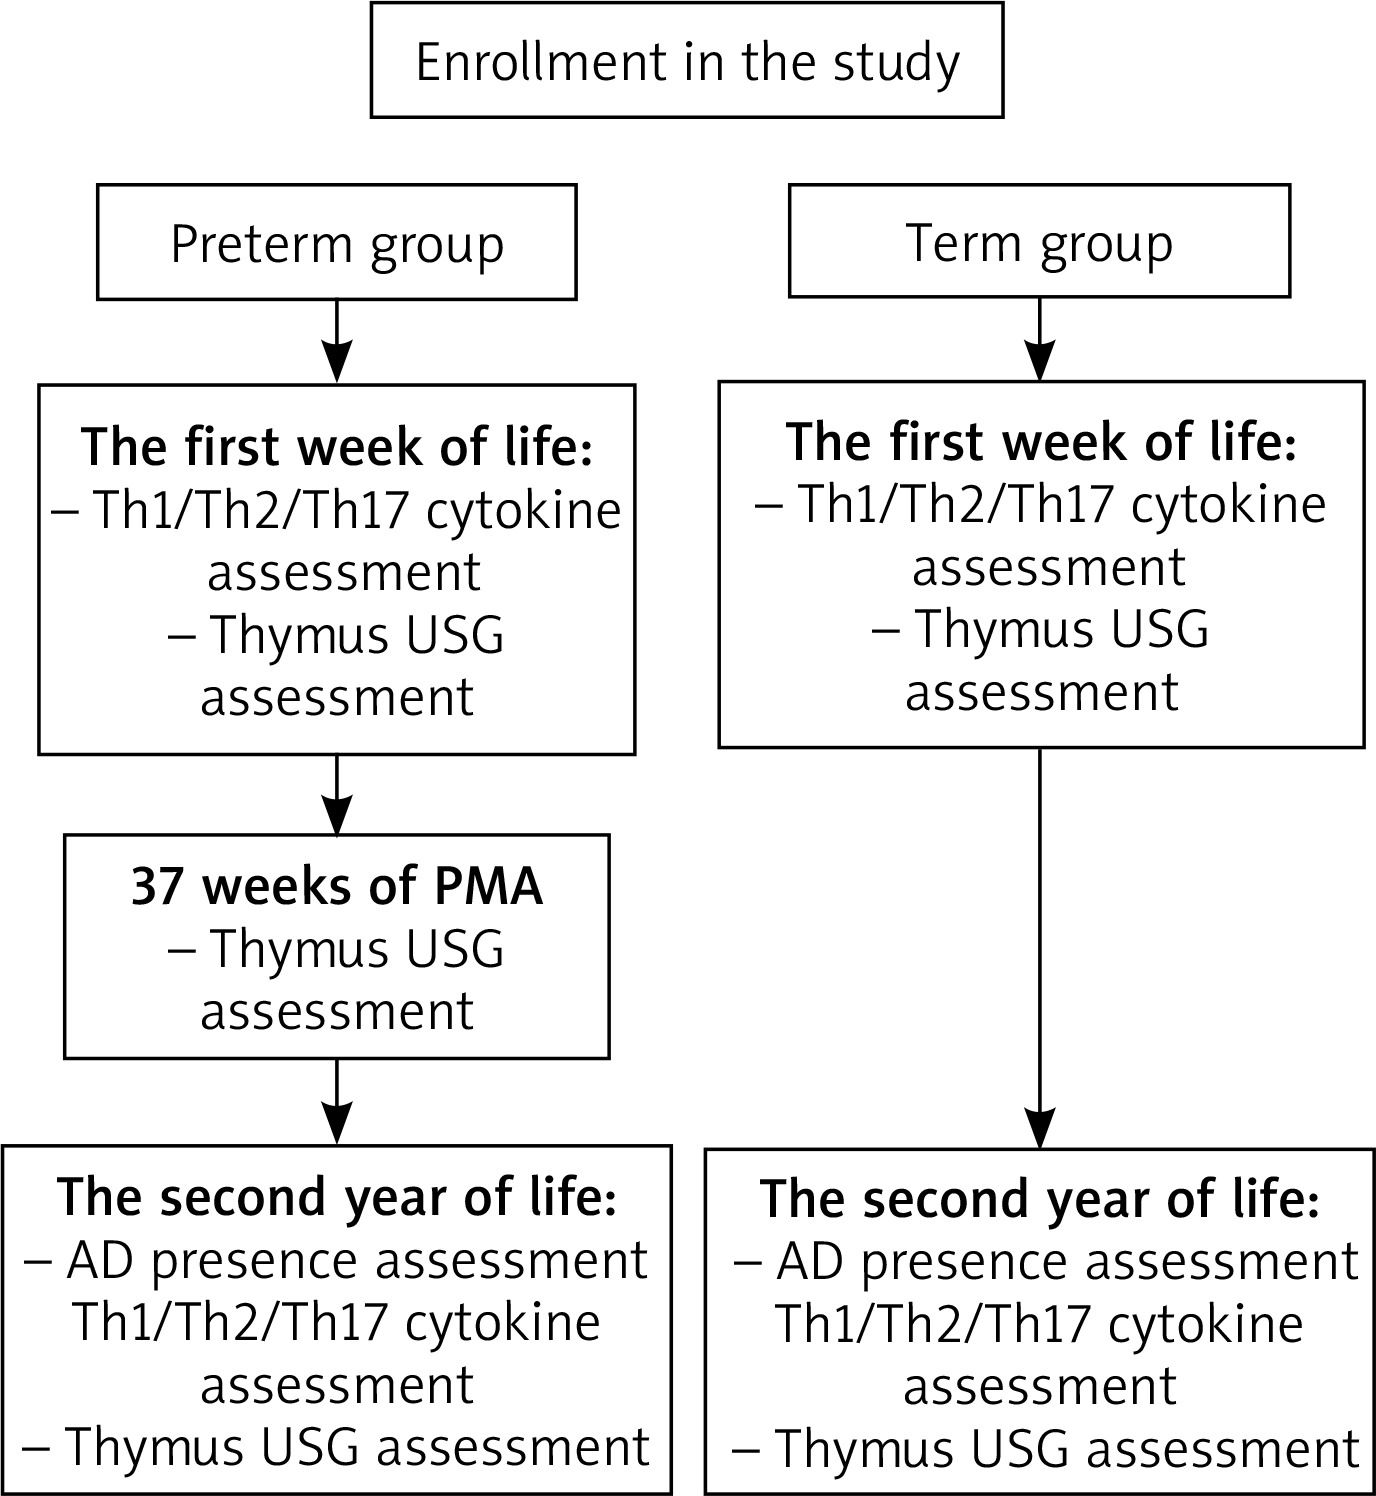
In both groups, blood was collected on the 7th day of life for the assessment of Th1, Th2, and Th17 cytokine levels. At the same time, an ultrasonographic examination of the thymus was performed. The last procedure was repeated at 37 weeks of postmenstrual age (PMA) in the preterm group. In the second year of life, all patients were invited to participate in follow-up outpatient visits. During these visits, they were assessed for the presence of AD on the basis of the questionnaire, anamnesis and physical examination results. The diagnosis of AD was made on the basis of the UK Working Party’s Diagnostic Criteria for Atopic Dermatitis [16]. Furthermore, blood was collected for the assessment of Th cytokine levels, and ultrasonographic examination of the thymus was conducted once again (Figure 1).
Thymus ultrasonographic measurements
Ultrasonographic measurement of the thymus was performed by a trained sonographer with a portable digital colour Doppler ultrasound system S2 (SonoScape, Shenzhen, China) and a linear probe. The size of the thymus was assessed via the thymic index (Ti) [17], i.e., the longest transverse dimension multiplied by the area of the sagittal cross-section of the larger lobe. Sonographic examination was performed twice by one sonographer. To assess the thymus size-to-weight ratio, the thymus/weight index (cm3/kg) (TWi) was calculated by dividing Ti by weight.
Th1/Th2/Th17 cytokine profile measurements
For the research tests, blood samples were taken and collected in tubes with ethylenediaminetetraacetic acid (EDTA). Peripheral blood mononuclear cells (PBMCs) were isolated from collected blood by using density gradient centrifugation via Pancoll human separating solution (PAN-Biotech GmbH, Aidenbach, Germany). The separated cells were washed and resuspended in RPMI 1640 medium (Biowest) containing 10% FBS (Biowest). To stimulate the production of cytokines in the cells ex vivo, the cells were incubated for 24 h at 37°C as follows: 1) without mitogens (control); 2) with mitogen phytohemagglutinin; and 3) with mitogen concanavalin A (Con A). The collected cell-free supernatants were stored at –80°C until analysis. The concentrations of cytokines (IL-2, IL-4, IL-6, IL-10, IL-17A, IFN-γ, and TNF-α) in the collected supernatants were determined via a CBA Human Th1/Th2/Th17 Kit (BD Biosciences, Franklin Lakes, New Jersey, United States of America), and data were acquired via a FACSCanto flow cytometer. The localization of CBA beads was discriminated in the FL-4 and FL-5 channels, while the concentration of specified cytokines was determined according to the intensity of FL-2 fluorescence via the respective standard reference curve and FCAP Array software (BD Biosciences). The obtained results are expressed in pg/ml.
Statistical analysis
Statistical analysis was performed via IBM SPSS Statistics software, version 29.0.2.0 (20), and G*Power, version 3.1.9.6. The results are presented as descriptive statistics, such as median values with interquartile ranges (IQRs) or mean values with standard deviations (SDs) for continuous variables and numbers with percentages for categorical variables. Statistical significance was set at a p-value < 0.05. The Shapiro-Wilk test was used to confirm the normal distribution of continuous variables. Odds ratios were calculated to compare the groups according to the presence of AD. For other parameters, the groups were compared via the χ2 test, independent samples t test, Mann-Whitney U test, Wilcoxon signed-rank test and Friedman test. Correlations between the values were calculated via Spearman’s rank correlation coefficient (rs ).
Ethical approval
Written, informed, formal consent was obtained from all the legal guardians of the patients. The study was performed in accordance with the Helsinki Declaration of 1975, as revised in 2000, and was approved by the Ethics Committee of the local university (permission number 1072.6120.98.2019).
Results
Study population
Among the 47 included children, 30 patients (18 preterm children and 12 term children) participated in the follow-up visit in the second year of life, and an ultrasound of the thymus was performed. Blood tests to determine cytokine levels were performed for 26 of the 30 children due to technical reasons or a lack of parental consent. The characteristics of the investigated children are shown in Table 1. The preterm and term groups differed in terms of gestational age, birth weight, length of NICU stay, parenteral nutrition status, the presence of Staphylococcus in microbiological culture and history of parental allergic disease other than AD. However, there were no significant differences between the groups in terms of other allergic disease risk factors, such as the breastfeeding period, pollution, cigarette smoke and dust mite exposure, or parental history of AD.
Table 1
Characteristics of the patients who participated in the follow-up visit. Car pollution exposure was assessed as household distance from a high-velocity road: standardized in grades 1–4, where 1: < 10 m, 2: 10–200 m, 3: 200 m–1 km, 4: > 1 km). Household dust mites presence was standardized in grades 1–6 according to the frequency of household dust cleaning, where 1: every day, 2: every 2 days, 3: every 3 days, 4: once per week, 5: 2-3 times per month, 6: once per month or less. Pregnancy emotional stress intensity was assessed subjectively by the mother in grades 1–10, where 1: no stress, 10: the greatest imaginable stress. Duration of breastfeeding was standardized in grades 1–6, where: 1: no breastfeeding, 2: less than a month, 3: between 1 and 3 months, 4: between 3 and 6 months, 5: between 6 months and 1 year, 6: more than 1 year. Gluten introduction was standardized in grades 1–4, where 1: first gluten introduction at the age of less than 3 months, 2: between 3 and 5 months, 3: between 5 and 7 months, 4: more than 7 months
AD diagnosis
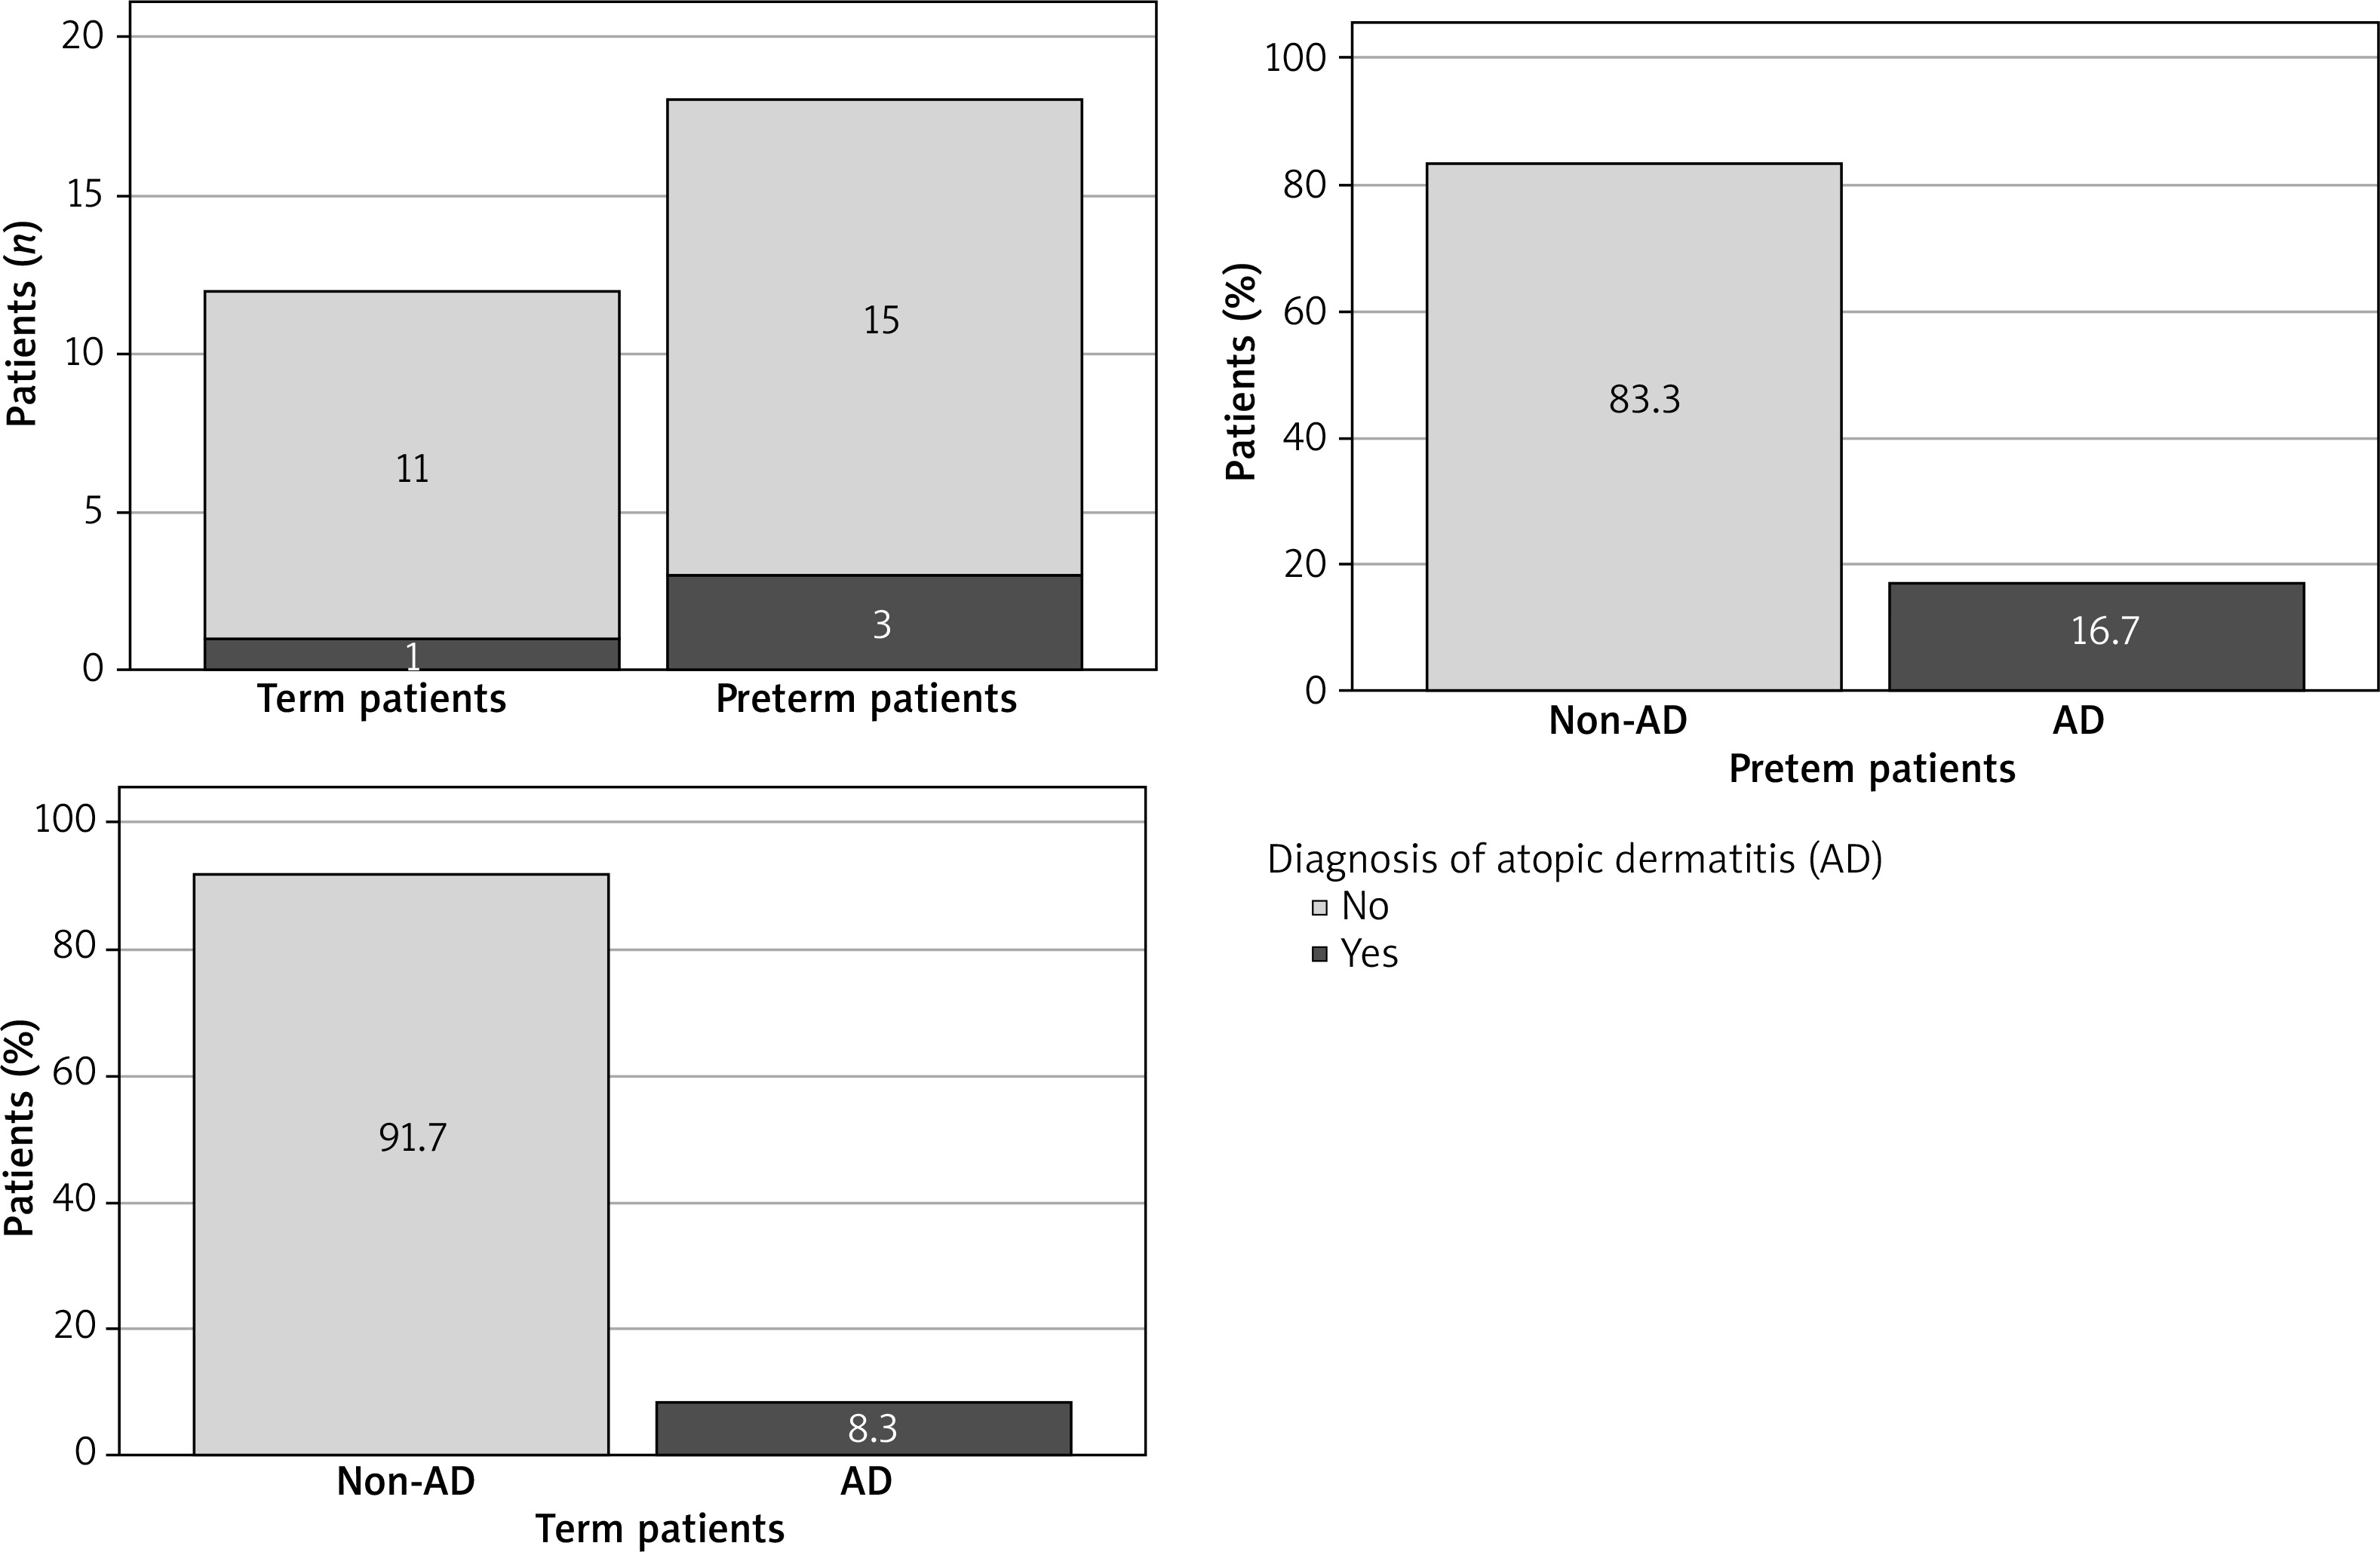
During the follow-up visit, AD was diagnosed in 3 out of 18 (16.7%) preterm children and 1 out of 12 (8.3%) term children. The odds ratio was calculated to assess the association between AD and prematurity (Table 2, Figure 2). In our study, preterm infants were more than two times more likely to develop AD (OR = 2.2; 95% CI: 0.201–24.086); however, this result did not reach statistical significance. The percentage difference between AD-positive preterm and term children was 8.4% (95% CI: -15.1–31.9%).
Thymus ultrasound assessment
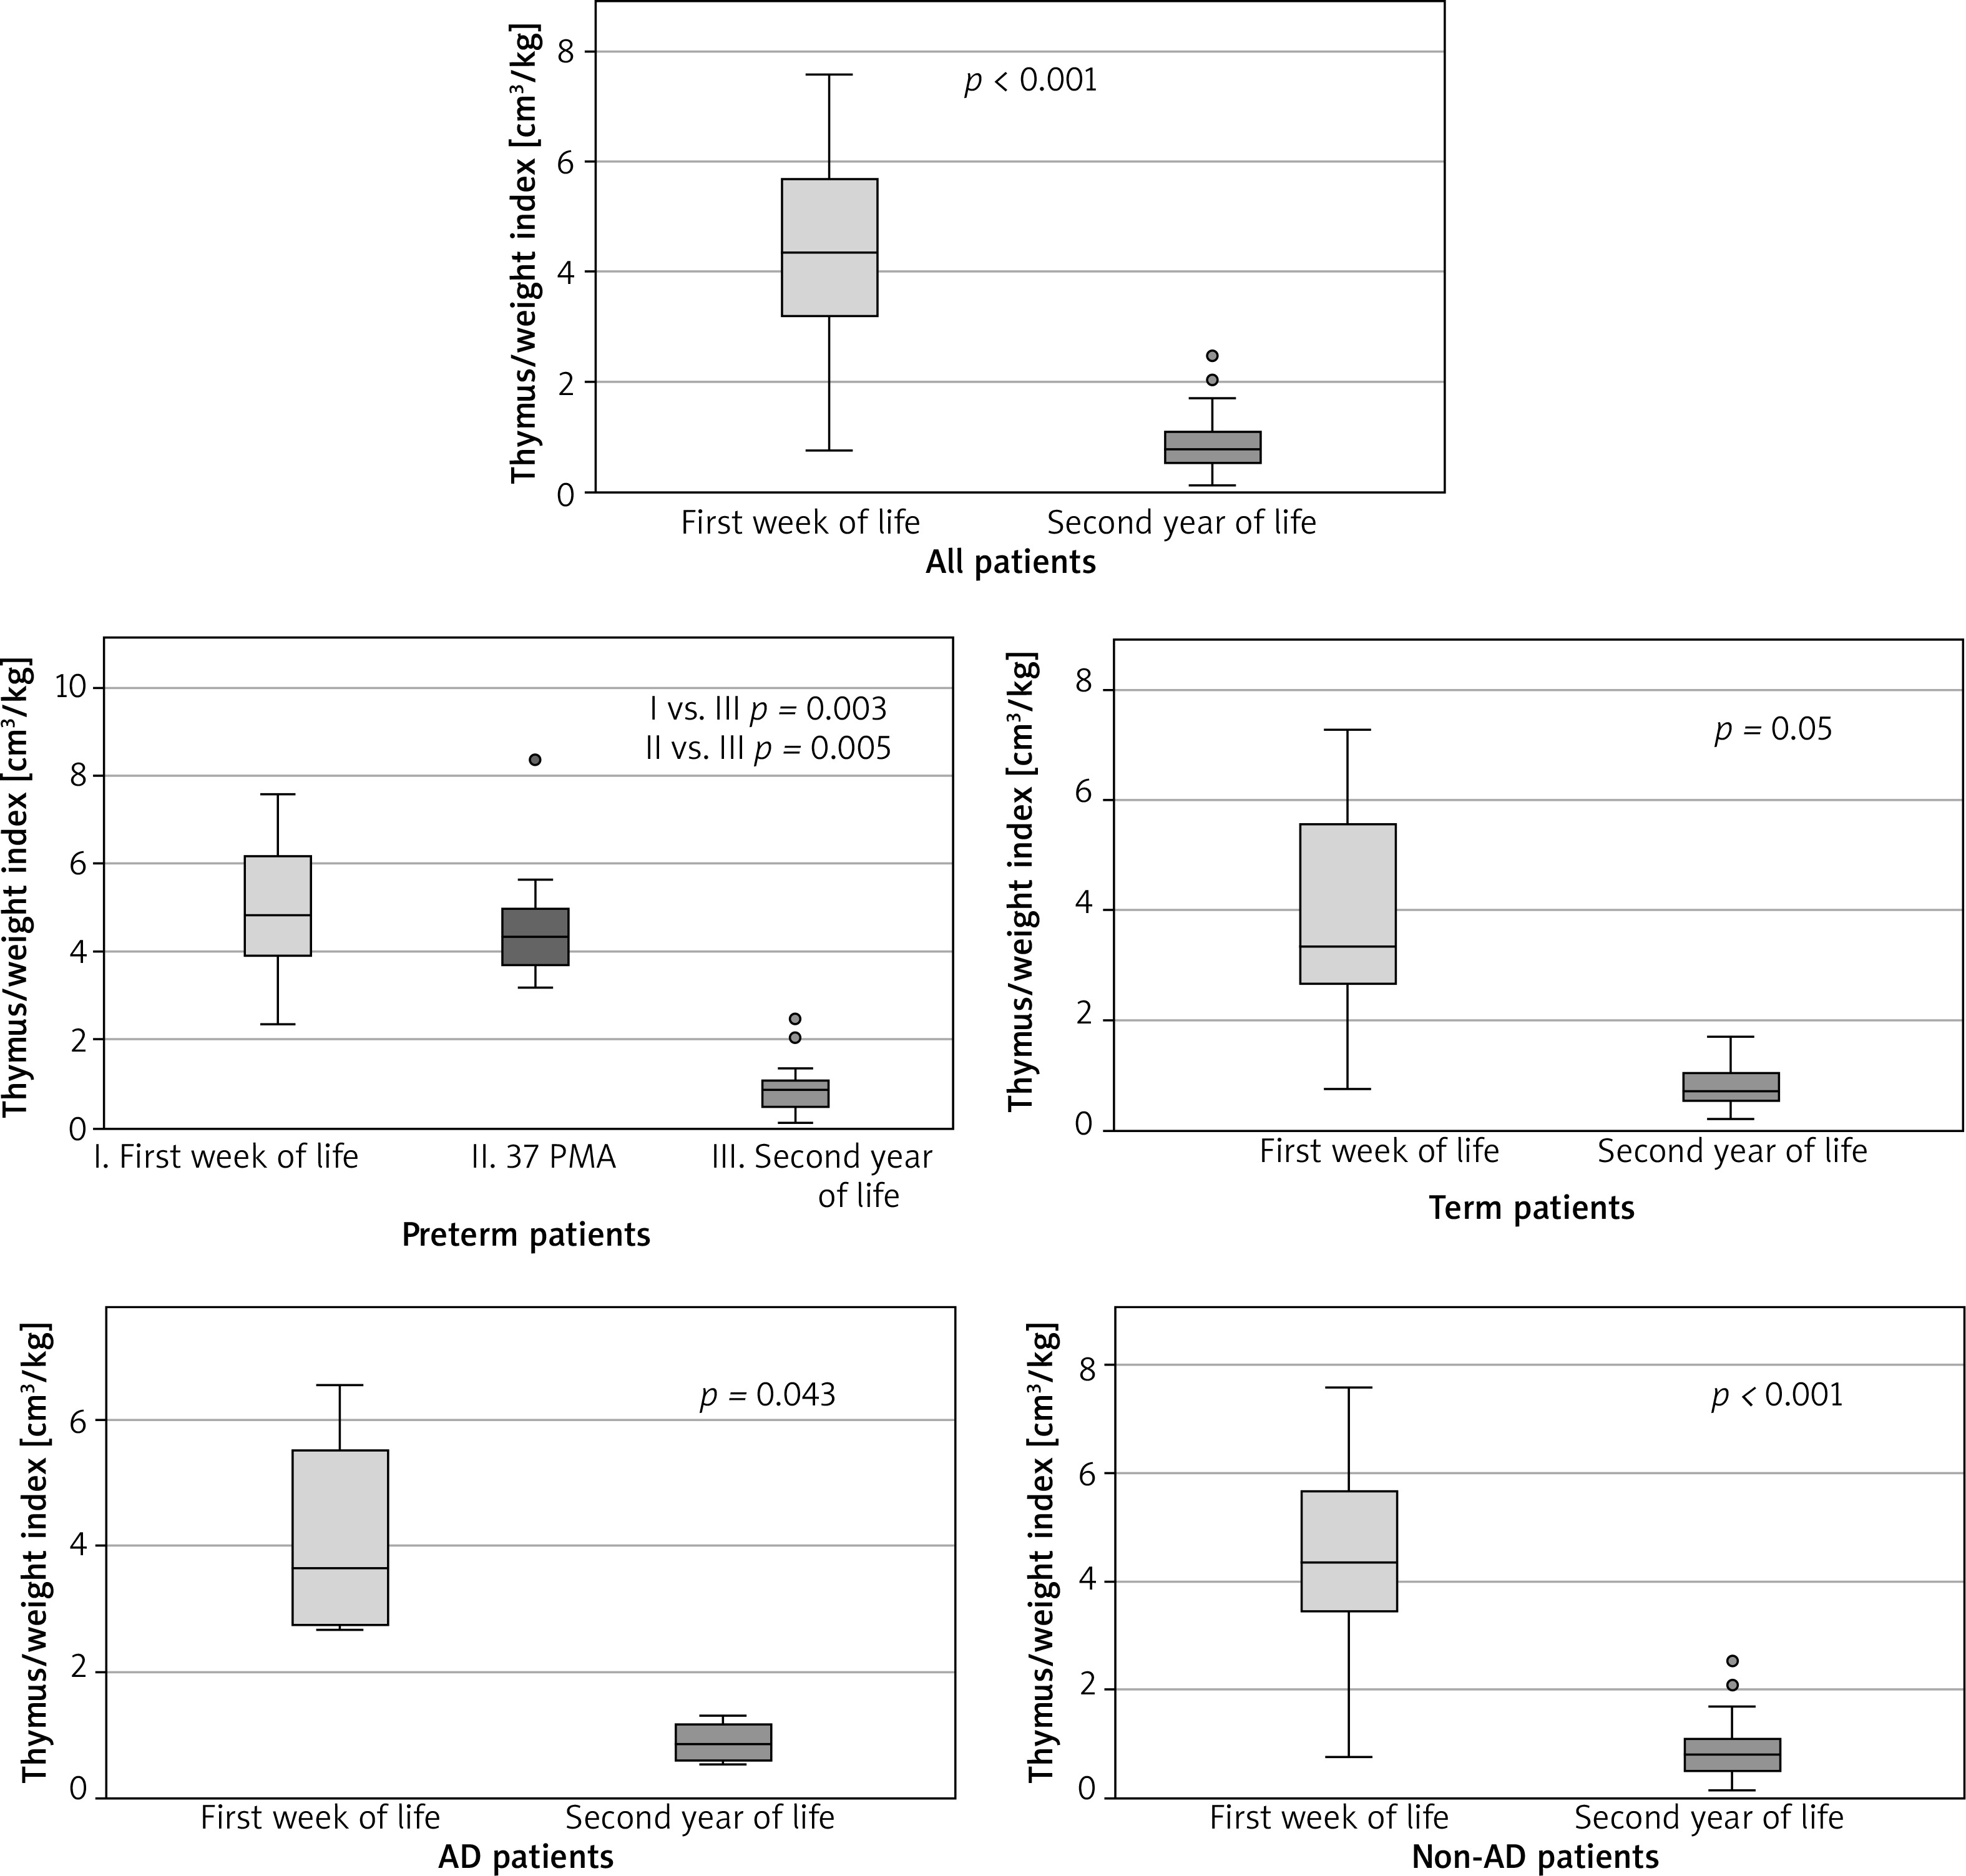
There were no statistically significant differences in the thymic index or thymus/weight index in the second year of life between preterm and term children or between children with and without AD (Supplementary material 1). The thymus/weight index was lower in the second year of life than after birth in the whole study population and within all the investigated subgroups (Figure 3).
Th1/Th2/Th17 cytokine assessment
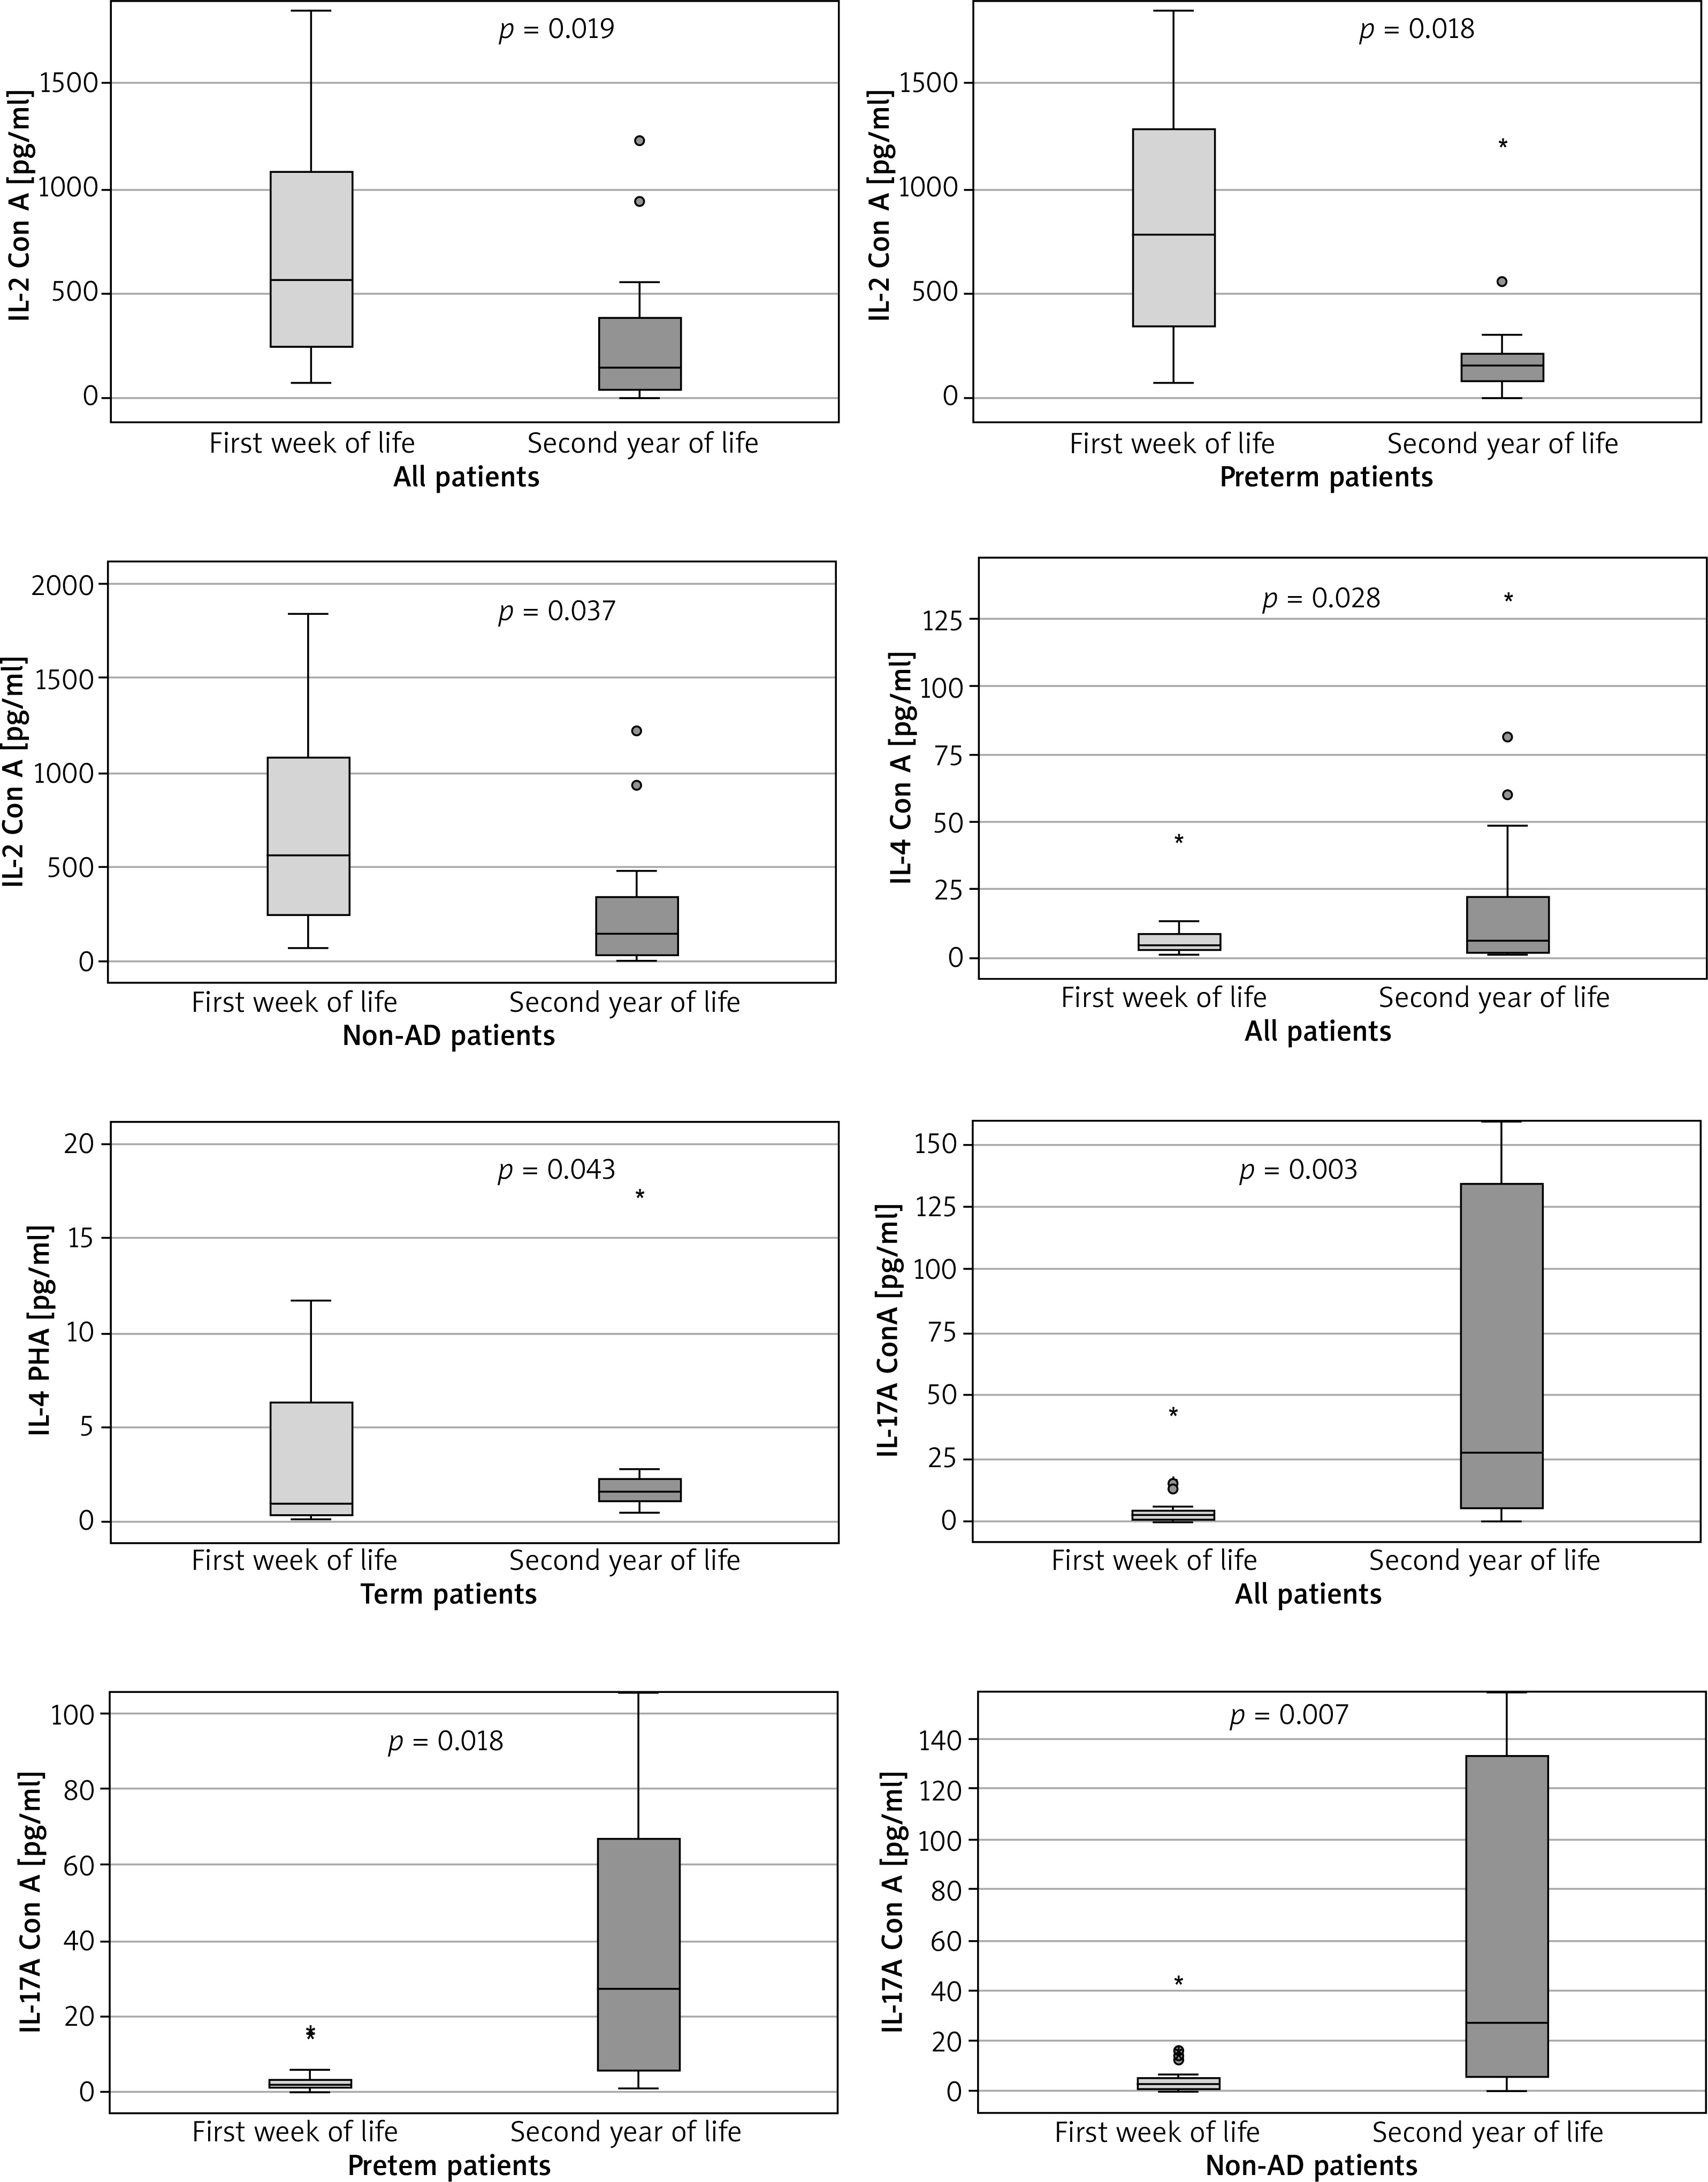
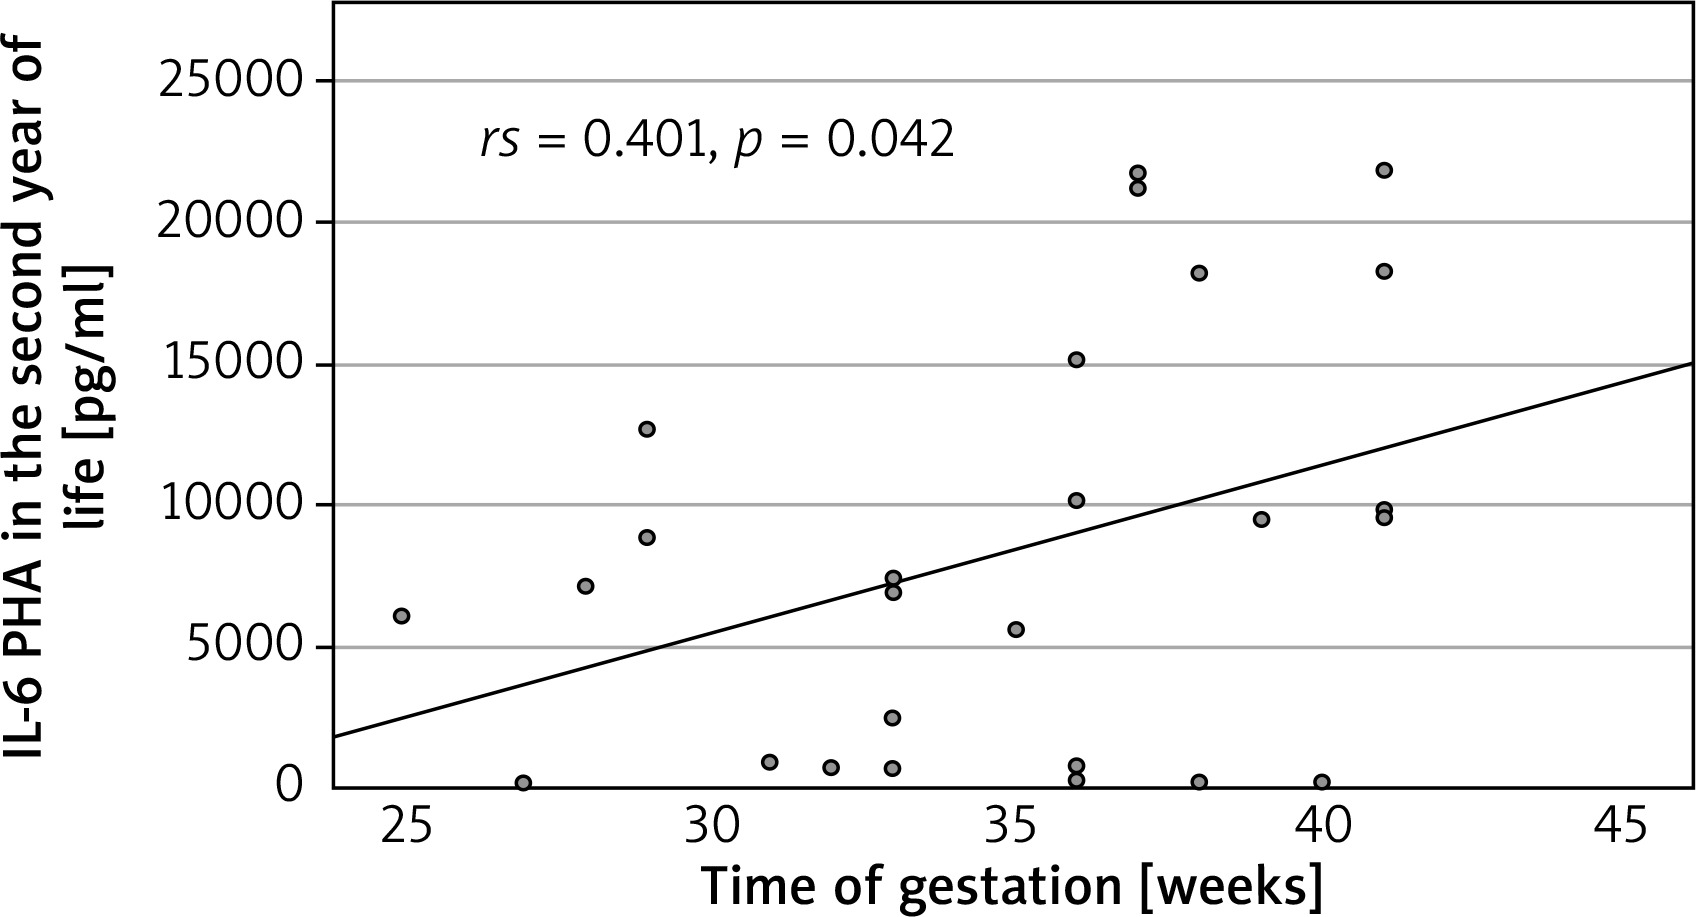
We found a significant decrease in the level of IL-2 in all patients and in the preterm and non-AD subgroups in the second year of life vs. after birth. The IL-4 and IL-17 levels were greater for all patients, the IL-17 level was greater in the preterm and non-AD subgroups, and the IL-4 level was greater in the term subgroup (Figure 4) at the follow-up visit. The level of IL-6 was positively correlated with gestational age (rs = 0.41, p = 0.042) (Figure 4). There were no statistically significant differences in the levels of other investigated cytokines between the preterm and term groups or between the AD and non-AD groups (Supplementary material 2).
Discussion
The results of this study did not reveal a statistically significant difference in the odds ratio for developing AD between preterm and term children. Previous studies have shown that preterm children are less likely to develop AD, which was first mentioned by Barbarot et al. [7] and other authors. A summary of the possible reasons for this association was presented in a review elsewhere [8] and in a meta-analysis by Zhu et al. [6]. Additionally, according to the most recent publication by Gerner et al. [18], AD was observed in 21.2% of children during the first year of life and was more common in term children than in preterm children, with a younger age and more severe disease at onset. Similar findings were reported in a study by Pagano et al. [19], in which a gestational age < 29 weeks was a protective factor against AD, and by Wong et al. [20]. Nagasaki et al. did not find a significant connection between these factors [21]. The lack of an association between AD and prematurity may be a result of the small number of patients included in our study. This is an important limitation of this study. However, this association has already been reported in studies of larger populations, and this pilot study focused mainly on the assessment of the immunological profile of patients, which is discussed below. What is more, a fact that in the preterm group, parents suffered more often from allergic diseases other than AD, than in the term group (61.1% vs. 16.7 %, p = 0.024; Table 1) can possibly be an important confounding factor in the study. In a meta-analysis by Ravn et al. [22] it was clearly shown than having a parent with atopic disease other than AD (for example asthma, allergic rhinitis) is associated with a greater risk of AD in offspring. The effect size is not as large as in the case of parental AD, but still significant. Further research on larger populations in the future is recommended, which could reduce the confidence interval of the percentage difference between the groups and reduce the impact of the confounding factors on the results.
In the present study, we observed a significant decrease in the level of IL-2 between the first week of life and the second year of life in the whole study group, preterm subgroup and non-AD subgroup. However, this phenomenon was not present in the subgroup of term children. There was no difference in IL-2 levels measured in the second year of life between the term and preterm subgroups or between the AD and non-AD subgroups. This finding is consistent with our previous findings that the IL-2 level after birth is inversely correlated with gestational age (own, unpublished data). IL-2 has many functions in the human body and is associated with mechanisms that counteract AD. IL-2 reduces the expression of IL-17 and the function and differentiation of Th17 cells via the STAT5 metabolic pathway. Moreover, it promotes Th1 cell differentiation through various mechanisms [10, 23, 24]. In a study by Krupka-Olek et al. [25], adult patients with AD had significantly lower levels of IL-2 than healthy controls did. We hypothesize that a higher level of IL-2 in the preterm group after birth may be a protective factor against AD, causing a prolonged change in immunological development, which is no longer observed in the second year of life; however, this hypothesis needs further research.
The study also revealed increased IL-17A levels in the second year of life compared with the first week of life in all patients and in the preterm, term and non-AD subgroups. There were no statistically significant differences in this parameter between term and preterm patients or between AD patients and non-AD patients in the second year of life. IL-17A has already been shown to be an essential factor in the development of atopic diseases, i.e., AD; however, its particular role has not yet been fully defined [26]. It has been shown that AD patients have higher levels of IL-17 than healthy controls do, and this level is also positively correlated with the intensity of skin changes [27]. The lack of difference in IL-17 levels in the second year of life between the groups in our study may indicate that IL-17 does not play a crucial role in diversifying the risk of AD in preterm and term children. The increase in IL-17 levels in the second year of life is likely the outcome of further development of the immunological system and greater exposure to antigens than immediately after birth. The same situation may be the case for IL-4 levels, which were also higher in our study in the second year of life than after birth in the whole study group and in the term subgroup. IL-4 is a known mediator of the Th2 reaction and sensitization process, leading to atopy [28].
In the present study, we also observed a positive correlation between the IL-6 level in the second year of life and the gestational week at birth. In our previous research, the IL-6 level was negatively correlated with birth weight in the preterm group (unpublished data). This discrepancy may be a result of other inflammatory conditions as IL-6 is a known acute phase protein, or of various roles that IL-6 may play in atopic diseases. On the one hand, IL-6 inhibits Treg cell formation induced by TGF-β and promotes the differentiation of Th17 cells from naive T cells. These two processes may be related to the development of AD. In a study by Krupka-Olek et al. [29], the levels of IL-6 were greater in adult patients with AD than in healthy controls. On the other hand, IL-6 was also shown to prevent Th2 cell polarization, which is widely associated with AD, by promoting SOCS3-dependent suppression of IL-2 signalling [30].
The thymus is a crucial organ for immunological system development. It has already been suggested that changes in thymus size in the early life period may be connected to the risk of atopy, including atopic dermatitis, by affecting the Th1/Th2 balance [7, 31]. Thyssen et al. also showed that children who underwent thymectomy had a lower risk of AD [32] and that children with AD had a higher thymic index than healthy controls did [33]. Our study also included an analysis of the thymic index and the thymus/weight index. We found no differences in these parameters between the preterm and term subgroups or between the AD and non-AD subgroups in the second year of life. However, we observed a trend toward a reduction in the thymus/weight index in the second year of life in comparison to the first week of life in the whole study group. Interestingly, the thymic index did not change with age, indicating that the size of the thymus remained relatively constant, despite the growth of the body during the first 2 years of life. Interestingly, Yekeler et al. [34] reported that, according to thymic index analysis, the thymus grows during the first 4 to 6 months and then shrinks gradually in 6–8 months of life. However, their study, in comparison with our study, did not assess the size of the thymus in a prospective way and included only healthy infants. In our previous study (unpublished data), we reported that preterm patients tended to have a larger thymus at birth than term children did. Moreover, the gestational week at birth was negatively correlated with the TWi at birth. According to the results presented above, the TWi in the 2 groups appeared to become more similar during the first two years of life. We hypothesize that this specific “catch-up” phenomenon in the preterm and term subgroups may be a sign of an imbalance in the neonatal period that impacts the immunological development of preterm infants throughout the first 2 years of life. However, the impact of this imbalance on AD development remains unclear.
The main advantage of this study is the comprehensive prospective analysis of immunological and neonatal factors that may be associated with the development of AD. Another strength is the methodology of cytokine analysis, with ex vivo cell stimulation in full blood samples. This method ensures that most of the results were significantly above the detection level. The main limitations are the relatively high morbidity in term patients and the small number of investigated patients.
There are several main conclusions that can be drawn on the basis of the presented results. There was no statistically significant difference between the odds ratios for developing AD in preterm and term children. There was no difference in Th1/Th2/Th17 cytokine levels measured in the second year of life between the term and preterm groups and the AD and non-AD subgroups. We observed a significant decrease in the level of IL-2 and increases in the levels of IL-17A and IL-4 between the first week of life and the second year of life in the whole study group. We also observed a positive correlation between the IL-6 level in the second year of life and the gestational week at birth and a trend toward a decrease in the thymus/weight index in the second year of life in comparison to the first week of life in the whole study group.


