
Introduction
The pathomechanism of atopic dermatitis (AD) is very complex and not fully explained [1]. It is widely considered that allergy to aeroallergens in adults is one of the important factors that may provoke the development of AD in genetically predisposed individuals [2].
Skin prick tests (SPT) are the gold standard in the assessment of sensitization to protein allergens [3]. Positive results are connected with the presence of specific IgE (sIgE) overlying mast cells. They are obtained after 20 min by comparing the average diameters of allergenic and control-histamine wheals [4]. According to Hanifin and Rajka’s criteria, they are among the minor diagnostic features of AD [5].
SPT technique has got a lot of limitations and the result can be influenced by various technical and biological factors [6]. It is not applicable to children up to 5 years old and adults over 70 years old. Although the use of a special knife is recommended to standardize the technology, the depth of allergen insertion is difficult to repeat. The reading of the result is subjective and depends on the doctor’s experience. Its result is not only affected by the irritation of nerve fibers and the release of various inflammatory mediators, specific differences in the number of mast cells in the skin of individual patients, the subjective ability to bind their high-affinity IgE receptor (FcεR1) to the tested allergen, the content of mediators in granules and the individual ability of mast cells to degranulate, but it also depends on sex [7].
Moreover, AD is characterized by disorders in the mechanical, chemical and immunological parts of the skin barrier even in seemingly unchanged skin [8, 9]. In addition, the use of oral and local immunosuppression deepens the barrier dysfunction. A significant percentage of patients receive anti-histamines. Their withdrawal before the test intensifies scratching, which additionally damages the epidermis in a mechanical way.
Insertion of an allergen can cause either a strong anaphylactic reaction and, consequently, even the patient’s death, or an extensive local reaction and occurrence of urticaria, and/or aggravation of AD and atopic respiratory track diseases [10].
Another method of assessing presence of specific IgE antibodies to protein allergens is to examine their concentration in the patient’s serum [11]. The principle of this method is based on the fluoro-immunoenzymatic reaction. The reading is made by means of a fluorimeter, which is completely automatic and objective [12]. The sIgE serum concentration is devoid of any limitations which should be applied to SPT. Therefore, it appears to be an alternative technique in testing AD patients.
Aim
The assessment of clinical usefulness of the allergy to aeroallergens tests in AD patients through: a) Quantitative and qualitative evaluation of the results obtained by SPT and sIgE serum concentrations; and b) The correlation of the results with selected clinical and laboratory parameters.
Material and methods
The study consisted of 286 AD patients (147 men and 139 women) aged from 16 to 60 (mean: 24 years old) during exacerbation or partial remission of skin lesions. No coexistence of other general and local disease that could affect the results was found. The diagnosis was based on the classification of Hanifin and Rajka [13]. The characteristics of the examined group are presented in Table 1.
Table 1
The characteristics of 286 AD patients
Atopic bronchial asthma and allergic rhinitis (seasonal and perennial) in the patients were diagnosed in pulmonological and laryngological allergy centres. The severity of pruritus was rated according to the subjective analogous ten-point scale: 1 point means very weak and 10 points – very strong pruritus [14], taking the score ≥ 5 points as intensive itching. The extent of skin lesions at the time of disease exacerbations was based on the interview using Wallace’s method of so-called “The Rule of 9s” [15]. In the period of exacerbation, > 50% of the affected body surface area was considered as an extensive change.
Coexistence of AD with at least two of four features, like atopic asthma, allergic rhinitis, extensive skin lesions during exacerbations and severe pruritus, was assumed as a severe course of the disease (AD-Index ≥ 2) (Table 1).
Total IgE concentration was evaluated using ELISA method with the fluorimeter UniCAP (Pharmacia, Sweden). The values above 100 IU/ml were considered as increased. Evaluation of specific IgE serum concentrations ofantibodies to 14 aeroallergens (Table 2) was performed with the same system and the results are presented in kUA/l. The results are considered negative if the values are ≤ 0.69 kUA/l, positive for 0.7–17.7 kUA/l and high positive for > 17.7 kUA/l [16].
Table 2
The incidence of positive and high positive results of specific IgE antibodies to individual aeroallergens tested on patients with AD (n = 286)
SPT was performed on an unchanged forearm skin in a routine manner with solutions of 17 aeroallergens using Allergopharma kits (Table 3). A negative result has been considered when the post-allergenic reaction equals the negative control reaction or the average diameter of the post-allergenic wheal is bigger than the negative control fluid reaction but smaller than a half of the average wheal diameter after histamine.
Table 3
The incidence of positive and high positive SPT results with extracts of individual aeroallergens tested on AD patients (n = 286)
Positive results have been assumed when: a) the average diameter of the post-allergenic wheal is equal, is bigger than a half or almost equals the average wheal diameter after histamine; b) the average diameter of the post-allergenic wheal equals or is not bigger than twice the average diameter of the wheal after histamine.
A high positive result has been considered either when the average diameter of the post-allergenic wheal is at least twice bigger than the average wheal diameter after histamine or when there is any reaction with pseudopods.
The project was approved by the local Ethics Committee.
Statistical analysis
The frequency table method was used to describe qualitative variables, and a typical measure of position (like mean, median) and variability (like standard deviation) were used to describe quantitative variables. For selected pairs of variables, correlations were examined. The χ2 test with the Yates’ correction for small groups (n < 5) was used for testing relationships between categorical variables. The Spearman rank correlation method was used to measure the degree of the relationship between quantitative and order variables. For all statistical tests and correlation analysis, a standard significance level of p-value threshold was assumed (p < 0.05). The prediction model, predicting AD-Index ≥ 2, was built using the CART decision tree method. This model has identified 4 groups of patients (using the entropy minimization criterion).
The test sensitivity (SE) was determined according to the formula WD/(WD + FN) and specificity (SP) according to the formula WN/(WN + FD). Positive predictive value (PPV) was determined according to the formula WD/(WD + FD) and negative predictive value (NPV) determined according to the formula WN/(WD + FN), where: WD – the number of patients with a severe course of the disease and positive results of the analysed test; FN – the number of patients with a severe course of the disease and negative results of the analysed test; WN – the number of patients with a mild disease course and negative results of the analysed test; FD – the number of patients with a mild course of the disease and positive results of the analysed test [17].
Results
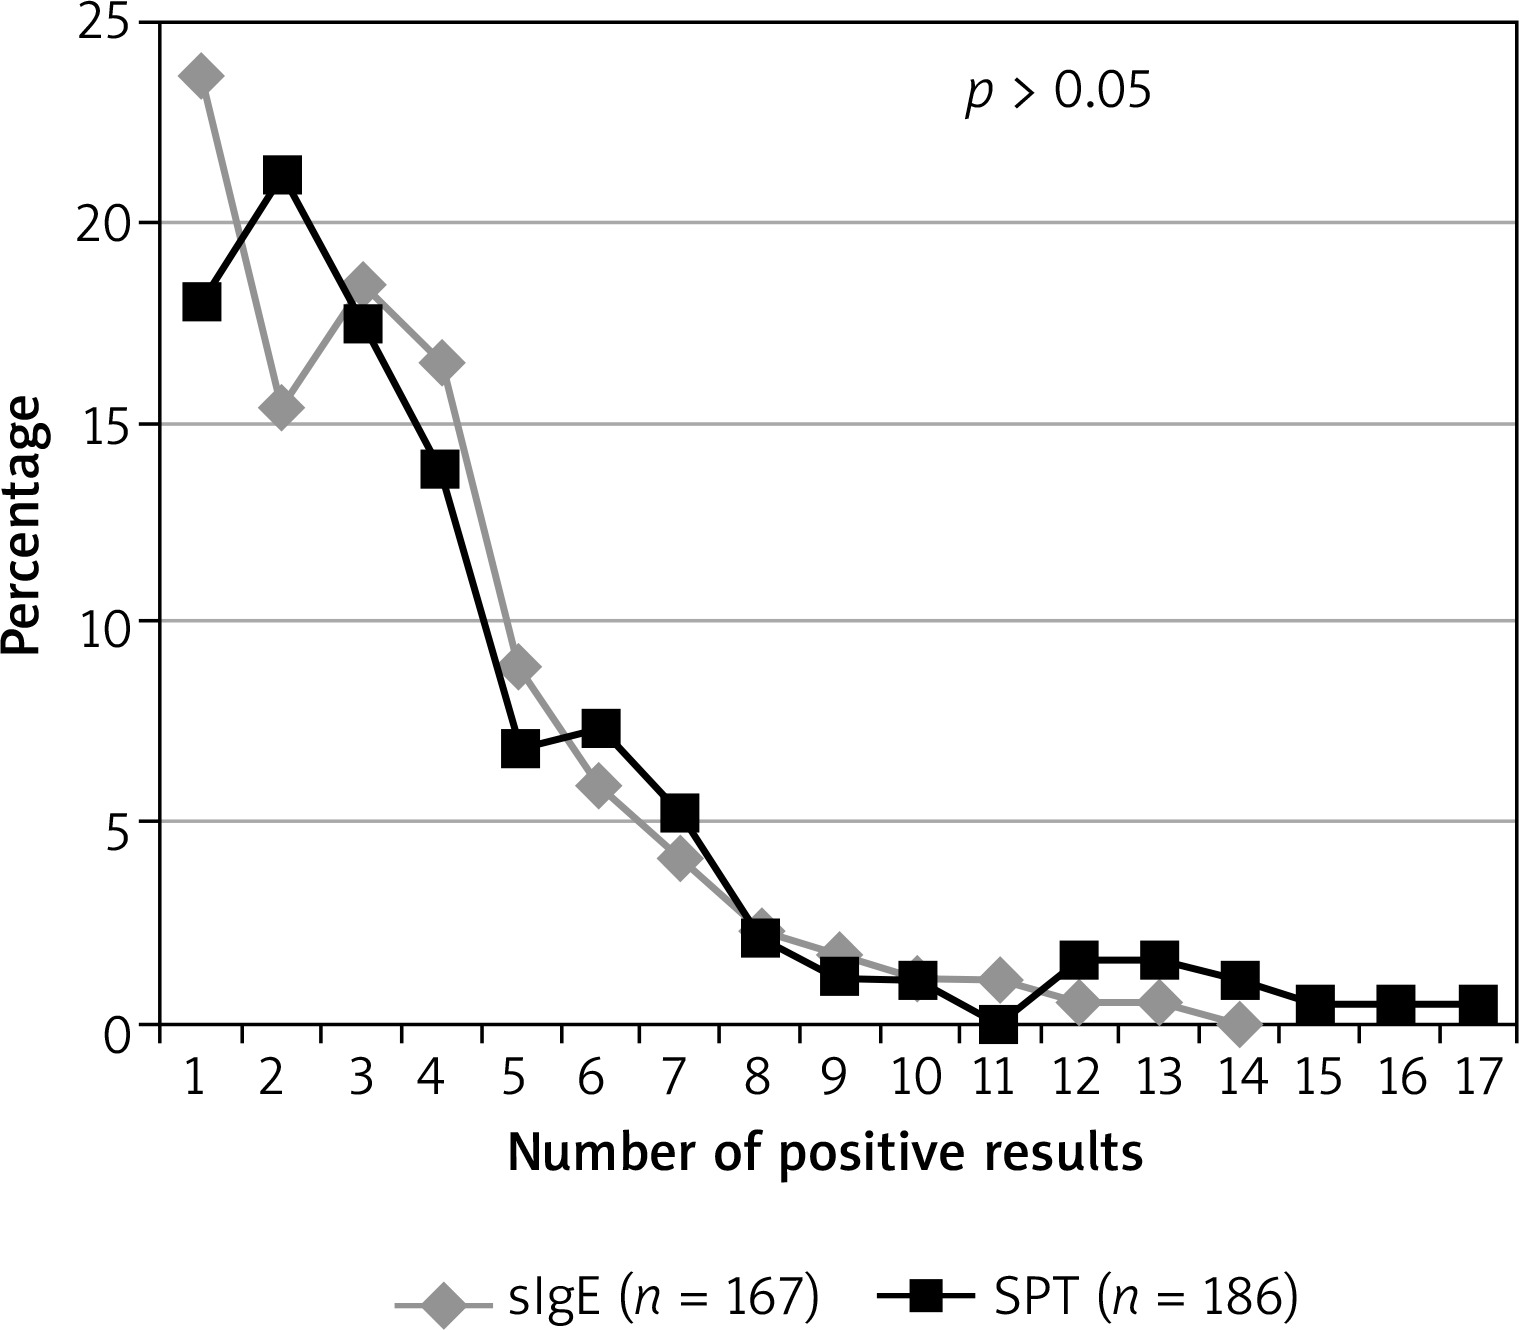
In 169 out of 286 (59.1%) patients, at least one sIgE positive result has been found. Among them 41.4% (70/169) have had at least one high positive result. In SPT results, these percentages have been 66.1% (189/286) and 46.3% (82/189), respectively. The differences between in vivo and in vitro methods have been statistically insignificant (p > 0.05). The frequency of positive results of specific IgE antibodies to the tested allergens ranged from 31.0% to 1.0% (Table 2) and for SPT – from 35.0% to 6.3% (Table 3). Positive results for at least two allergens have been observed in 86.4% of patients using the in vivo method and in 82.0% with the in vitro method (p > 0.05) (Figure 1).
Figure 1
The prevalence of positive SPT results with (solutions) extracts of individual aeroallergens and specific IgE concentrations of antibodies to one and more than one allergen in patients with AD (n = 286)
In the group of patients with the positive results of sIgE, 89.3% have shown an elevated level of total IgE, and with the negative results of sIgE – 47.0% (p < 0.05). These percentages for SPT results have been similar and amounted to 82.5% and 51.5%, respectively (p < 0.05). The number of positive sIgE results as well as their intensity have positively correlated with total IgE concentration: rho = 0.588, p < 0.0001 and rho = 0.592, p < 0.0001, respectively. SPT correlation values have been calculated as rho = 0.248, p < 0.02 and rho = 0.256, p < 0.009, respectively.
The value of AD-Index has positively correlated with the number of sIgE positive results (rho = 0.343, p < 0.0001) and their intensity (rho = 0.358, p < 0.0001). This correlation has also been demonstrated for the number (rho = 0.170, p < 0.004) and intensity (rho = 0.183, p < 0.002) of positive SPT results.
On the basis of mathematical analysis of the summary intensity of sIgE test results and their number, the patients were divided into 4 groups – A, B, C and D.
In 150 subjects (group A), both the low summary intensity of sIgE test results (sIgE-Sum ≤ 1) and a low number of them (sIgE-number ≤ 1) have been detected. In this group, 79% had a mild course of AD (AD-Index < 2) and 21% – a severe one (AD-Index ≥ 2), p <0.000 (Figure 2 A).
Figure 2
The incidence of severe AD in relation to the proportion between the summary intensity of the test results and their number for the specific IgE concentrations of antibodies to aeroallergens
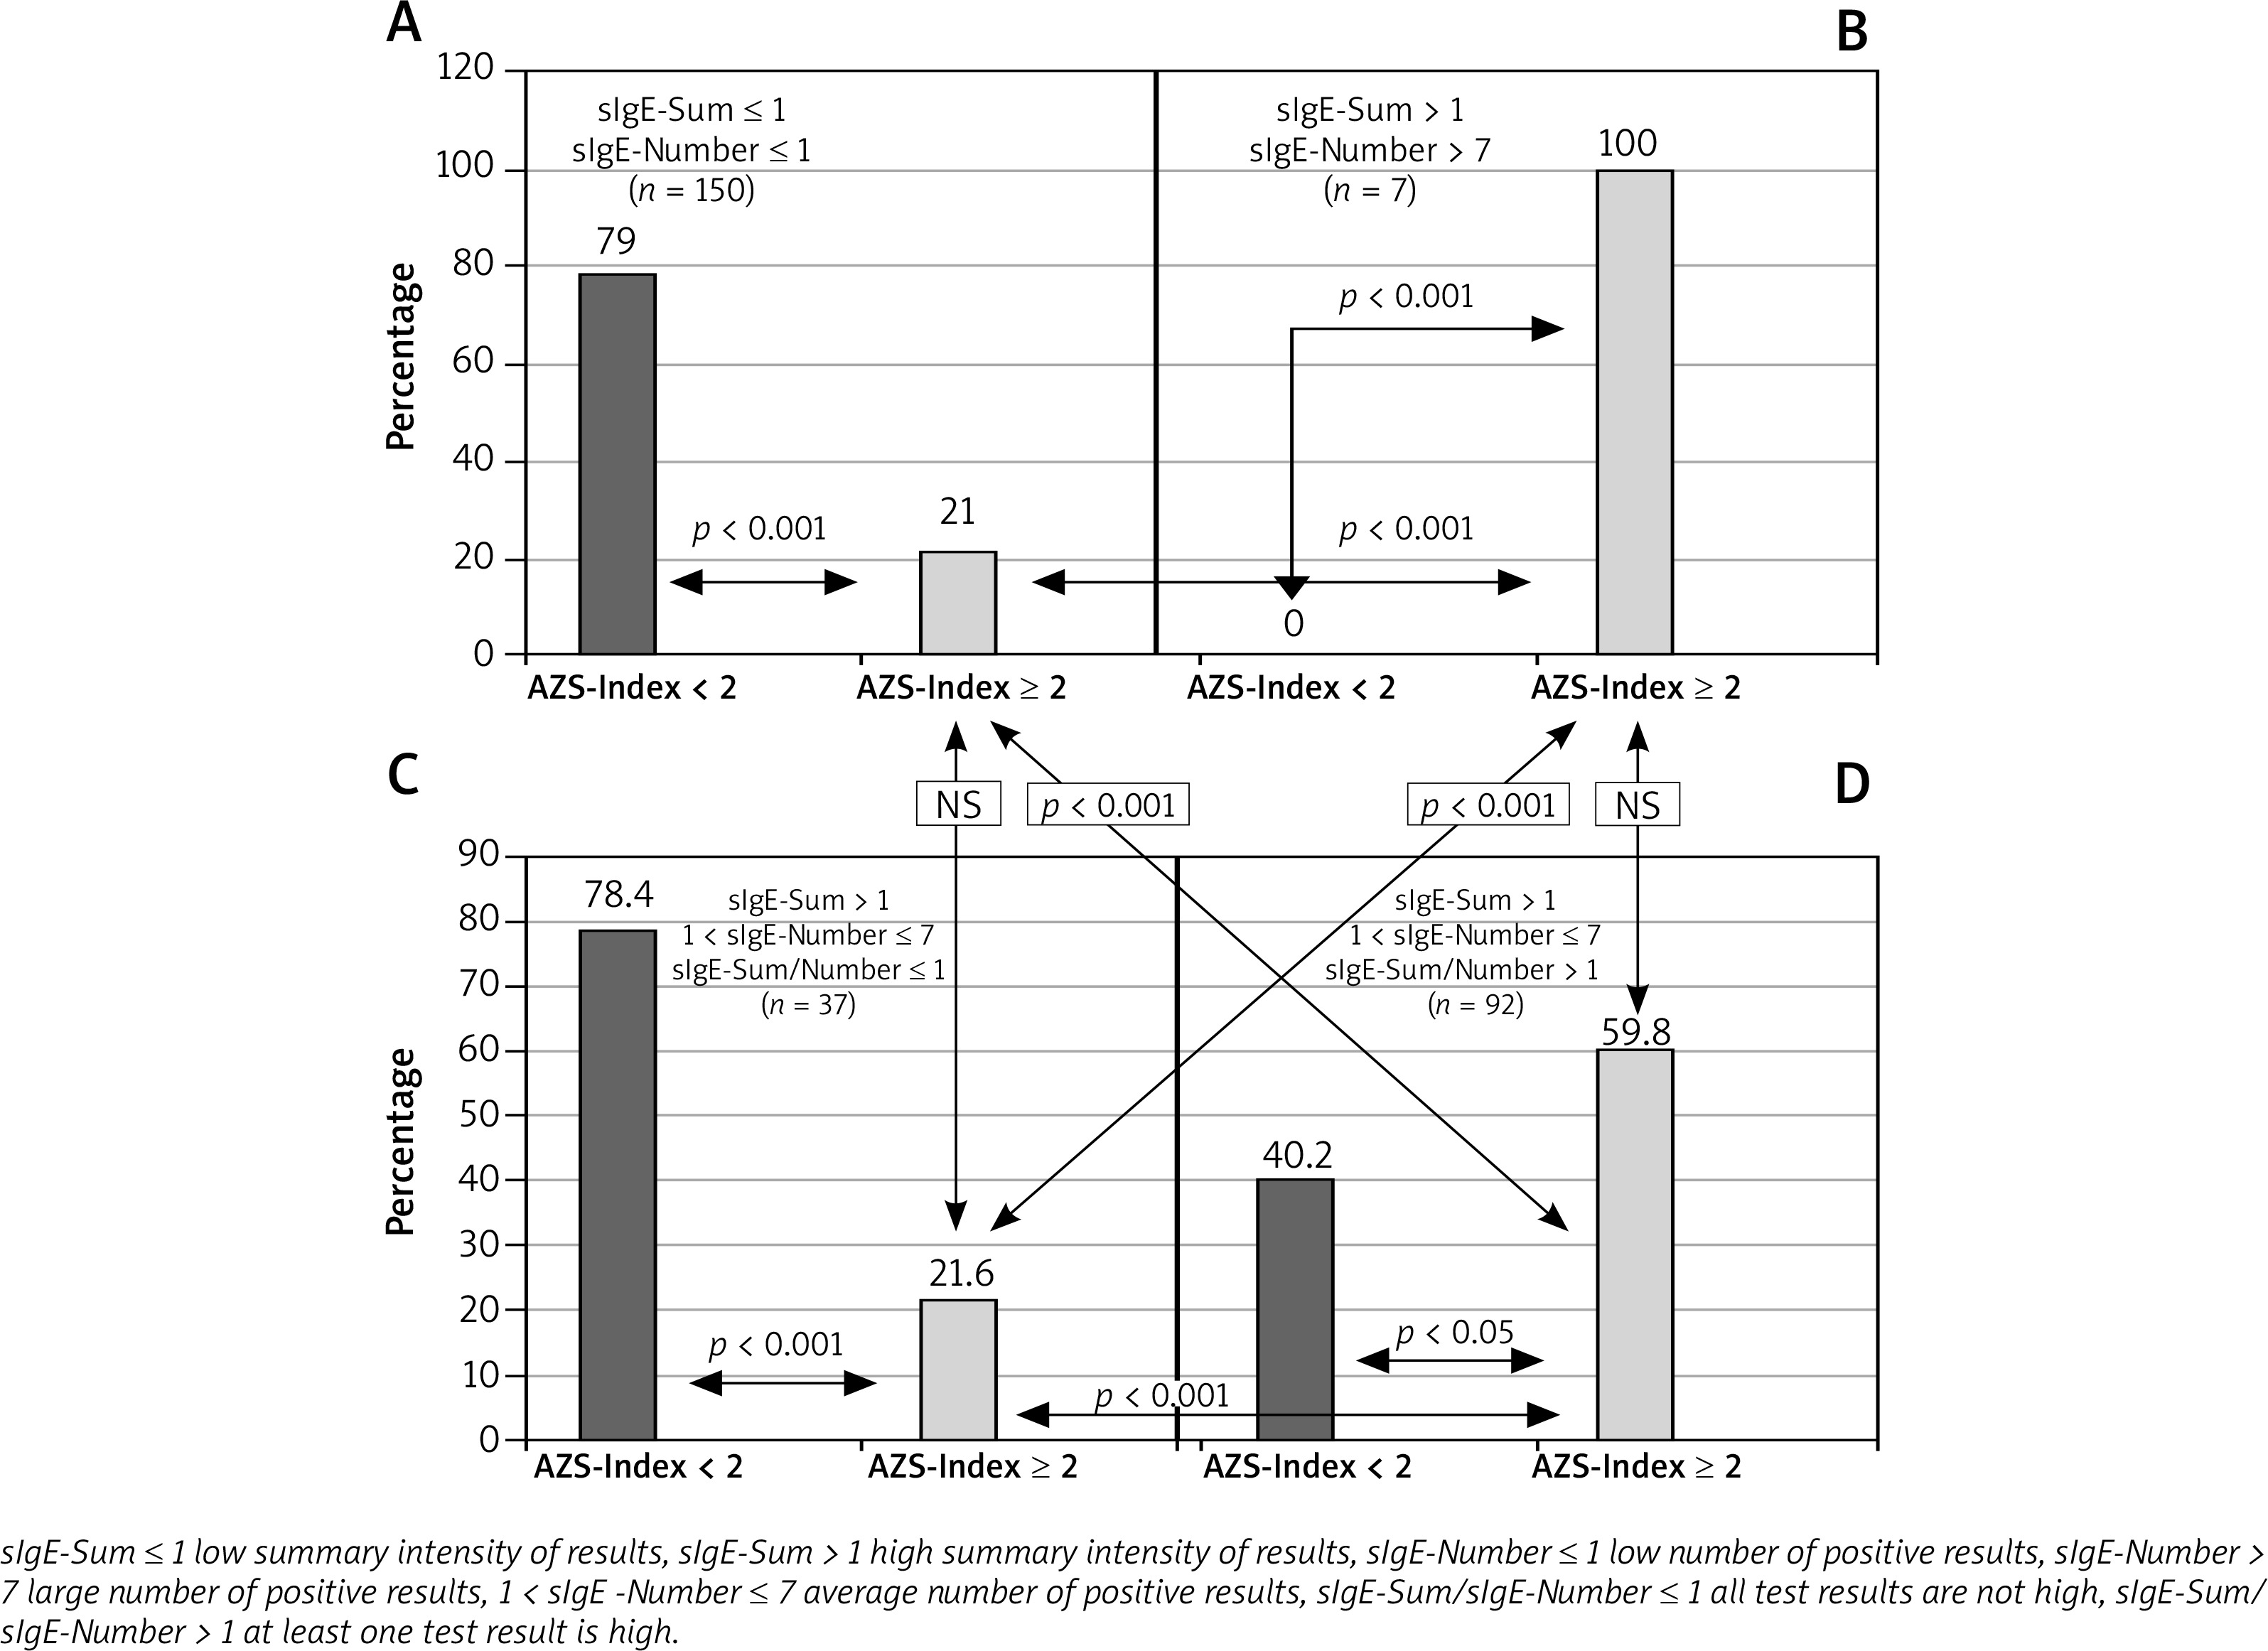
In 7 subjects (group B), the large summary intensity of sIgE test results (sIgE-Sum > 1) and a large number of them (sIgE-Number > 7) have been found. In all cases (100%), the course of the disease was severe (AD-Index ≥ 2), p < 0.001 (Figure 2 B).
In 37 patients (group C), the summary intensity of sIgE test results has been high (sIgE-Sum > 1), their number – average (1 < sIgE-Number ≤ 7) and all the results have not been high positive (sIgE-Sum/sIgE-Number ≤ 1). In this group, 78.4% of patients had a mild course of AD (AD-Index < 2) and 21.6% – a severe one (AD-Index ≥ 2, p < 0.001) (Figure 2 C).
In the remaining 92 patients (group D), the summary intensity of sIgE test results has been high (sIgE-Sum > 1), their number – average (1 < sIgE-Number ≤ 7) and at least one result has been high positive (sIgE-Sum/sIgE-Number > 1). In this group, a severe AD course was determined in 59.8% of patients, (AD-index ≥ 2) and a mild one – in 42.4% (AD-Index < 2) p < 0.05 (Figure 2 D).
Statistically significant differences in the prevalence of severe AD patients have been stated between groups A and B (21 vs. 100%, p < 0.0001), A and D (21 vs. 59.8%, p < 0.0001), B and C (100 vs. 21.6%, p < 0.04) and C and D (21.6 vs. 59.8%, p < 0.001). There have been no statistically significant differences in the incidence of severe patients between groups A and C, B and D (Figures 2 A–D).
The sensitivity and specificity of the clinical classification of the patients with atopic dermatitis based on the presence of high positive results of specific IgE antibodies to aeroallergens are 62.6% and 79.1%, respectively. PPV and NPV values for this qualification are 61.0% and 80.0%, respectively.
Discussion
The two diagnostic methods used in our research have shown positive results in the majority of respondents in a similar percentage. The confirmed allergies were polyvalent and mainly related to 3 allergens – house dust mites, grass pollen and cat hair.
Our own observations are consistent with other researchers’ results [18–20] and confirm that the presence of specific class E antibodies to aeroallergens is a hallmark of adult AD patients. The diagnostic methods used in vitro and in vivo, although different from a biological point of view [21–23] can be used interchangeably in AD patients.
The results of our own research confirmed the observations of others [24] that the presence of specific IgE antibodies circulating and covering mast cells correlates with total IgE concentration. Therefore, people with elevated levels of this immunoglobulin should be tested for allergy in the first place. It has been noted that both diagnostic methods are characterized by high sensitivity but low specificity [25], which significantly limits their usefulness in an accurate definement of an AD-provoking factor. This can be explained by the fact that the pathomechanism of hypersensitivity to aeroallergens can be very diverse: either it is associated with I and/or IV allergic mechanism or it can be a reaction caused by irritation [26, 27].
In our study, an attempt has been made to analyse the usefulness of these test results as a possible prognostic marker in the clinical course of atopic eczema. Literature data indicate that the coexistence of AD with atopic asthma, allergic rhinitis, severe pruritus and extensive skin lesions during exacerbations has a significant impact on the severity of atopic dermatitis [28–32]. Therefore, the patient in our study was qualified to the group with severe AD when at least two of these four features coexisted.
The analysis of the relationship between the number of positive results and their intensity in both diagnostic methods and the classification of patients according to AD-Index has shown statistically significant, positive correlations. However, the strength of the correlations for SPT results, although statistically significant, has proved to be negligible (rho < 0.184) [33]. This indicates the fact that in adults with AD, the results obtained with the immunoenzymatic method appear to be more useful in assessing the relationship between the clinical course of the disease and the presence of a high specific IgE level of antibodies to aeroallergens.
Another issue was to find an answer to the question: what plays a more important role in such an assessment: the number of positive sIgE results or their intensity. Therefore, in the second phase of our research, the patients were divided into 4 groups A, B, C and D as it is presented in the results. This classifies patients practically as: group A – negative results; group B – only high positive results; group C – positive results without presence of high positive results; and group D – positive results including at least one high positive result.
In group A, statistically significant frequency of the patients with a mild course of disease was observed, whereas in group B all the patients had severe AD. The analysis between groups C and D showed statistically significant more frequent occurrence of the patients with a severe course of AD in group D (at least one high positive result) than in group C (no high positive results). What is more, 1. No statistically significant differences were found in the frequency of severe AD patients in the groups with different numbers of high positive results (group B vs D), and only negative results (group A) vs. only positive results, but no high positive ones (group C); 2. Statistically significant more frequent presence of the patients with AD-Index ≥ 2 in group B (high positive results) than in group C (positive but not high positive) as well as in group D (positive and high positive results) than in group A (negative results). All the observations in our study indicate that a more severe clinical course of AD was observed mainly in the patients with high positive specific IgE levels of antibodies to aeroallergens.
The diagnostic utility of allergy tests depends on their sensitivity and specificity. In our own research, the screening of AD patients based on the presence or absence of high specific IgE levels of antibodies to aeroallergens omitted more than one-third of the patients among those with really severe AD and one-fifth of the patients with a really mild disease course. However, it should be remembered that the pathogenesis of AD is multifactorial and its clinical course is influenced by a variety of other intrinsic and extrinsic factors, such as stress, temperature, humidity, occupational and non-occupational exposure to chemical agents and the degree of the epidermal barrier damage [1]. Nevertheless, our own results support the observations of other researchers that the course of AD with high specific IgE serum concentrations of antibodies to aeroallergens is characterized by a certain clinical individuality [34].
The commonly accepted laboratory markers which predict a severe AD course are the disturbance of filaggrin expression and a high concentration of total IgE [35, 36]. Analysing our own results, the question can arise whether the serum concentrations of specific IgE antibodies to aeroallergens may have a prognostic value in the severity of AD. The calculated values of PPV and NPV indicate that AD with a severe course defined according to our own clinical criteria will also be developed in 39% of the patients who do not have high serum concentrations of sIgE antibodies to aeroallergens, and 20% will have a severe course of the disease despite the high concentrations of these antibodies. It is worth mentioning that the real prognostic value of these studies expressed in PPV and NPV values is affected not only by the multifactorial pathogenesis of AD, but also by the selection and size of the study groups [17].
The results of our research suggest a certain relationship between the presence of high positive specific IgE concentration of antibodies to aeroallergens and the severe course of AD. The other studies have shown that allergy to aeroallergens predisposes to the development of AD as well as atopic diseases of the respiratory tract [37–39].
Therefore, in order to confirm the prognostic significance of the presence of high sIgE concentrations for the course of AD, long-term multi-centred double-blind system observations on large groups of AD patients, especially in those with an extrinsic form characterized by high total IgE, should be performed [34].
Conclusions
Polyvalent allergy to aeroallergens is a characteristic feature of adult AD patients. The compatibility of SPT results with aeroallergens and specific IgE serum concentrations of antibodies to allergens provides the evidence for the equality of the two methods, which can be used interchangeably. The assessment of aeroallergy is particularly advisable in AD patients with elevated serum total IgE levels. The obtained results can suggest that the presence of high specific IgE levels of antibodies to aeroallergens may be the factor predicting a severe course of AD with manifestations of strong pruritus, extensive skin lesions and presence of the atopic respiratory tract diseases.


