
Introduction
The changes in the human body over time are a very interesting phenomenon. Certain measurable parameters, e.g., cross-sectional areas [1] of the nasal cavity, can be the basis for establishing reference values for a given population. The rates of increase in height and body weight depend on the environment, sex, and race (including multiple subracial categories) and cannot be assessed without considering the geographic and social environment as they are inextricably interconnected. Although the norms for height, weight, or nasal cross-sectional areas for the individual age groups have not been analysed in terms of the subjects’ place of residence, they are very important for assessing the general health of the society [2].
Aim
The purpose of this study was to assess changes in anthropomorphic measurements (body weight and height) and rhinometric measurements (nasal cross-sectional areas) concerning the age and sex of subjects from the evaluated Polish population. Moreover, we analysed the relationships between the anthropometric measurements of individual growth (height, body weight, and weight-to-stature ratio) and inner nasal-cavity dimensions measured via acoustic rhinometry (AR) [3] in an attempt to identify the anthropometric measurement that correlates most closely with the inner dimensions of the nasal cavity. Unlike internal nasal measurements, external measurements are very easy to obtain. AR helps assess the cross-sectional area at any point along the long axis of the nasal cavity and to determine the distance between selected points on this axis.
Material and methods
The study group was stratified into the following age ranges: 6–8-year-olds, 9–10-year-olds, 11–12-year-olds, 13–14-year-olds, 15–16-year-olds, and > 17-year-olds. These age ranges were selected to have a sufficient number of subjects (30 or more) in each subgroup. The study was carried out mostly in schools and sampling was multistage. A school and a class were selected randomly among those teaching students in the relevant age range. The study population consisted of 638 randomly selected subjects residing in the large urban area of the capital city of Warsaw (324 (52%) females and 309 (48%) males). The mean subject age was 15.3 years (range from 6 to 76 years) (Table 1). Only healthy individuals, i.e., without any symptoms of nasal occlusion and no major nasal structure pathology detected on physical examination, were included in the analysis. Data in each of these age-based subgroups were analysed separately for males and females. Human height was defined as the distance between the vertex and the ground level (i.e., the surface supporting the feet) in a straight, upright position. Body weight was measured with a medical scale. These measurements were used to calculate a weight-to-stature ratio (body weight × 100/height). Rhinometric examinations (SRE 2000 Rhinometrics) were conducted with the nasal mucosa in its physiological condition. The AR method is based on an analysis of the amplitude of sound waves that record cross-sectional areas of the nasal cavity when reflected from the nasal structures [3, 4]. The measurements for the points spaced at 3.9 mm intervals were insufficient for analyses determining the maximum and minimum values of the notches on the AR curves. Therefore, the values between the points were interpolated by spreading a B-spline of degree 3 between the measurement points. The rhinometer was attached to a special stand. A dedicated end-piece, called adaptor, provided by the manufacturer, was applied to the subject’s nostrils. The rhinometer tube was positioned at the fixed angle of 45o, in the sagittal plane of the patient’s body. The impact of the position of the rhinometer tube and of the difference in pressure exerted by the patient’s nostrils on the adaptor was eliminated by positioning the tube and the adaptor so that the first notch of the rhinometric curve, i.e. the one mostly affected by the above factors, was in the same position with each subsequent measurement. The first notch of the rhinometric curve corresponded to the connection of the subject’s anterior nostrils with the nasal adaptor and reflects the initial part of the nasal cavity. This error elimination method guarantees a high degree of repeatability and correctness of the measurements without the production of local ischemia, i.e. physiologically. The only commonly used parameter in RA assessment is minimum cross-sectional area (MCA), which is a measure of the largest narrowing of the nasal cavity (corresponding to the nasal valve). What is more, many authors present cross-sectional areas (CA) for various nasal cavity sections, e.g. at the point of the second narrowing (C-notch), which corresponds to the head of the inferior nasal concha. Another parameter in common use is the nasal cavity volume for a selected section (ranging from 0 cm to 6 cm or from 0 cm to 7 cm). Before the test, the subjects acclimatized to the new conditions in the test location, without the production of local ischemia in the mucous membrane of the nasal cavity in its physiological state. Study inclusion criteria were: age from 6 to 80 years, normal osteochondral nasal scaffolding and internal nasal structures or spontaneous nasal septum deviation rated as grade I or II in the turbine-septal (T/S) classification. The Turbinate/Septum (T/S) scale was used to assess nasal septum deviation in an anterior rhinoscopy examination. T/S scale grade 1: the medial and lateral edges of the middle nasal concha are visible; T/S scale grade 2: the anterior attachment of the middle nasal concha is partially covered by a deformed nasal septum; T/S scale grade 3: the middle nasal concha is fully covered. The reason for using the above scale is that it is the most practical scale for assessing nasal septum deviation [5]. The study exclusion criteria were as follows: subjects with any prior nasal surgery (any surgical correction of the nose): septoplasty, conchoplasty and rhinoplasty, injury significantly altering the osteochondral nasal scaffolding, acute upper respiratory tract infection, symptomatic rhinitis, nasal or nasopharyngeal tumours, nasal polyps, pregnancy, mental disorders, and poor subject cooperation. AR examinations were performed several (2–6) times for each side of the given subject’s nasal cavity in short time intervals, yielding multiple AR curves. Before analysing the obtained data, a single, the most representative AR curve was selected for each nasal cavity 3. The curve to be analysed (the so-called “central” curve) was selected from the middle of the data set. The evaluated nasal cross-sectional areas found along the AR curve were: CSA-1, CSA-F, CSA-3 cm. Cross-sectional area 1 (CSA-1) was measured at the lowest point of the I-notch (i.e., the second notch on the AR curve), corresponding to the nasal valve (isthmus nasi). CSA-F was measured at the first maximum on the AR curve, i.e., the highest point on the AR curve between notches 0 and 1, corresponding to the widening of the nasal space in the nasal vestibule. Notch 0 is defined as the first minimum on the AR curve, corresponding to the junction between the nose adapter and the nostril, and notch 1 defined as the second minimum on the AR curve, corresponding to the nasal valve (nasal isthmus). CSA-3 cm is the mean cross-sectional area along the 3-cm-long segment of the AR curve beyond the I-notch. The parameter that determined curve selection was CSA-3 cm. If the given data set comprised an odd number of rhinometric curves, the selected central curve was the one with the median CSA-3 cm value.
Table 1
Characteristics of the test group
| Parameter | Years (N) | |||||
|---|---|---|---|---|---|---|
| 6–8 | 9–10 | 11–12 | 13–14 | 15–16 | ≥ 17 | |
| Women | 62 | 39 | 43 | 42 | 61 | 77 |
| Men | 51 | 36 | 66 | 63 | 54 | 39 |
| Group | 113 | 75 | 109 | 105 | 115 | 116 |
| % | 17.7 | 11.8 | 17.1 | 16.5 | 18.8 | 18.2 |
On the other hand, if there were an even number of curves, the process of selection pared the data set down to two candidate curves that could be considered as representative. In such cases, the ultimately selected curve was the one whose CSA-3 cm value was closest to the nearest extreme value from the original data set. Thus, for the curve with the lower CSA-3 cm value, the absolute difference between it and the lowest CSA-3 cm value in the data set was calculated, whereas, for the curve with the higher CSA-3 cm value, the absolute difference between it and the highest CSA-3 cm value in the data set was calculated. The ultimately selected curve was the one that yielded a smaller absolute difference. If the difference between the CSA-3 cm values of the two candidate curves was very small (≤ 5%), then one of them was picked randomly. Random curve selection was also used in the data sets comprising a total of only two curves.
Statistical analysis
First, we calculated the coefficient of multiple correlations (R) to show the strength of correlation between the individual AR parameters and those from the set of the evaluated anthropometric measurements. The range of R values spans from 0 (no correlation) to 1 (full linear correlation). Where we did not explicitly provide a method for calculating the correlation coefficient, we used Pearson’s correlation.
Subsequently, we determined which anthropometric measurements appeared to be most closely correlated with the evaluated rhinometric parameters. Backward and/or forward stepwise regression approaches were used to calculate statistical significance (Statistica software). The analysis was continued until only those anthropometric parameters were left that had a significant impact on the evaluated segments of the AR curve. Initially, the data sets were analysed separately for the individual age groups, males and females, and the left and right nasal cavities. However, due to a large number of analysed parameters and the division of the study population into multiple subgroups, we were unable to reach a consistent conclusion. Thus, ultimately, we analysed the sum of the cross-sectional areas of interest for the left and right nasal cavities by introducing the parameter of total cross-sectional area (TCSA). TCSA is the sum of the cross-sectional areas for the right and left sides, although the location of the cross-sections on the two sides generally differed slightly. Thus, the analysed rhinometric parameters were TCSA-F, TCSA-1, and TCSA-3 cm.
Our study was approved by the Institutional Review Board at the Medical University of Warsaw.
Results
The relationship between subject height/body weight and both age and sex
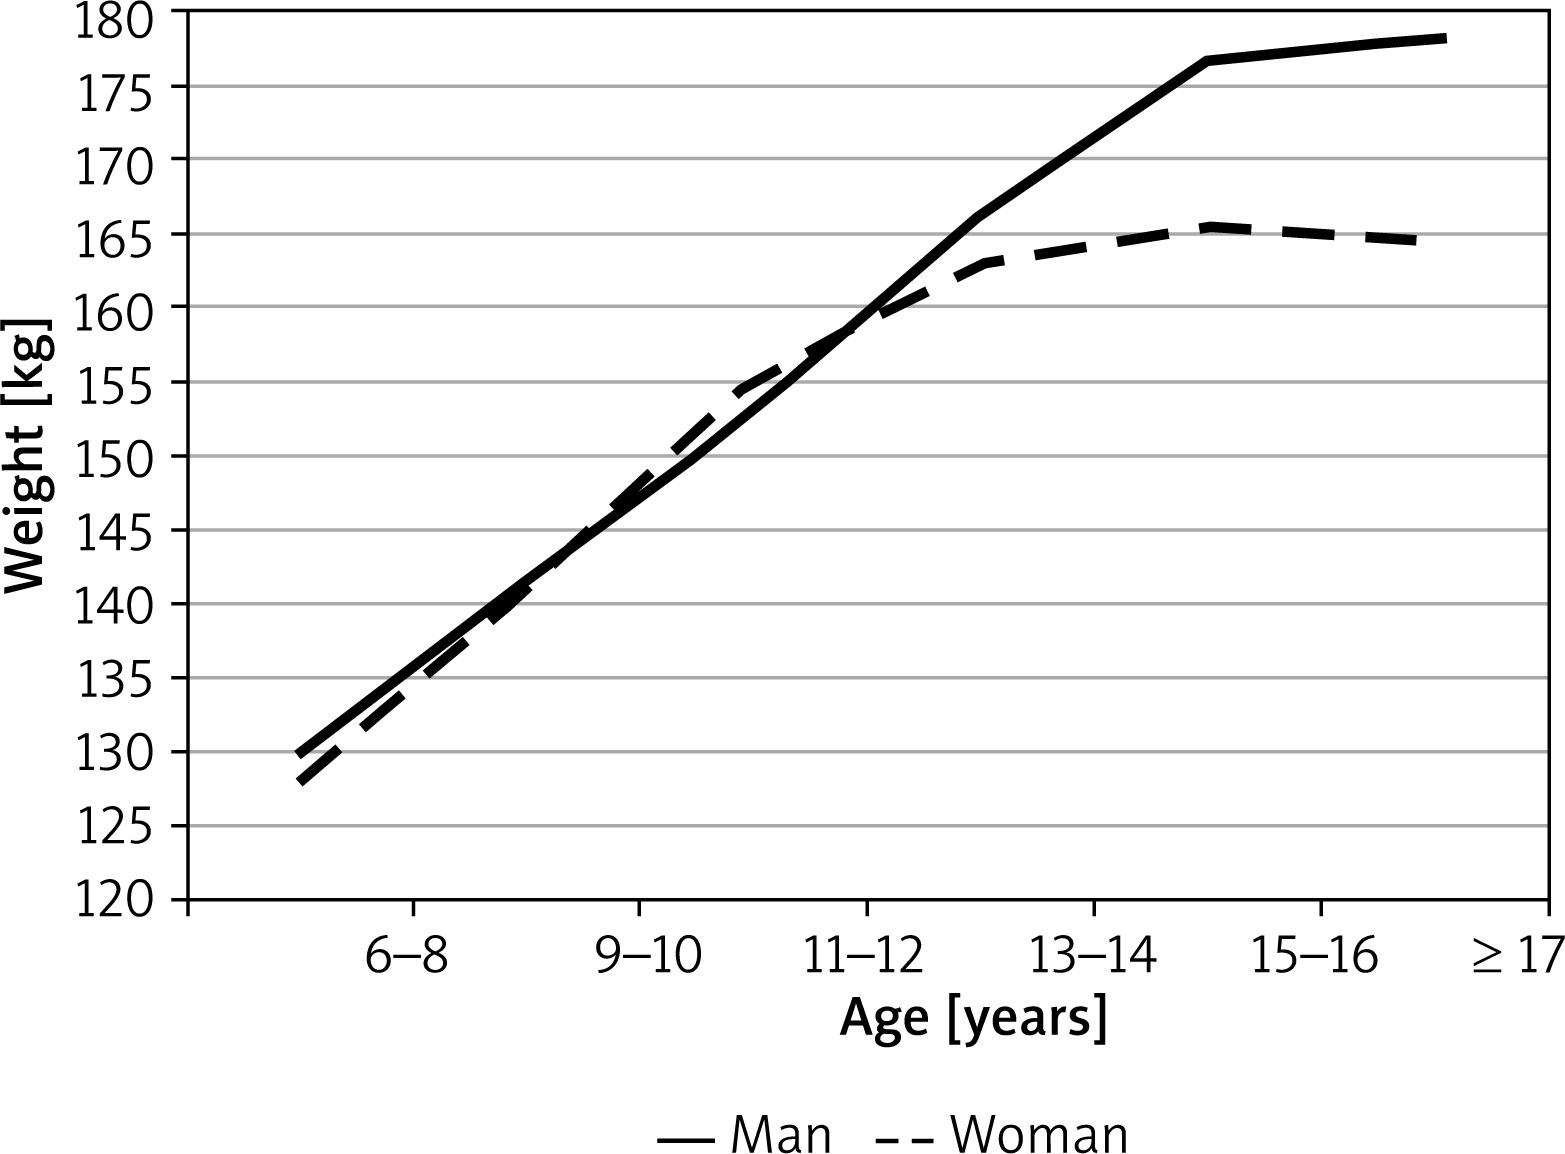
Subject height and body weight depended on both sex and age (variance test’s p-value < 0.000001, Figures 1, 2). The mean height for girls aged 7–8 years constituted 77.8% of the mean height for adults (127.9 cm and 164.4 cm, respectively). The most dynamic changes in female height took place in the period from the age of 7 to 14 years. During that time, the annual growth rate was steady at 4.6 cm (based on mean height values). Between the age of 14 and 16 years, the mean annual growth rate in females was 1.5 cm. In males, the mean height in boys aged 7–8 years old constituted 72.8% of male adult height. The growth rates in males were not steady over time and differed depending on age. The mean annual growth rate in boys aged 7–12 was 3.7 cm. The most dramatic increase in height was observed between males aged 11–12 and those aged 15–16 (calculated based on mean values, the growth rate in this period was 4.2 cm/year). At the age of 16 years, male height was 99% of that measured in adults. The subgroups with the widest distribution of height values were 9–10-year-old and 11–12-year-old females (SD = 8.0 cm) and 13–14-year-old males (SD = 9.9 cm).
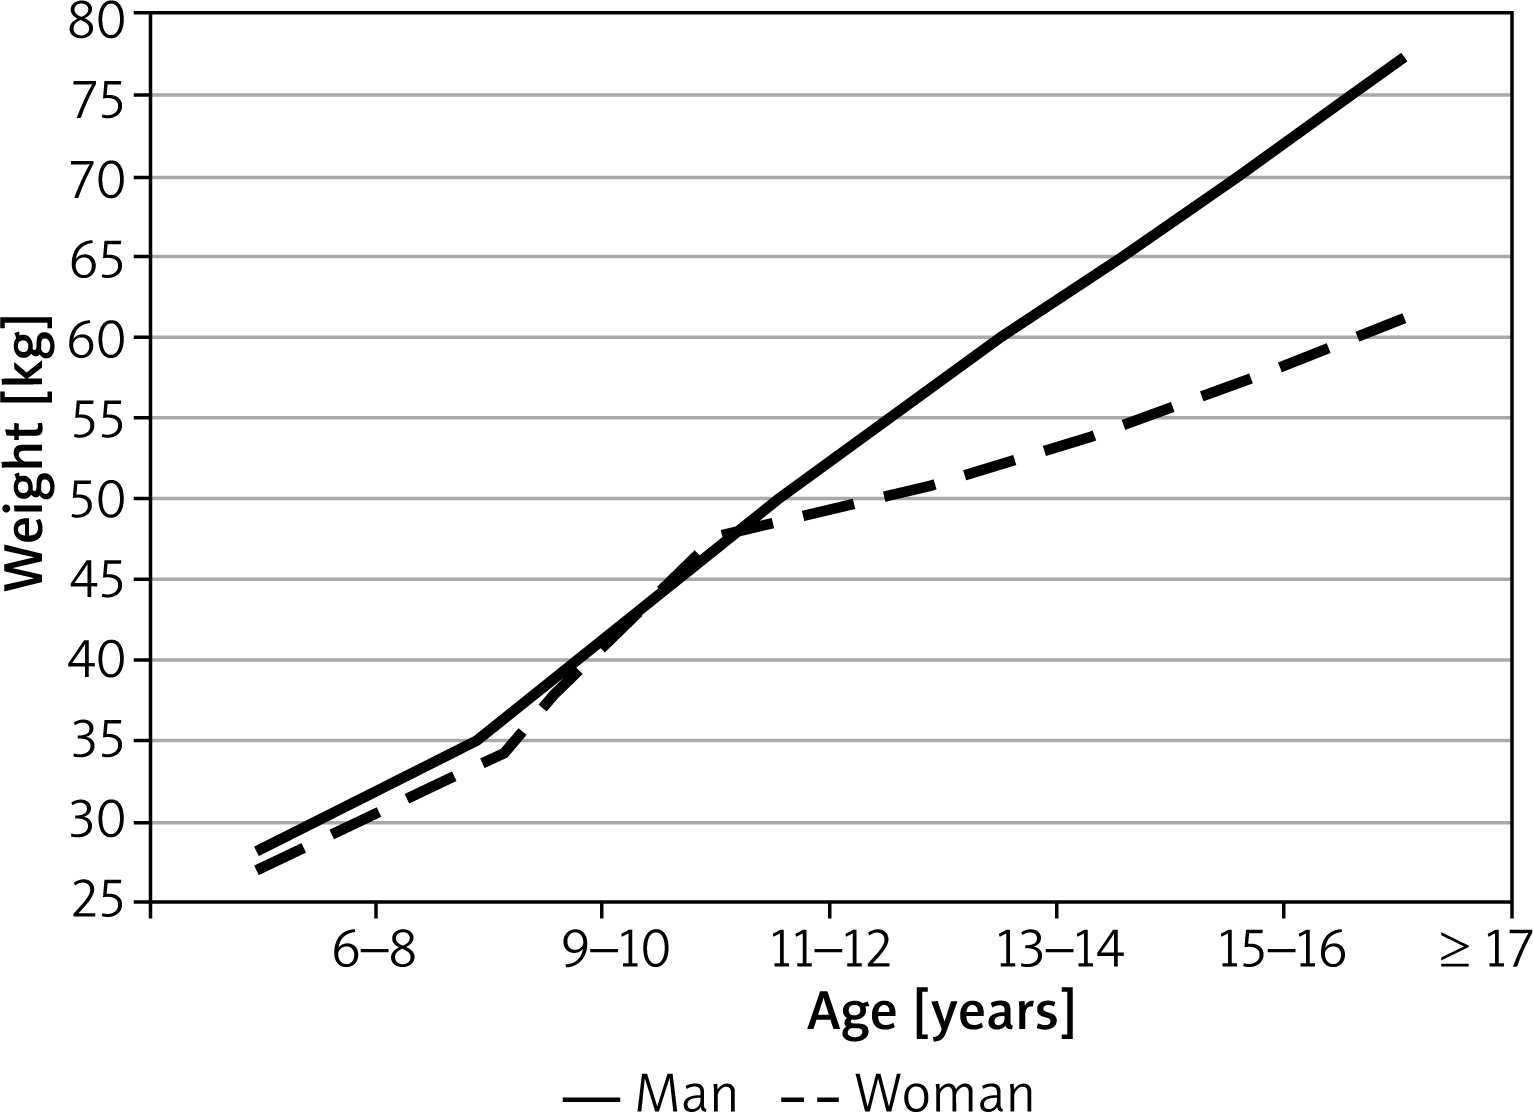
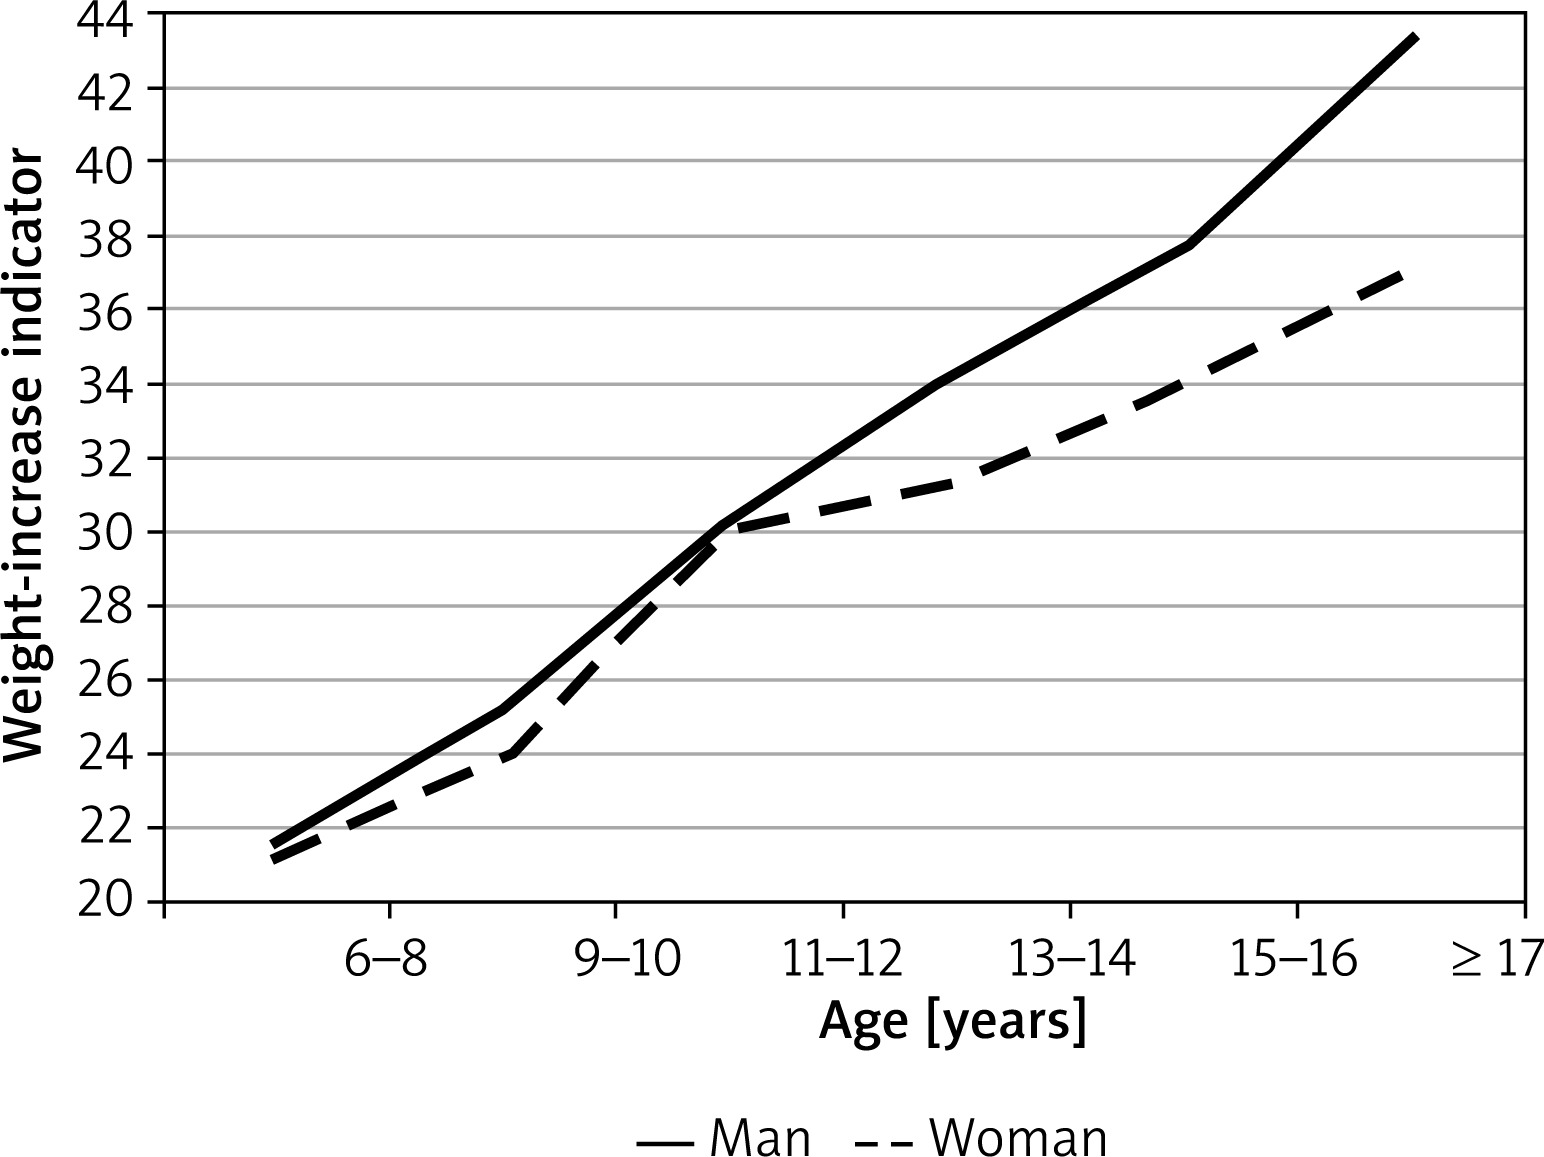
The mean weight of girls aged 6–8 years old was 27.3 kg, which constituted 44.4% of the mean weight measured in adult women (61.5 kg). The most dramatic change in female weight was observed between the ages of 9 and 12, with the mean annual increase in weight of 5 kg. The greatest interpersonal variation in terms of female weight was observed in the group of 11–12-year-olds (SD = 10.1 kg) and ≥ 17-year-olds (SD = 11.5 kg). In the group of males, the mean body weight of 7–8-year-old boys was 28.2 kg, which constituted 36.5% of the mean weight measured in adult men (77.3 kg). The rate of increase in male weight from the age of 7 years was relatively steady at 4.2 kg/year. Subjects’ weight-to-stature ratio was shown to depend on their sex and age (variance test’s p < 0.000001 value, Figure 3). As in the case of body weight, the greatest increase in the mean weight-to-stature ratio in girls was observed between the ages of 9 and 12 years (from 24 to 30). In the male group, the weight-to-stature ratio ranged from 21.6 in 7–8-year-old boys to 43.26 in males aged ≥ 17 years old. The following correlations were observed between the weight-to-stature ratio, body weight, and height: the correlation between weight and height (R = 0.87), between weight and weight-to-stature ratio (R = 0.98), between height and weight-to-stature ratio (R = 0.78).
The relationship between subject nasal cross-sectional areas and both age and sex
The rates of changes in the nasal cavity size were somewhat different in males and females (Figure 4). Nasal cross-sectional areas at the level of the inferior turbinate were similar in females and in males, both in terms of their rates of increase and final (adult) values. The changes in nasal cross-sectional areas at the level of the isthmus nasi were somewhat different. Although up to the age of 9, the mean values of cross-sectional areas at the isthmus nasi were generally similar in both sexes. At the ages of over 9 years, those values were slightly higher in females. However, with higher rates of nasal cavity size increase in males, the value of the cross-sectional area at the isthmus nasi in males exceeded that in females by the age of approximately 13–14 years. The differences in CSA-1 values between males and females aged ≤ 14 years were not statistically significant. However, in the group of adults, CSA-1 values were significantly greater in males than in females (p < 0.001). Our analysis showed that CSA-1 values were relatively constant across all age groups. The mean CSA-1 increased from 0.12 to 0.15 cm2 in females and from 0.17 to 0.24 cm2 in males. The values of CSA-F and CSA-3 cm showed less pronounced changes, with CSA-F showing an increase from 0.41 to 0.42 cm2 in females and from 0.66 to 0.68 cm2 in males and CSA-3 cm showing a total increase from 0.40 to 0.50 cm2. The rates of increase in CSA-1 values in females and in males were comparable.
Figure 4
Average incidence of cross-sections of the nasal cavity in relation to CSA-1 – cross section in the nasal cavity, CSA-3 cm – mean cross section at a depth of 3 cm behind the nasal valve, distance 0-1 – distance of the nasal valve from the frontal nostril
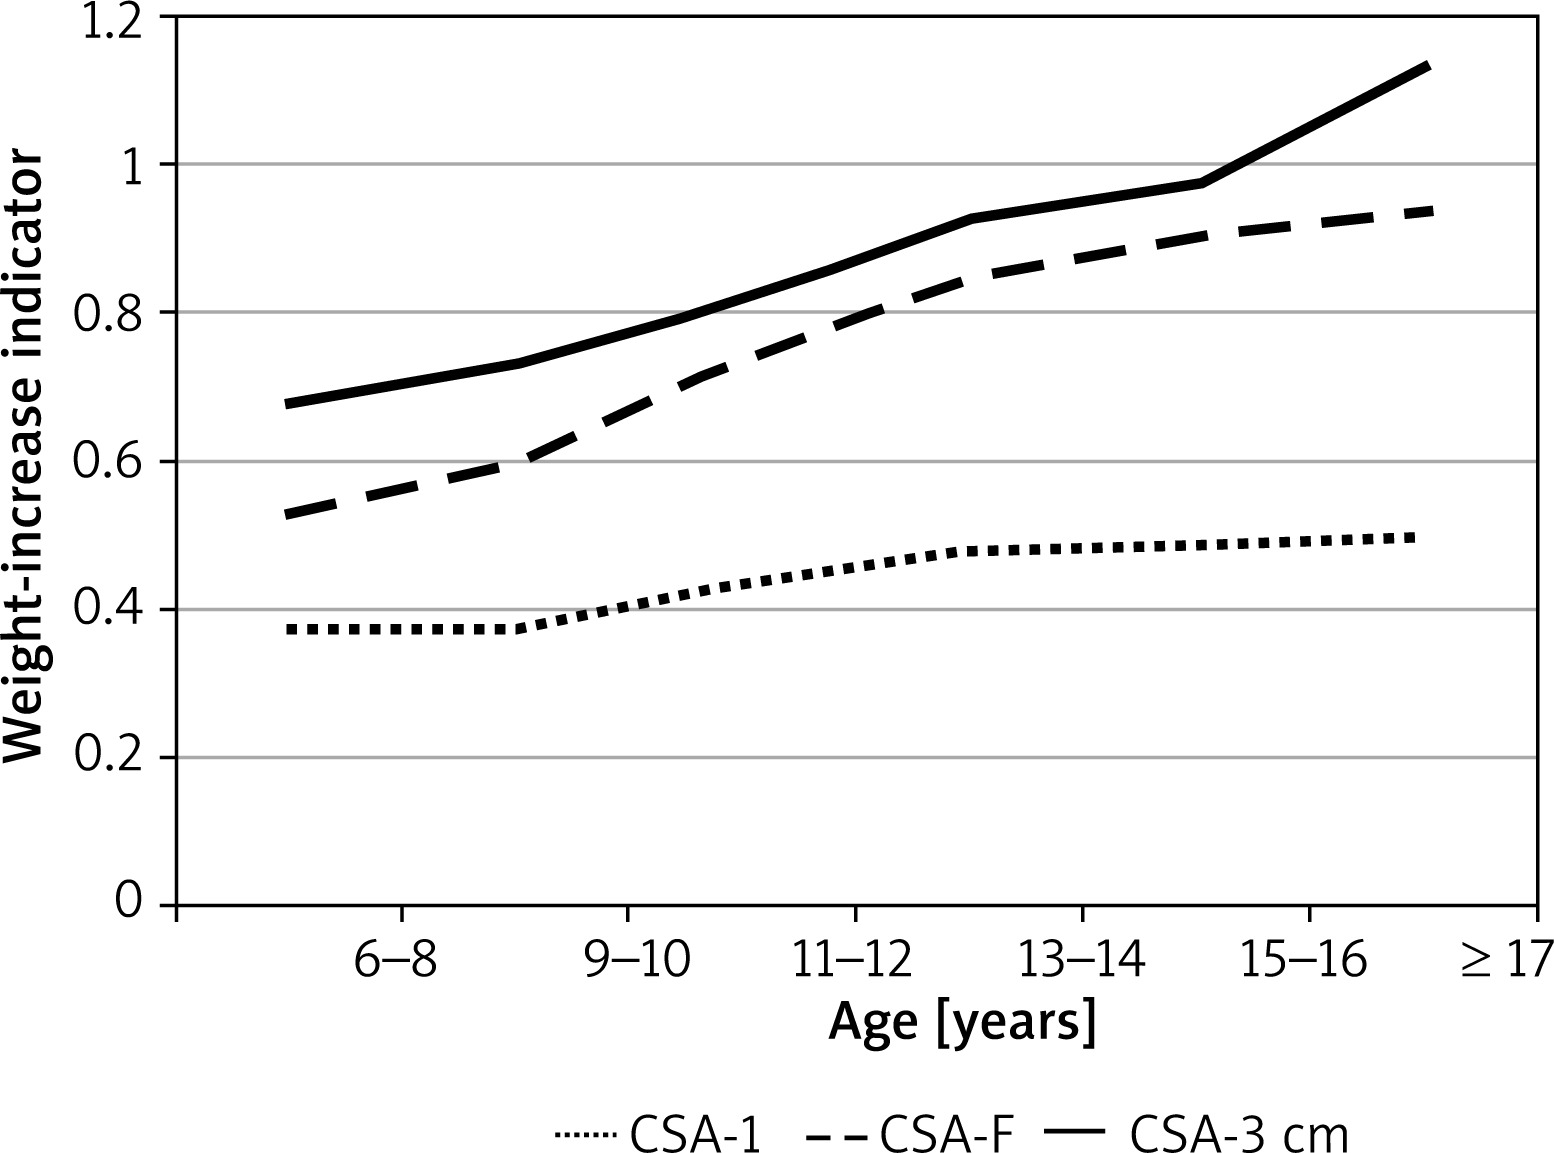
The correlation between most of the AR parameters and subject sex was weaker than that between those parameters and subject age. The rate of changes in the length of the anterior segment of the nasal cavity was different in females and in males. The rhinometric parameter CSA-F, which does not play an important role in breathing, showed considerable variation between the sexes. Conversely, the parameters critical for nasal patency (CSA-1 and CSA-3cm) were relatively uniform for the given age group of either sex.
The relationship between AR curve parameters and the selected anthropometric parameters in the study population
Statistical variables with wide ranges (the best example in this study was height, which ranged from 121.5 cm to 185.7 cm) are known to produce higher values of correlation coefficient R in statistical analysis. For this reason, the study group was adjusted for height. This automatically led to adjustment for age, as height and age show a very strong relationship (p < 0.000001) during the period of growth. Analysis of the study population adjusted for height showed higher R values in males than in females, which seems to have no clinical grounds. The assessed rhinometric measurements in males were significantly greater than those in females, which may have affected the results of statistical analysis. The TCSA was found to better correlate with anthropometric measurements, yielding stronger and more distinct relationships.
Discussion
This paper presents a novel study on a representative population of children and adults. This study provided valuable data on the rates of increase in height, body weight, and nasal cross-sectional areas, stratified by subject age and sex. The child’s physical development has been conventionally assessed based on growth charts containing data on height and weight. Multiparametric analyses of child growth have indeed demonstrated height and weight to be the best measurable parameters of the body’s growth. These measurements are essential for assessing somatic development; however, they provide no information on the functional aspect of development. Assessing an individual’s growth based on the conventional charts (comprising common norms for all girls and boys of the same age but different genetic predispositions) is not accurate. While assessing the child’s growth, one should consider the height of the parents (tall, moderate, and short-statured families), the rate of the child’s development (early, average, or late), and the somatotype (ectomorphic, mesomorphic, and endomorphic).
Although there are growth charts, which may serve as a source of data on the predicted normal values of anthropometric measurements such as body weight or height, there are no universally established reference values for nasal cross-sectional values obtained based on AR curves. The latter has been demonstrated in multiple studies, including a study by Corey which showed neither significant differences in rhinometric parameters between females and males of the same race nor any relationship between rhinometric parameters and subject height [6–8]. A study by Mohebbi et al. attempted to establish the reference ranges for the minimal cross-sectional area (MCA) and the volume of the nasal cavity based on AR in the population of adult Iranians. AR examinations were conducted in 180 adult Iranians (aged 18–60 years) with no nasal symptoms [9]. The evaluated AR parameters were the mean nasal volume and MCA, with a subsequent assessment of correlations between these variables and subject age, sex, height, body weight, smoking, and those AR measurements following nasal mucosa decongestion. The total volume of the nasal cavity in Mohebbi’s study was 8.12 ±0.94 cm, whereas the total MCA was 0.9 ±0.17 cm (before decongestion). Those authors detected no correlation between these rhinometric parameters and subject age, sex, height, body weight, or smoking. However, the evaluated rhinometric parameters increased markedly following nasal decongestion. A study by Raza et al., conducted in healthy adult Singapore residents, included 75 volunteers (44 males and 29 females) aged 18–64 years (mean age: 34.9 years). Body-mass indices (BMI) were calculated based on height and weight measurements. Each study subject underwent an AR examination. Raza’s study demonstrated no significant correlation between BMI, height, or weight on the one hand and any of the evaluated AR parameters on the other. Raza’s findings showed nasal geometry to be unaffected by either BMI, or height, or body weight in adults [10].
Our study findings are different. We demonstrated that the evaluated rhinometric parameters in the form of CSA-1 and CSA-3 cm in adult (> 17-year-old) males were significantly larger than those in females. Moreover, all evaluated rhinometric parameters showed a good correlation with subject height. This correlation was highly significant (p < 0.000001). This finding is consistent with those reported by others. A study by Haavisto and Sipila conducted AR measurements in 74 Finnish children (aged 1–12 years) and assessed the correlation between the MCA values and both subject age and body surface area (BSA), with the latter calculated based on the subject body weight and height. Haavisto showed a positive correlation between MCA and both subject age and BSA [11]. Wartelle et al. attempted to optimize the AR technique and determine the MCA and nasal volume (NV) values in healthy preschool children. The study was conducted in 70 children (aged from 2 to 5 years). The mean MCA values in the age groups of 24–35, 36–47, and 48–60 months were 0.46, 0.53, and 0.58 cm2, respectively. The mean NV values in those age groups were 2.14, 2.59, and 2.86 cm3, respectively. As a result, the MCA and NV values showed a significant correlation with subject height, age, and body weight [12]. All of the reports mentioned above emphasized that AR is a non-invasive, quick, accurate, and easy method of measuring intranasal spaces [3]. AR can be used in all age groups (it has also been used in experiments on small animals) [13]. Rhinometric measurements can be repeated multiple times, which offers an opportunity to monitor even the short-term changes in nasal cross-sectional areas. AR measurements in healthy individuals are very consistent across different rhinometers and different centres.
Typical AR curves obtained in healthy individuals are characterized by two notches along the first 5-cm-long segment of the nasal cavity. The first of these notches corresponds to the structure known as the nasal valve (or isthmus nasi). The second notch corresponds to the level of the head of the inferior turbinate. Following mucosal decongestion, MCA is expected at the level of the nasal valve (the first notch on the AR curve). As the narrowest part of the nasal cavity, the nasal valve is highly susceptible to many factors (e.g., anterior septum deviation) that can reduce its lumen. Hence, even a slight narrowing at the nasal valve generates a considerable increase in airway resistance. Both AR (which helps assess nasal cross-sectional areas at various points along the nasal cavity) and rhinomanometry (which helps assess airway resistance) demonstrate marked repeatability and accuracy in assessing the nasal valve.
Conclusions
This is a cognitive study and it is useful in AR standardization for the nasal allergen challenge test. It is impossible to present such a contribution as a brief note to the editors, given the scale and results of the study as well as its uniqueness. Depending on the studied parameters, nasal cavity growth assessment is critical to AR standardization. Subject height showed a better correlation with rhinometric parameters (cross-sectional areas of the nasal cavity) compared with subject age, particularly in the period of growth.


