
Introduction
IgE-mediated allergic diseases such as drug and food allergies are characterized by an increased level of circulating allergen-specific (sIgE) antibodies [1]. Thus, the detection of sIgE is crucial for treatment, diagnosis and prevention of IgE-mediated allergic diseases. The appropriate detection of sIgE, identification of the clinically relevant allergen and corresponding symptoms also play a key role in decisions regarding selection of allergen immunotherapy. Additionally, highly sophisticated judgement is required during allergen test selection and test results’ interpretation because detection of sIgE demonstrates only sensitization, not an allergy itself. The profiles of sIgE sensitization may vary with respect to race, allergic disease and cultural differences. Thus, culinary culture and biogeographic characteristics should be taken into consideration when designing test panels [2, 3]. Clinicians should also consider age of the patient, cross-reactivity of the allergen, exposure history with relevant manifestations in identifications of causative allergen(s) [4–6].
Laboratory and skin-based tests are available for sIgE detection. In vitro detection is based on usage of singleplex or multiplex allergen sIgE assays [7]. There are many differences between methods of IgE detection [5]. Thus, the understanding the characteristic of each tests including reliability, validity, strengths and limitations is important [8]. In vivo skin test is not a quantitative and difficult to be standardized method for detection of sIgE. As opposed to skin tests, serological tests do not require patients to stop taking medications during testing. Moreover, examination of the patient might be performed immediately after anaphylaxis without the concern of allergic reactions. The serologic test is not related to recurrence of allergic reactions because of testing [8, 9].
ImmunoCAP is a classical “gold-standard” singleplex sIgE detection system provided by Thermo Fisher (ImmunoCAP, Uppsala, Sweden) characterized by reproducibility, reliability as well as good accordance with results of skin tests and allergen challenge in vivo. Due to improvement and development of various fluorescent enzyme immunoassays, ImmunoCAP is a reference method for measurement of sIgE recommended by the World Health Organization [10, 11]. However, individual ImmunoCAP is capable of detection of sIgE only against a single allergen, thus it is a quite expensive test for using in clinical settings [12]. BioIC is a multiplex, automated microfluidic-based immunoassay system for detecting and measuring of sIgE in serum with the advantage of low sample volume [13].
Aim
The aim of the current study was to compare diagnostic capability of the automated microfluidic-based immunoassay system (BioIC®) with that of ImmunoCAP system – a gold standard method for diagnosis of allergy.
Material and methods
Participants and serum samples
Twenty participants (age: 1–34 years old; 11 female and 9 male) were enrolled in this study. The participants underwent routine sIgE assessment. The study was carried out in January 2018. Serum was isolated from freshly drawn blood samples. Afterwards, isolated serum was aliquoted into two samples and then stored at 4°C. In order to prevent bias occurrence between performed assay procedures, the ImmunoCAP and BioIC testing were carried out in a parallel fashion and blindly on the same day.
sIgE detection assay
The ImmunoCAP (Thermo Fisher Scientific, Uppsala, Sweden) and BioIC assays were compared with respect to detection of sIgE. Both tests were conducted according to manufacturers’ instructions. Thirty-three allergens: 16 inhalant allergens (Dermatophagoides pteronyssinus, Dermatophagoides farinae, Alternaria alternata, vernal grass, cocksfoot, timothy, rye, alder, birch-tree, hazel, oak, mugwort, plantain, rape, cat, dog), 16 food allergens (egg white, cow’s milk, cod, rice, peanut, soya, hazelnut, tomato, carrot, potato, egg yolk, α-lactalbumin, β-lactoglobulin, casein, banana, mix of citrus) and 1 contact allergen (latex) were chosen for comparison. The cut-off for a positive result for both BioIC and ImmunoCAP assays was 0.35 kU/l. The same class determination range was adopted for both assays and expressed as: 0.00–0.34 kU/l (class 0), 0.35–0.69 kU/l (class 1), 0.70–3.49 kU/l (class 2), 3.50–17.49 kU/l (class 3), 17.5–49.99 kU/l (class 4), 50.00–99.99 kU/l (class 5), and > 100 kU/l (class 6).
Description of the device and procedure of the microfluidic-based immunoassay test
Five reagent delivery channels are part of the microfluidic cartridge for automated assay for allergen screening. The role of these channels is to pump reagents to the common reaction zone from individual storage tanks. Allergen extracts are immobilized in the common reaction zone and finally go to the waste tank with all reaction by-products. During the assay procedure, 90 μl of undiluted serum or plasma, 120 μl of premixed substrate, 450 μl of wash buffer, 120 μl of HRP conjugate (dilution: 1 : 1000) is added to the proper tanks within the cartridge using a micropipette. Then, the cartridge is inserted into the BioIC instrument and automated, chemiluminescent immunoassay is carried out in less than 30 min. Solenoid actuators are a part of the instrument pumping reagents in the cartridge in order to carry out two-step ELISA within 10 min each. The temperature of reaction is controlled at 32°C. When the final substrate is added, the chemiluminescence signals are imaged using a low-resolution CCD camera. Cartridges are discarded after use [14].
Statistical analysis
To compare the multiplex assay and singleplex assay, we used IBM SPSS Statistic version 23.0 (IBM Corp., Armonk, NY) for multiple statistical tests. First, ROC AUC analysis was carried out to compare the sensitivity and specificity of each method for each allergen. For qualitative analysis, total agreement ratios (agreement of detection results) were calculated [(number of both tests presenting a positive result + number of both tests presenting negative results)/total number of tests] [15]. Pearson’s χ2 test was used for analysis of this agreement. Cohen’s κ analysis was also used for comparison of these categorical cross-table data. Kappa values were assessed and categorized as follows: 0.8–1.0 (almost perfect), 0.6–0.8 (substantial), 0.4–0.6 (moderate), 0.2–0.4 (fair) and < 0.2 (poor) [16]. Class assessment was compared by gamma analysis. A stronger association is observed when the gamma index is closer to 1. For semi-quantitative comparison between class determinations, Spearman’s rank correlation analysis was used for classes 0–6 as well as Kruskal’s gamma analysis. The coefficients of Spearman’ correlation were classified as follows: 0.9–1.0 (very high positive correlation), 0.7–0.9 (high positive), 0.5–0.7 (moderate positive), 0.3–0.5 (low positive), < 0.3 (negligible) [17]. Intra-class correlation was also performed to assess the correlation between quantitatively expressed results of both tests. Good agreement between two methods was observed when values are closer to 1. P < 0.05 showed statistical significance.
Results
ROC analysis
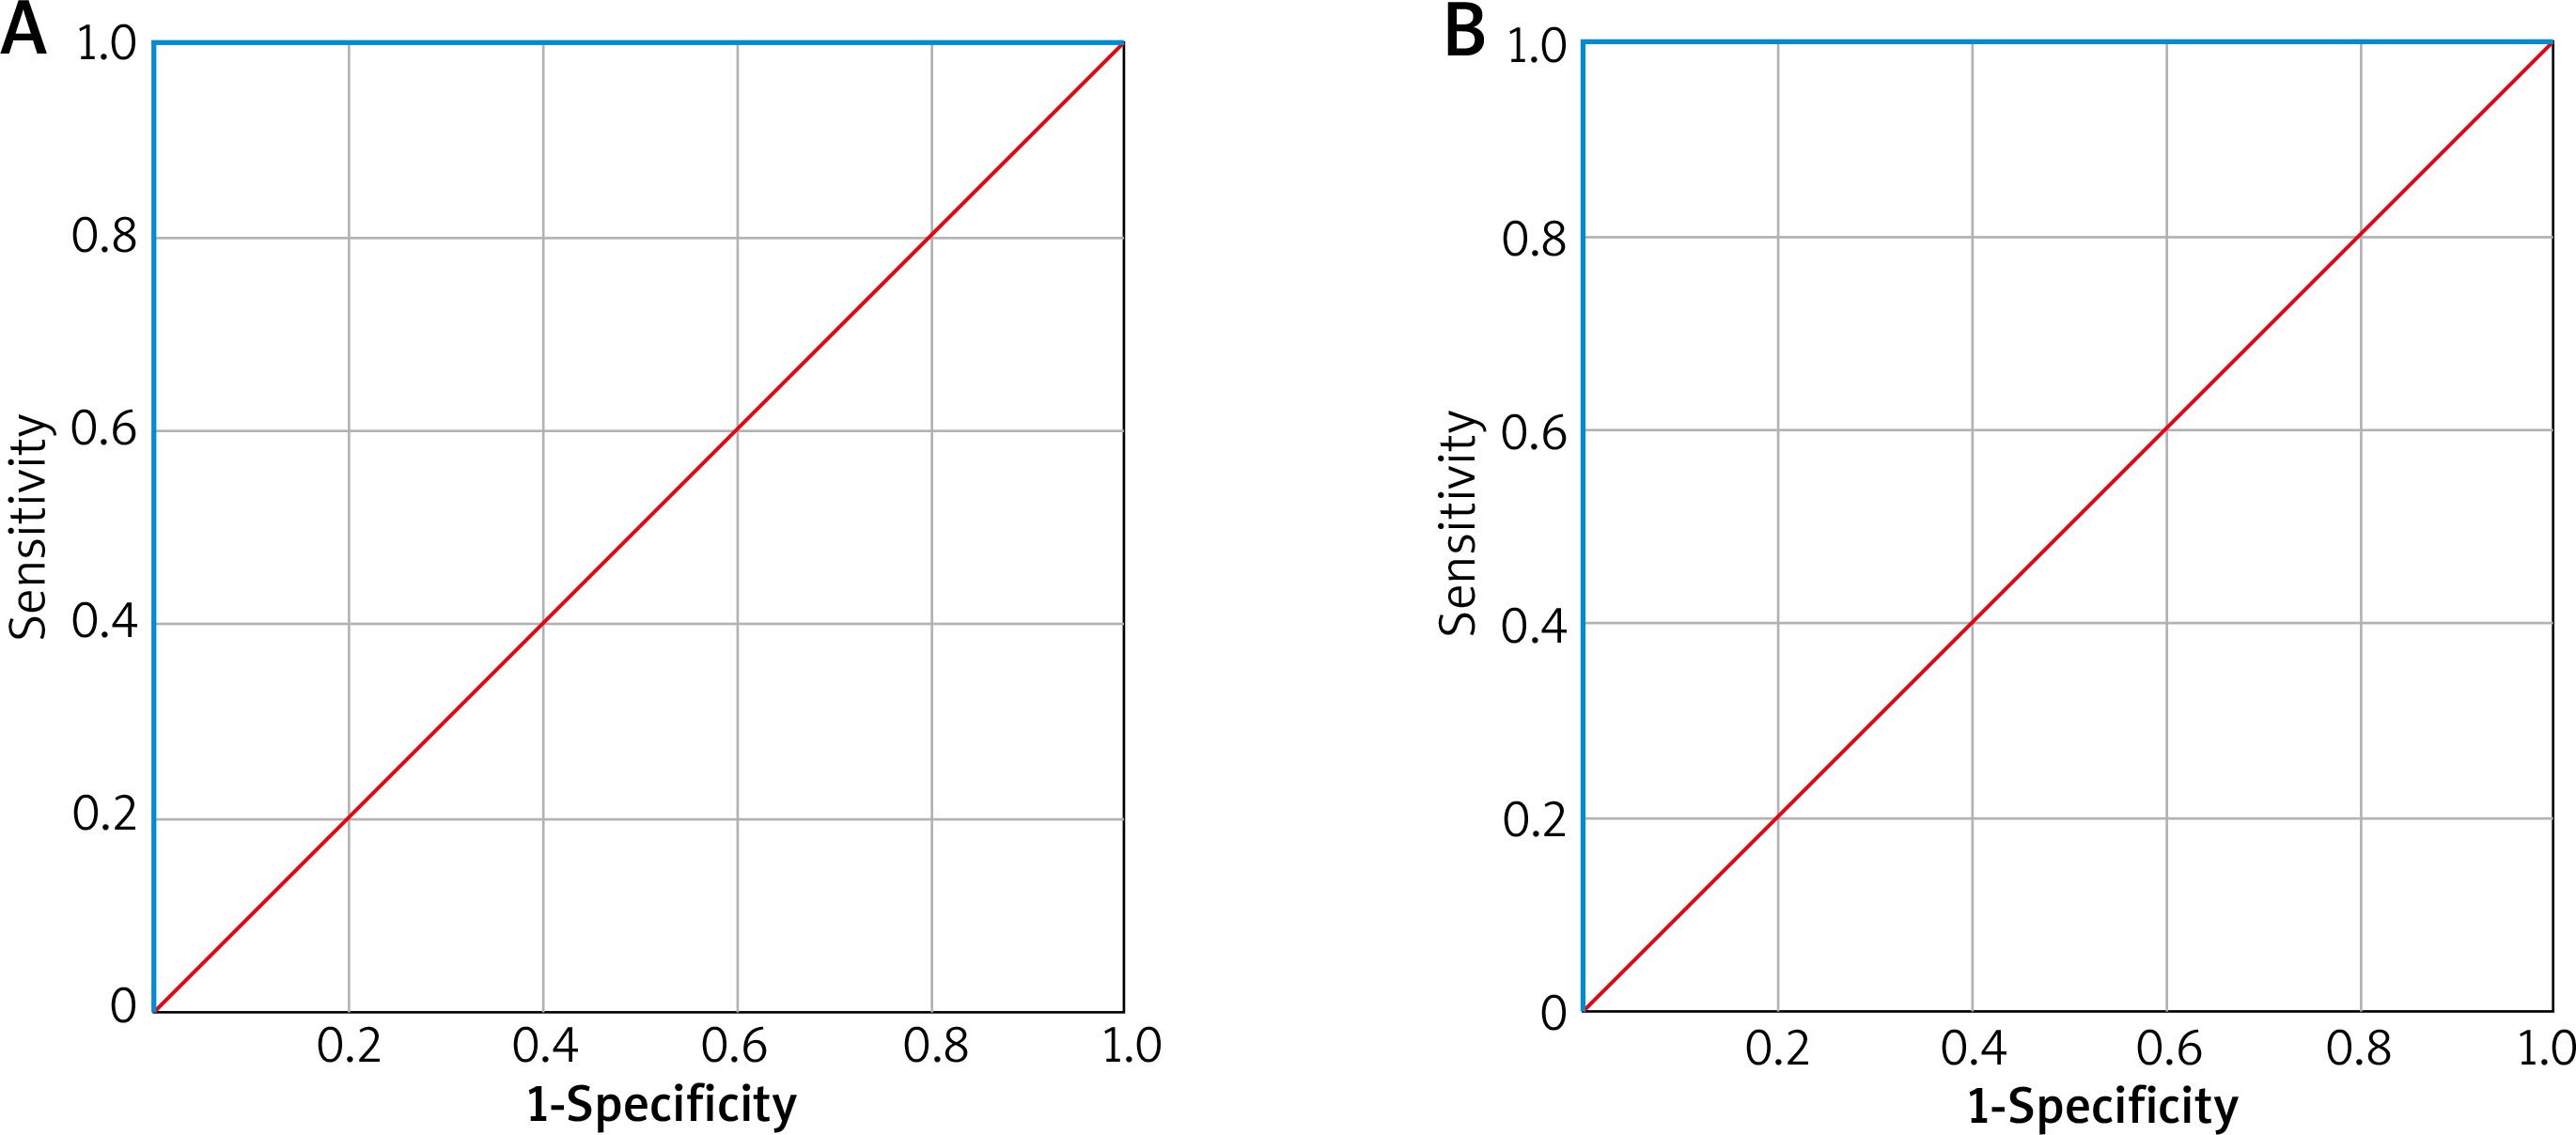
ROC AUC analysis was performed for each allergen and each method. ROC curves for the ImmunoCAP and BioIC are shown in Figure 1. Results of ROC AUC for all allergens for both assays are equal to 1. Thus, both BioIC assay and ImmunoCAP assay as diagnostic methods have similar, very high sensitivity and specificity.
Qualitative analysis: positivity and negativity
The total diagnostic agreement ratios between assays – negativity and positivity for each allergen for each test are equal to 1 and are summarized in Table 1. Kappa index classifications were all 1 and determined as almost perfect. P-value calculated using Cohen’s κ analysis and Pearson’s χ2 were all < 0.001.
Table 1
Positivity and negativity agreement between BioIC and ImmunoCAP
Semi-quantitative analysis: class consistency (0–6 class)
The analysis of class correlation data was performed using Spearman’s correlations and gamma index. The gamma indexes and Spearman’s correlation coefficients are equal to 1. Gamma index values closer and equal to 1 indicate good agreement (p < 0.001). The class correlation analysis showed very high positive correlations between two assays for all tested allergens (p < 0.001).
Discussion
The main goal of the current study was to compare the diagnostic accuracy of the automated microfluidic-based immunoassay system (BioIC®) known as lab-on-chips and ImmunoCAP assay system – a laboratory method for identifying sensitization to specific allergens. Comparison of BioIC assay system and ImmunoCAP assay system was performed considering the difference of principles of the in vitro test and the in vivo test indicating a limitation of allergen skin test usage as a reference method [4]. ImmunoCAP assay is known for having established performance [18]. Thus, in our study we performed comparison with ImmunoCAP assay.
In the current study, BioIC assay showed almost perfect agreement in comparison with ImmunoCAP assay. Our results showed that two assays: singleplex ImmunoCAP assay and multiplex BioIC assay yield the same results using the same units but having differences in methodology. ROC AUC analysis showed that BioIC assay has similar sensitivity and specificity to ImmunoCAP assay.
High progress of nanotechnology has caused a wide application of microarrays both for routine outpatient settings and research. Currently, microarrays show great potential in the use for sIgE level analysis. Moreover, microarrays are multitarget screening techniques (50+) with minimal serum (25–100 μl) using for the test [14].
The microfluidic cartridge for allergen screening presented similar sensitivity to microarrays employing allergen extracts. Allergen extracts are a complex mixture of non-allergenic and allergenic proteins. Thus, the basis of sIgE detection assay is high surface areas for immobilizing extracts constituting the challenge for miniaturizing assays. In accordance with our results, microfluidic cartridges present similar sensitivities as compared to other microassays that also employ allergen extracts [19–22]. Moreover, the advantage of microfluidics is capability to carry out reactions under dynamic (continuous flow or active mixing) rather than static conditions and provide more effective elimination of nonspecific bindings by non-allergenic proteins. From the point of view of medical centres, an automated operation and rapid centralized report system for test results obtained are needed. Protein-microarrays are multiple steps and prolonged manual operation takes 2–3 h to perform the test. In turn, BioIC assay is a multiplex, inexpensive assay with automated, rapid analysis intended for low-volume specific-allergen testing [14].
Some studies have compared singleplex and multiplex test results obtained from different assays. A study comparing the RIDA qLine Allergy (R-Biopharm AG, Darmstadt, Germany) with ImmunoCAP showed that it is more likely to provide false-positive results by RIDA system [23]. Comparison of three multiplex sIgE assays (MAST Optigen allergy system (Hitachi Chemical Diagnostics), RIDA Allergy Screen, (R-Biopharm), Polycheck Allergy (Biocheck GmbH)) revealed that the Polycheck Allergy is more specific and MAST Optigen allergy system is more sensitive [24]. The comparison of AlloScreen with the skin prick test showed good agreement and correlation [25].
The insurance system and medical costs are different in each country. Thus, clinicians must be well-informed when taking into consideration weaknesses and strengths of available diagnostic methods considering their use in patient testing. The use of different assays for sIgE detection is not guaranteed to obtain comparable results [26]. In vitro detection of sIgE is not a guarantee of the allergic disease in a patient [5]. Numerous companies seek to improve the quality of in-vitro tests minimizing the disadvantages of their products [27]. Our results demonstrated that BioIC assay shows stronger agreement with ImmunoCAP. Shyur et al. also showed that microfluidic cartridge immunoassay has similar diagnostic accuracy to ImmunoCAP assay [13]. The presented BioIC system is a suitable diagnostic tool for decentralized testing where frequencies of the test are 16–20 per day. It is also possible that some improvements of these systems may be necessary. Currently, the technician is required to operate manual pipetting and reagent handling. The ideal solution would be storage of reagents on the cartridge itself provided that the period of cartridge self-life will be long [14].
The present study has some limitations. First, the number of participants enrolled in the study is low. Second, the test should be also carried out on non-allergic population. Notably, further studies on a larger number of participants and comparison with non-allergic population are needed.
Shyur et al. have presented a similar comparison as our study but made on a much larger number of patients. In the current study, we presented the comparison between results from BioIC assay and ImmunoCAP assay in the Polish population. The number of people suffering from allergy is still growing in Poland and finding new tools for fast sIgE detection is needed.
Conclusions
The microfluidic cartridge immunoassay for detection of sIgE is a promising instrument for both research and routine outpatient settings. BioIC assay has numerous advantages such as easy access, automated system with an extended working range and diagnostic sensitivity similar to ImmunoCAP assay. Additionally, BioIC system showed potential for decentralization of allergen screening as well as near-patient screening where rapid analysis, low instrumentation cost and ease of use are crucial in the clinical laboratory.


