
Introduction
Cholangiocarcinoma (CCA) is a rare but often fatal cancer of the liver [1]. It can be classified as either intrahepatic (I-CCA) or extrahepatic (E-CCA) depending on its anatomical location. Despite the fact both tumor subtypes consist of malignant cholangiocytes, distinct differences exist in their respective growth patterns and clinical courses [2, 3]. For example, I-CCA grow rapidly, form masses, are invasive, and often metastasize. On the other hand, E-CCA grow slowly, along tissue planes of adjacent structures, are less invasive and only rarely develop distant metastases [4, 5]. These differences could be explained by differences in tumor cell biology and/or the prevalence and stem cell surface marker (SCSM) expression profiles of cancer stem cells (CSCs) within the tumor cell population.
Cancer stem cells are a subpopulation of tumor cells that have the ability to self-replicate and differentiate into different cell lineages [6]. They can be identified by the expression of certain SCSMs including CD13 [7], CD24 [8], CD44 [9, 10], CD90, CD133 and epithelial cell adhesion molecule (EpCAM) [11, 12]. CSCs are thought to be responsible for tumor initiation, growth, migration, invasion and metastasis, and each SCSM has been associated with specific tumor cell features [13, 14].
In the current study, we documented and compared I-CCA and E-CCA tumor cell growth features and attempted to determine whether any differences that might exist could be explained by differences in CSC prevalence and/or SCSM expression within the various tumor cell populations.
Material and methods
Cell lines
The HuCCT-1 cell line was purchased from Sekisui XenoTech (USA) and KMBCs from ATCC (USA). The remaining cell lines CCLP-1, SG231, HuH28, TFK-1 and H69 were obtained from Dr. Gianfranco Alpini at Texas A&M University. HuCCT-1, CCLP-1 and SG231 are derived from I-CCAs while KMBC, HuH28 and TFK-1 originate from E-CCAs [15, 16]. H69 cells are transformed bile duct epithelial cells and are derived from normal cholangiocytes [17]. This study was approved by the University of Manitoba Conjoint Ethics Committee for Human and Animal Experimentation.
Reagents
RPMI 1640, Dulbecco’s Modified Eagle Medium (DMEM), Minimum Essential Media (MEM), trypsin-EDTA and fetal bovine serum (FBS) were obtained from Invitrogen (USA). APC-conjugated anti-human CD13 monoclonal antibodies (mAbs) (BD Biosciences, USA), APC-eFluor 780-conjugated anti-human CD24 mAb (Life technologies, USA), eFluor 450-conjuagted anti-human CD44 mAb (Life Technologies, USA), PE-Cy7 conjugated anti-CD90 mAb (BD Biosciences, USA), PE-conjugated CD133 mAb (Miltenyi Biotec, USA), FITC-conjugated anti-human EpCAM mAb (Miltenyi Biotec, USA), and cell viability marker 7-AAD (Beckman Coulter, USA) were applied for flow cytometry. Fluorescence conjugated isotype-matched antibodies were purchased from Life Technologies, BD Biosciences, Santa Cruz and Miltenyi Biotec (USA).
Cell culture
HuCCT1, HuH28, KMBC, and TFK-1 cells were cultured in RPMI 1640 medium supplemented with 110 mg/l sodium pyruvate, 10% HI-FBS, 100 U/ml penicillin and 100 µg/ml streptomycin (Invitrogen, USA). CCLP-1 cells were cultured in DMEM, supplemented with 10% FBS, 2 mmol/l L-glutamine, 100 U/ml penicillin and 100 µg/ml streptomycin. SG231 cells were cultured in MEM, supplemented with 10% FBS, 2 mmol/l L-glutamine, 25 mM HEPES pH 7.2, and 100 U/ml penicillin and 100 µg/ml streptomycin [15, 16]. H69 cells were cultured in DMEM (low glucose, Gibco), 25% Ham’s F12, 10% FBS, 4 mmol/l L-glutamine, 180 µmol/l adenine, 5 mg/l insulin, 5 mg/l transferrin, 2 nmol/l triiodothyronine, 1.1 µmol/l hydrocortisone, 5.5 µmol/l epinephrine, 1.64 µmol/l epidermal growth factor (EGF), 100 U/ml penicillin and 100 µg/ml streptomycin. All cells were incubated at 37ºC in a humidified atmosphere of 5% CO2 and 95% air [17].
Cell proliferation
Cell proliferation and doubling times were determined by seeding CCA cells at a density of 2000 cells per well in 96-well plates. The number of cells in each well was counted on days 0, 1, 3 and 6 after plating by adding a cell proliferation indicator: premixed WST-1 reagent (Takara Bro, USA) and incubating at 37ºC for 3 hours as described [12]. The absorbance of each well against a blank control was measured using a microplate reader (Synergy 4, Biotek, Wi, USA) at 540 nm. Cell doubling times were calculated using the equation:
where duration = day 6 – day 3 (72 hours), final absorbency: absorbency of day 6, initial absorbency: absorbency of day 3.
Colony formation
The tumorigenic capacity of sorted cells was tested by the soft agar colony formation assay as described previously [18]. CCA cells were seeded on a dual-layer soft agar. The bottom layer was composed of a 0.75 ml mixture of 1% Nobel agar and 2× corresponding completed medium (1 : 1), and the top layer of a 0.75 ml mixture of 0.6% Nobel agar and 2× corresponding completed medium. The top layer contained approximately 5,000 sorted cells (1 : 1). Plates were incubated for 21 days in a 37°C incubator. Each well was stained with 300 µl of 10 mg/ml p-Nitroblue tetrazolium chloride and incubated at 37°C overnight. Photographs of wells containing stained colonies were analyzed using ImageJ software with the ColonyArea plugin [19]. The colony intensity is calculated by [19]:
Spheroid formation
Cells were trypsinized and resuspended in DMEM/F12 medium, supplemented with 1 × B-27 serum-free supplement, 4 µg/ml heparin, 100 U/ml penicillin, 100 µg/ml streptomycin, 10 ng/ml EGF, and 10 ng/ml bFGF [12]. Cells were subsequently seeded at densities of 200 cells per well in ultra-low attachment 96-well plates. After 0, 3 and 6 days of culture, spheroids were photographed under the microscope. Aggregation diameters were measured and analyzed by ImageJ software.
Wound healing
Cells (0.5 × 10⁶/ml, 2 ml per well) were seeded in 6-well plates and cultured with culture medium with 10% FBS until confluent. Cell monolayers were scratched with a 200 µl pipette tip to generate a wound according to the method described previously [12]. Phase contrast images were taken at initiation of the wound for different cells and captured again after 6, 12, 18, 24, 30, 36, 42, 48, 60, 72 and 84 hours until the closure was completed. Images acquired were analyzed quantitatively using ImageJ software. By comparing the images from each captured time point, the migration capacity of cells was measured as the extent of wound closure (gap) by calculating wound area. The half-closure time was calculated using the formula:
Gap area was measured and plotted as a function of time. Complete closure was considered the time point at which the wound was completely closed.
Invasion
Twenty-four well Transwell permeable chambers with 8 µm pores (Corning, USA) were used to measure cell invasion. To the upper chambers, 1 × 10⁵ cells were added in 100 µl of corresponding serum-free medium. Lower chambers were filled with 650 µl of medium and 10% FBS. After 24 hours of incubation, cells from the upper surface were removed with cotton swabs. Penetrated cells were dissociated and collected by a cell dissociation buffer (Invitrogen, USA) as described previously [20]. Collected cells were counted by a cell counter (Cellometer Auto 2000, Nexcelom Bioscience, USA).
CSC and SCSM identification by flow cytometry
Cells were cultured in a 35 cm culture dish until 75% confluence, and then trypsinized and resuspended in phosphate-buffered saline (PBS) with 1.5% FBS, 25 mM HEPES pH 7.0, and 1 mM EDTA (Sigma-Aldrich, USA). Cells were then transferred into 75 mm polystyrene round-bottom test tubes (BD Falcon, USA) at a concentration of 1 × 10⁶ cells/ml, stained with fluorescence-conjugated antibodies (anti-CD13-APC, anti-CD24-APC-eFlour 780, anti-CD44-eFluor 450, anti-CD133-PE, anti-EpCAM-FITC, and 7-AAD) as previously described [12]. Cells stained with isotypematched antibodies (BD Biosciences, USA) served as negative controls. Flow cytometer analysis was performed on a BD FACSCanto-II Digital Flow Cytometry Analyzer (USA) using FlowJo (Tree Star, USA) software.
Statistical analysis
All experiments were performed in triplicate and repeated on a minimum of three occasions. Significant differences were determined by repeated measures of ANOVA and/or Tukey’s multiple comparison post-hoc test. Student’s t-test was used for comparisons of two groups. A significant correlation was demonstrated by the Pearson correlation coefficient test. Data were analyzed by GraphPad Prism 6 statistical software (GraphPad Software, Inc., USA). Differences with p values below 0.05 were considered statistically significant.
Results
Proliferation
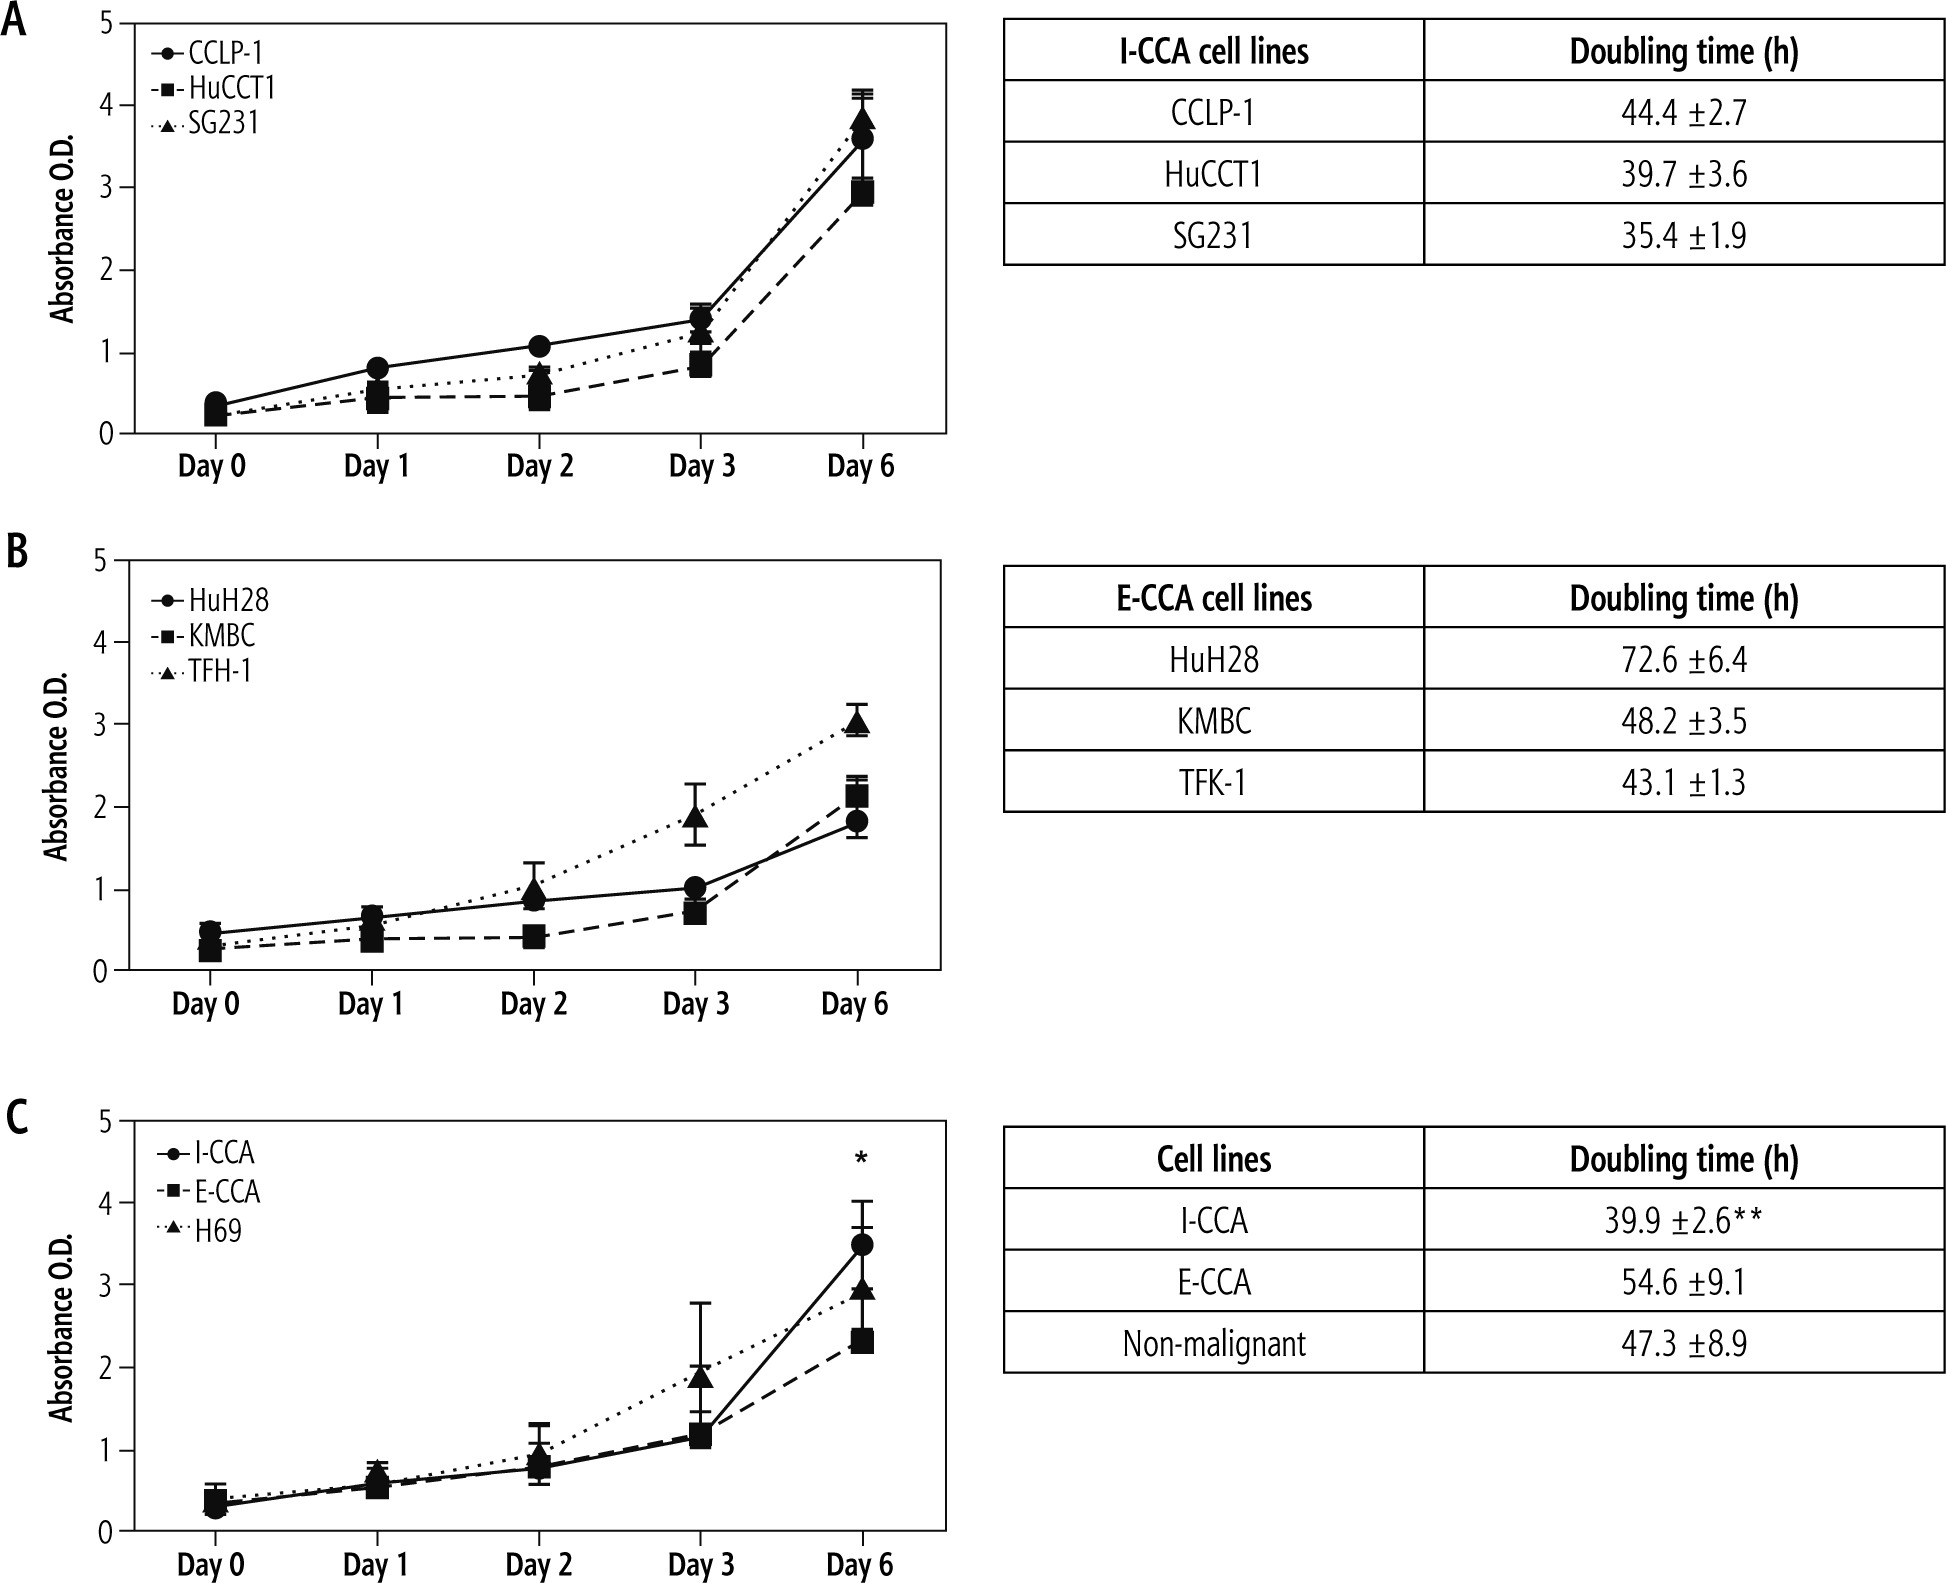
The proliferative activities of the three I-CCA, three E-CCA and one non-malignant H69 cholangiocyte cell lines were determined by the WST-1 assay. The results are shown in Figure 1. The mean proliferation rates of I-CCA cells were similar to those of E-CCA cells until day 6, when they were significantly higher in I-CCA cells (3.49 ±0.51 vs. 2.35 ±0.58, p < 0.05). In addition, the overall doubling time for I-CCA cells was significantly shorter in I-CCA (39.9 ±2.6 hours) versus E-CCA (54.6 ±9.1 hours) cells (p < 0.01). The doubling time of non-malignant H69 cholangiocytes was intermediate between I-CCA and E-CCA cells (47.3 ±8.9 hours).
Fig. 1
Proliferative activity of individual/aggregated I-CCA, E-CCA and non-malignant H69 cholangiocyte cell lines. Five thousand cells of each cell line were cultured for 1, 2, 3, and 6 days. Proliferative activity was significantly higher in aggregated I-CCA vs. E-CCA cell lines on day 6 and overall doubling times were shorter in aggregated I-CCA vs. E-CCA cell lines. Data presented as the mean ±SD from a minimum of three experiments. *p < 0.05, **p < 0.01 I-CCA vs. E-CCA
Colony formation
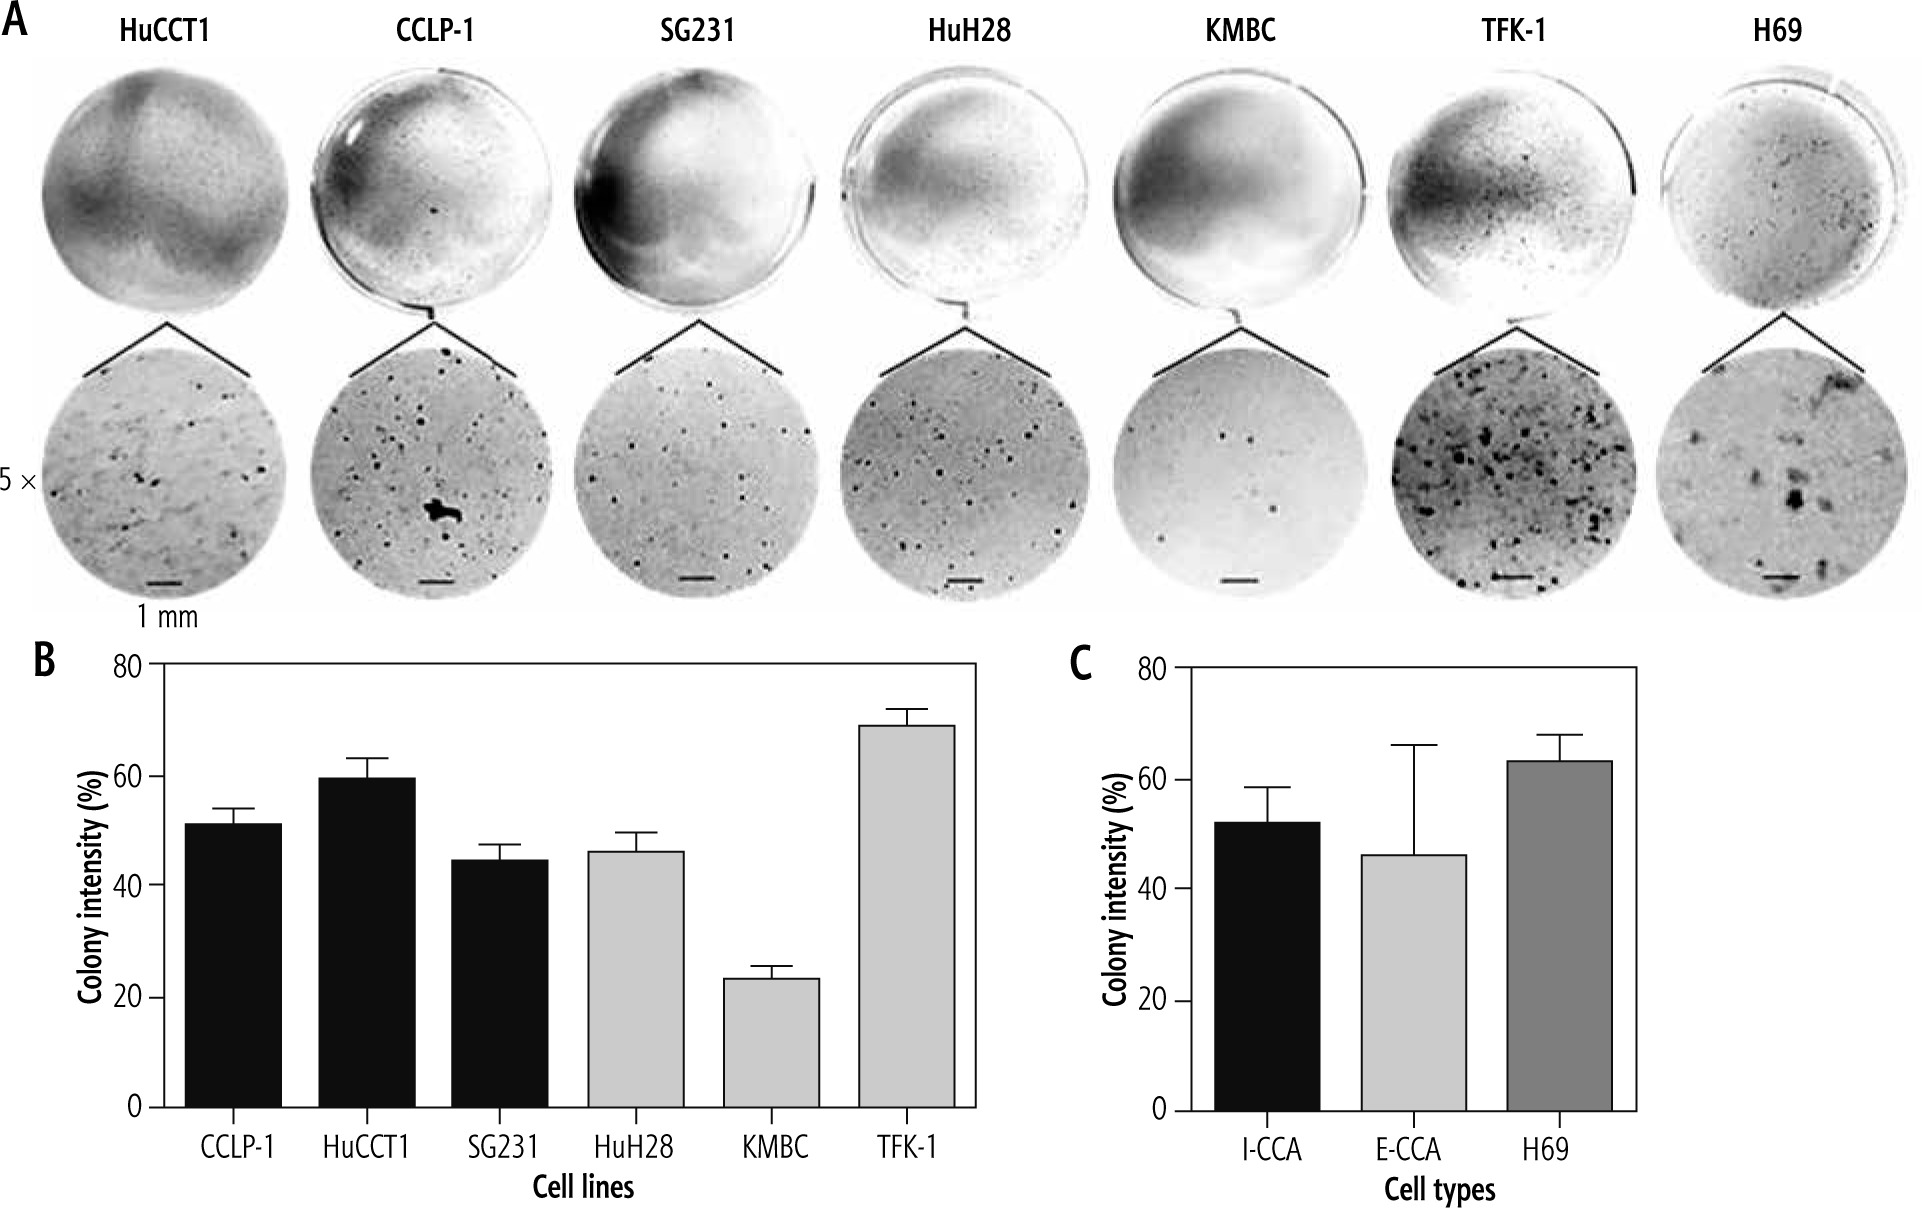
The results of colony formation in soft-agar gels are shown in Figure 2. There were no significant differences in the colony intensities of I-CCA and E-CCA cell lines (51.3 ±7.4% vs. 45.9 ±20.1%, respectively, p = 0.46). The colony intensity of non-malignant H69 cholangiocytes was somewhat higher (63.0 ±4.97%) but not significantly different from that of I-CCA or E-CCA cell lines.
Fig. 2
Colony formation of individual/aggregated I-CCA, E-CCA and non-malignant H69 cholangiocyte cell lines. A) Soft-agar colony formation in each cell line after 21 days of incubation. The lower panels are 5× the optical zoom of corresponding soft agar plates. B, C) Quantification of colony intensity for individual cell lines and aggregates of I-CCA and E-CCA cell lines by ImageJ analysis. Data presented as the mean ±SD from a minimum of three experiments. Scale bar: 1 mm
Spheroid formation
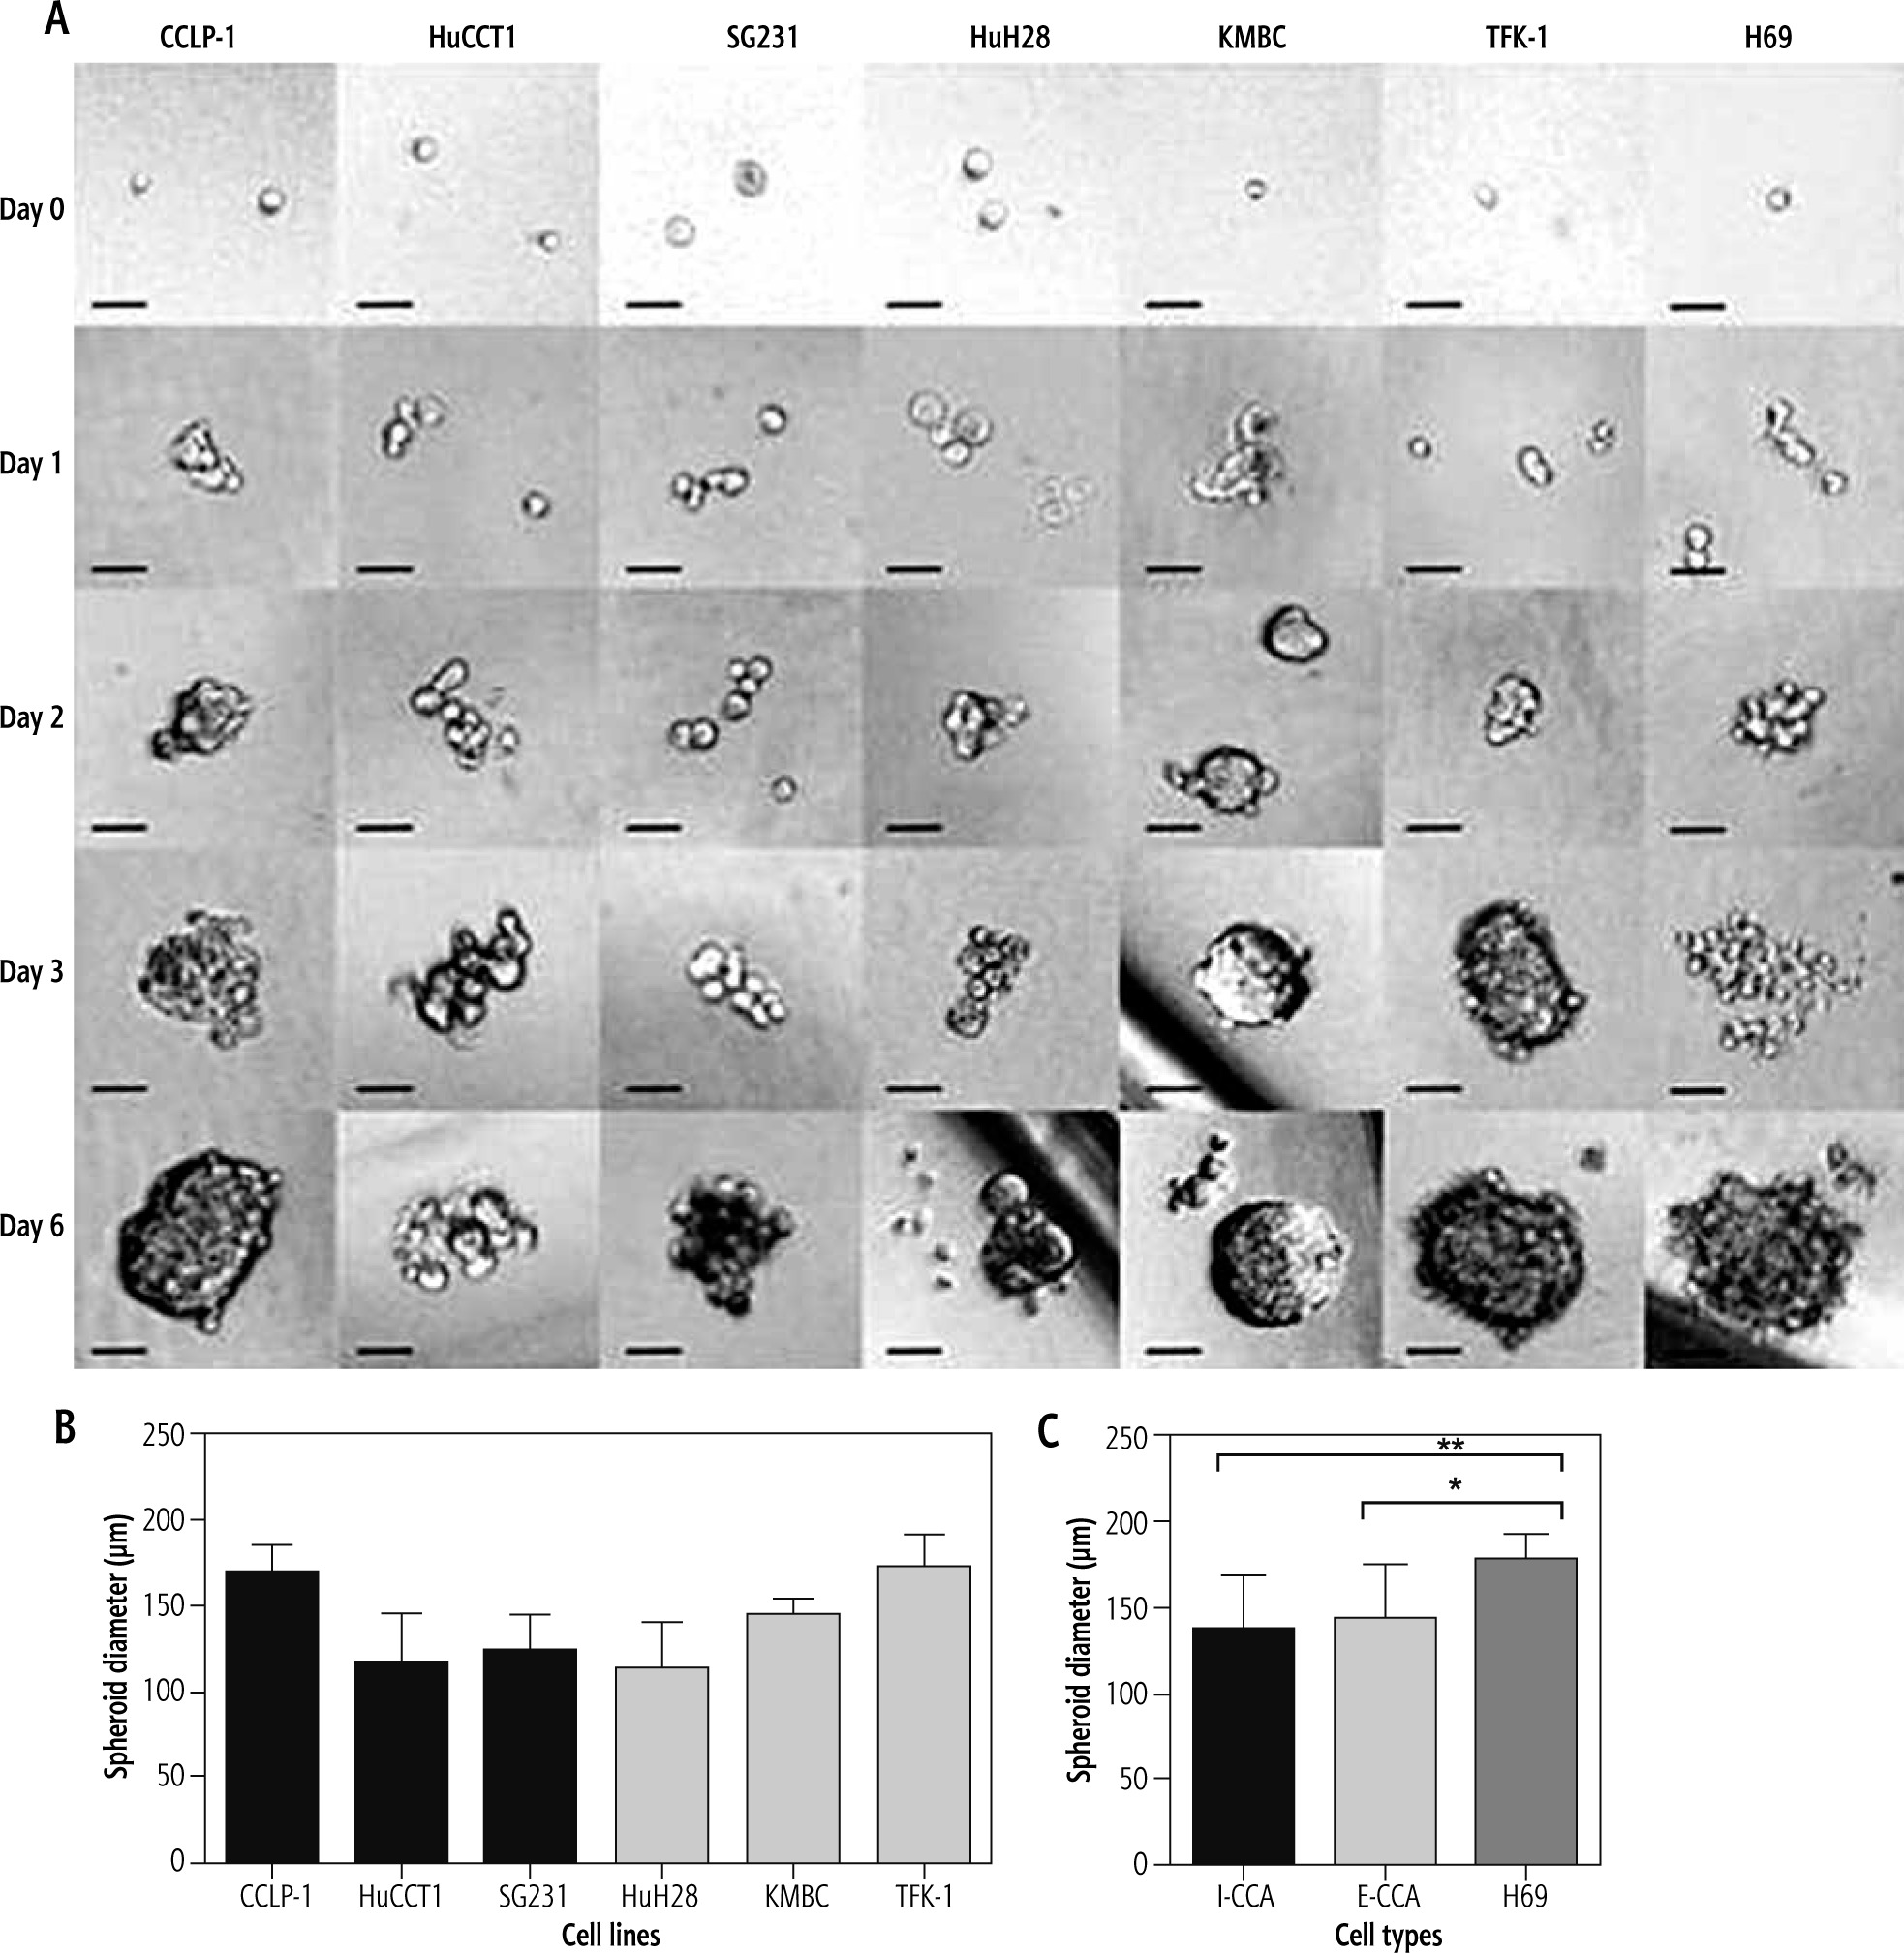
The mechanism responsible for spheroid formation in I-CCA and E-CCA cells was somewhat different in that I-CCA cells tended to develop spheroids as a result of single cell proliferative activity, whereas in E-CCA cells the process predominantly consisted of the aggregation of multiple cells. Nonetheless, the mean diameters of I-CCA and E-CCA spheroids at day 6 were similar (137 ±32.1 µm and 144 ±31.0 µm respectively, p = 0.40) and significantly smaller than those observed with non-malignant H69 cholangiocytes (177 ±15.8 µm, p < 0.001 and 0.01, respectively) (Fig. 3).
Fig. 3
Spheroid formation of individual/aggregated I-CCA, E-CCA and non-malignant H69 cholangiocyte cell lines. Cells were seeded at densities of 2000 cells/ well in ultra-low 96-well plates to generate spheroids. A) Spheroid formation from days 0 to 6. B, C) Spheroid diameters documented by ImageJ analysis. Data presented as the mean ±SD from a minimum of three experiments. Scale bar: 50 μm. *p < 0.01, **p < 0.001
Migration
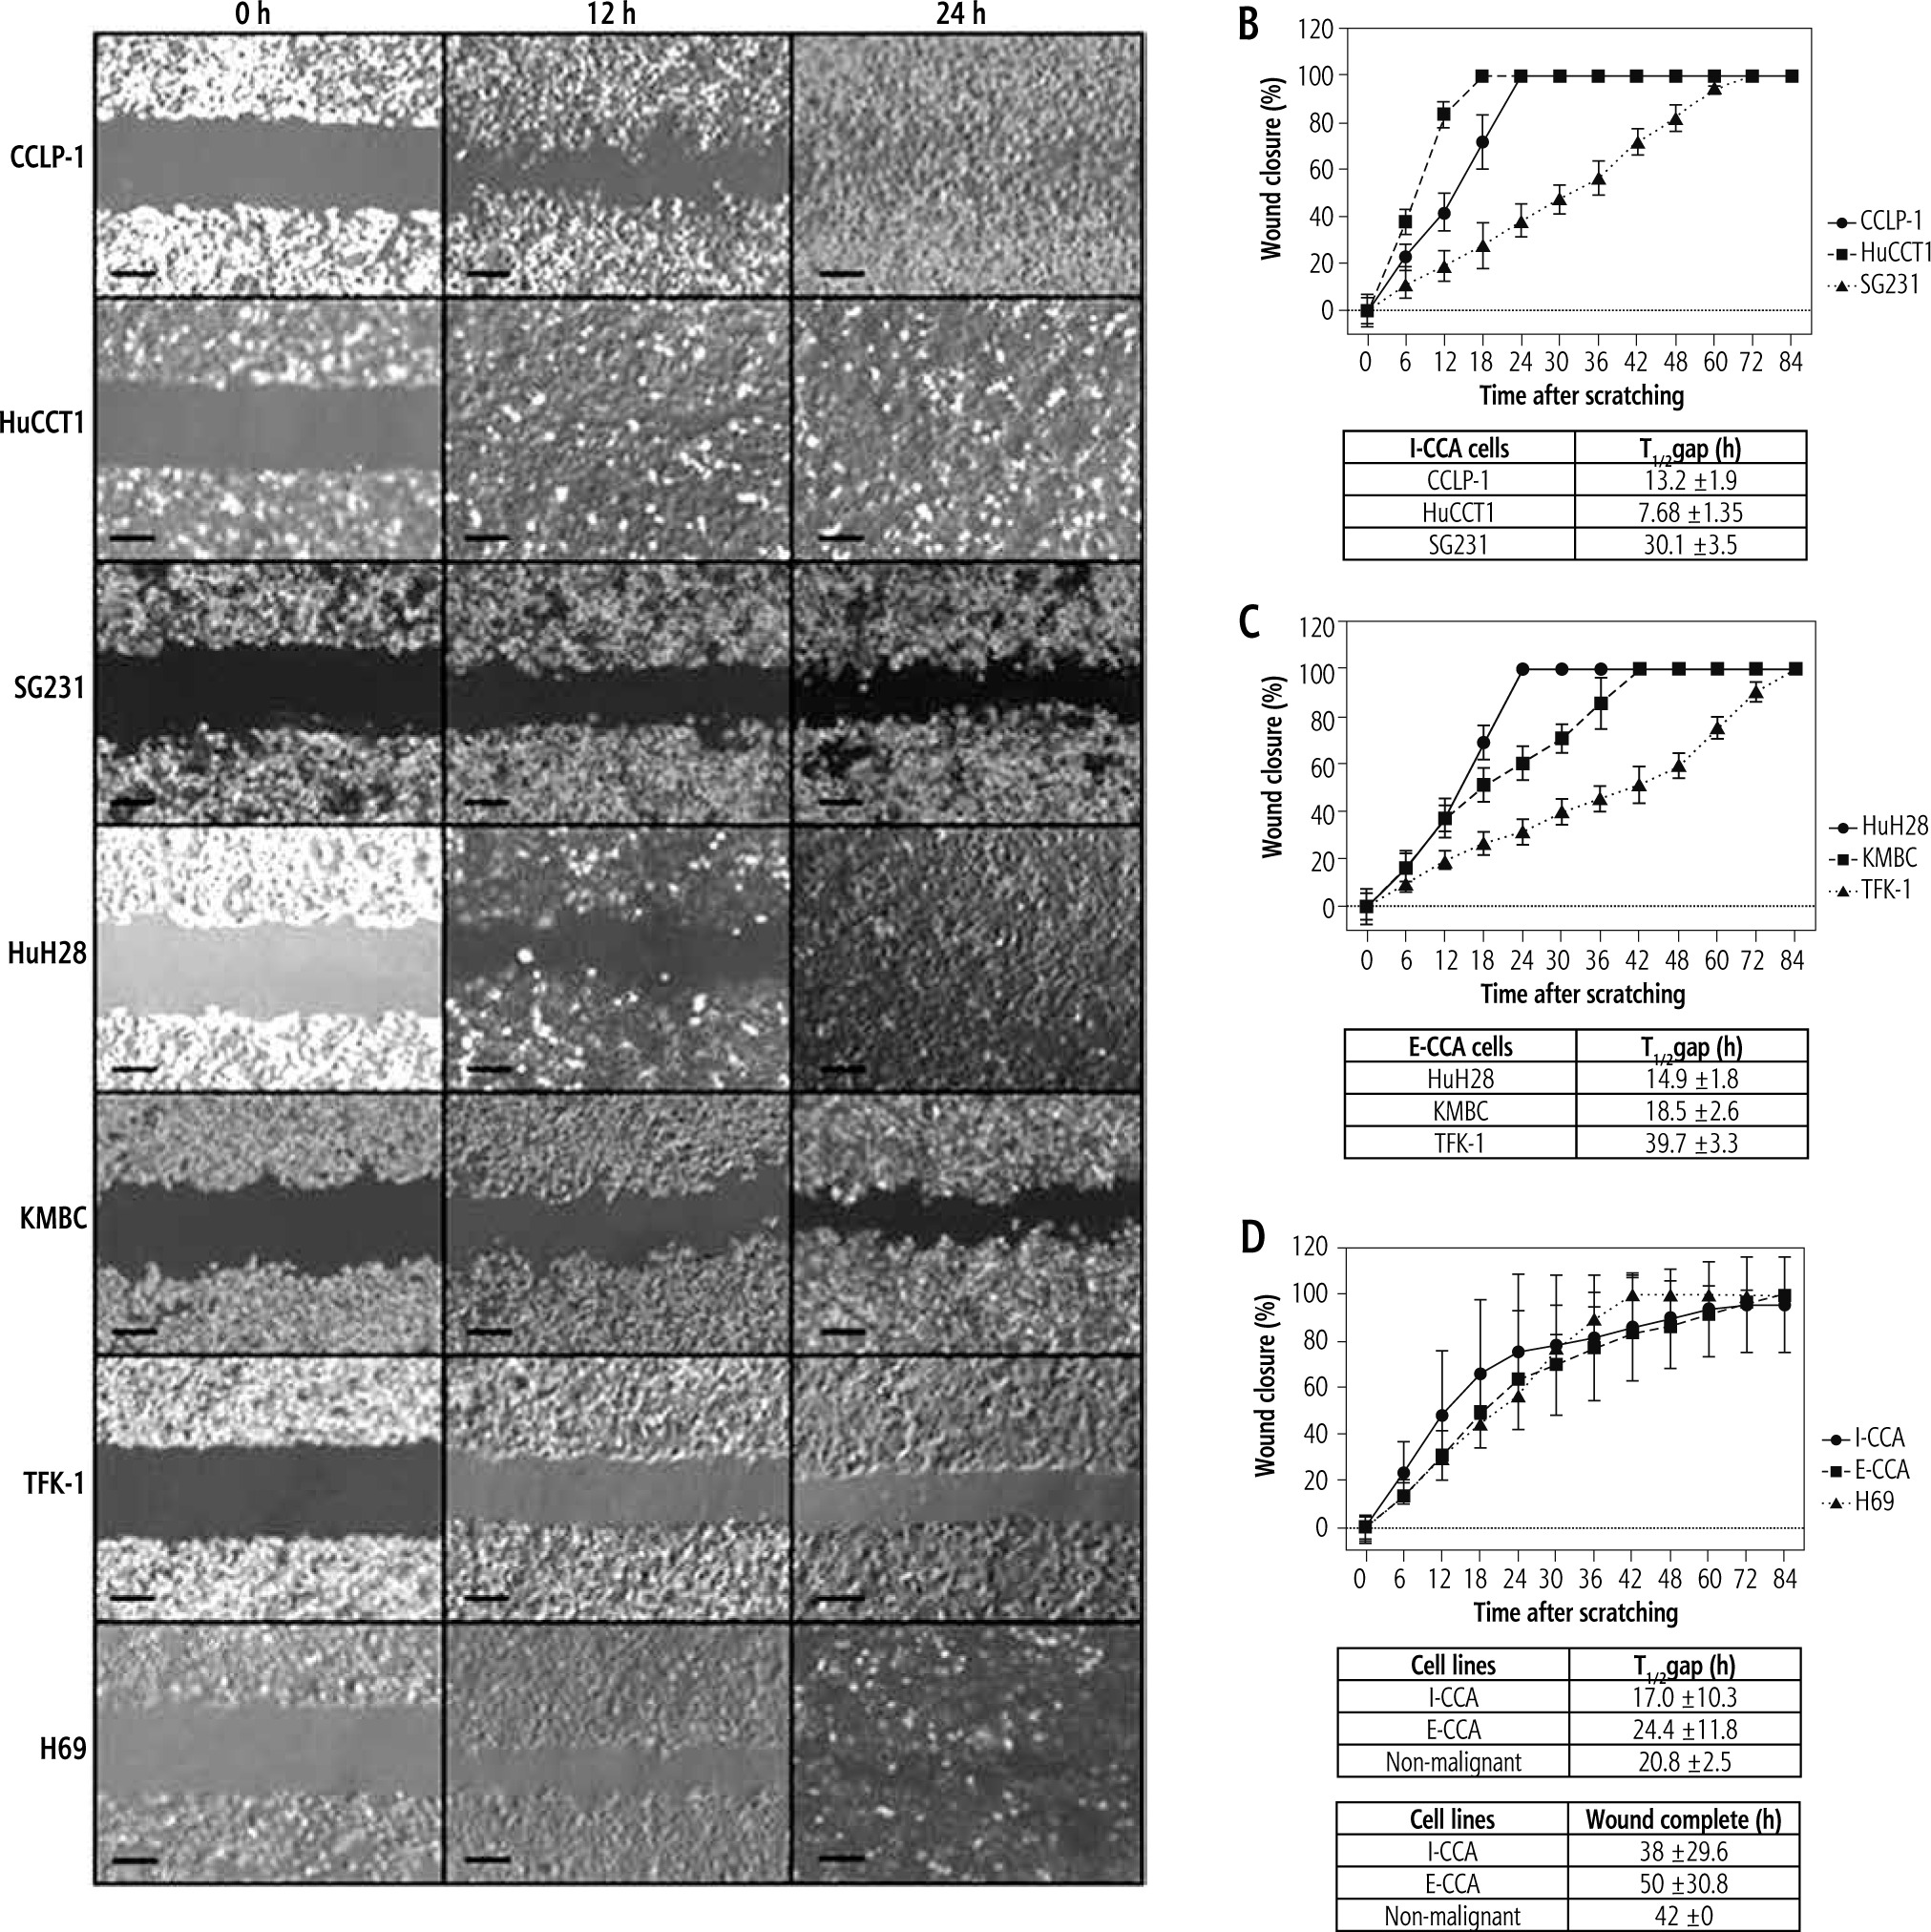
Figure 4 provides representative photographs of wound healing assays at three time points: 0, 12 and 24 hours for I-CCA, E-CCA and non-malignant H69 cholangiocytes. There was significant cell line specific heterogeneity. Specifically, SG231 I-CCA cells exhibited delayed wound closure compared to CCLP-1 and HuCCT1 cells, whereas for E-CCA cells, TFK-1 closure was significantly delayed relative to HuH28 and KMBC cells. However, the mean aggregated times to one half wound closure (17.0 ±10.3 hours for I-CCA and 24.4 ±11.8 hours for E-CCA cell lines) were similar (p = 0.179), as were the times to complete wound closure (38.0 ±29.6 vs. 50.0 ±30.8 hours respectively, p = 0.652). One half and complete wound closure times for non-malignant H69 cholangiocytes (20.8 ±2.5 and 42.0 ±0.0 hours respectively) were similar to those observed in I-CCA and E-CCA cell lines.
Fig. 4
Wound healing assay of individual/aggregated I-CCA, E-CCA and non-malignant H69 cholangiocyte cell lines. A) Phase contrast of cell migration photographed at 0, 12, and 24 hours after scratching. B-D) ImageJ analysis of cell migration by measuring area closure from phase-contrast images. T1/2gap: time for wound to close to 50% of original area. Data presented as the mean ±SD from a minimum of three experiments. Scale bar: 250 μm
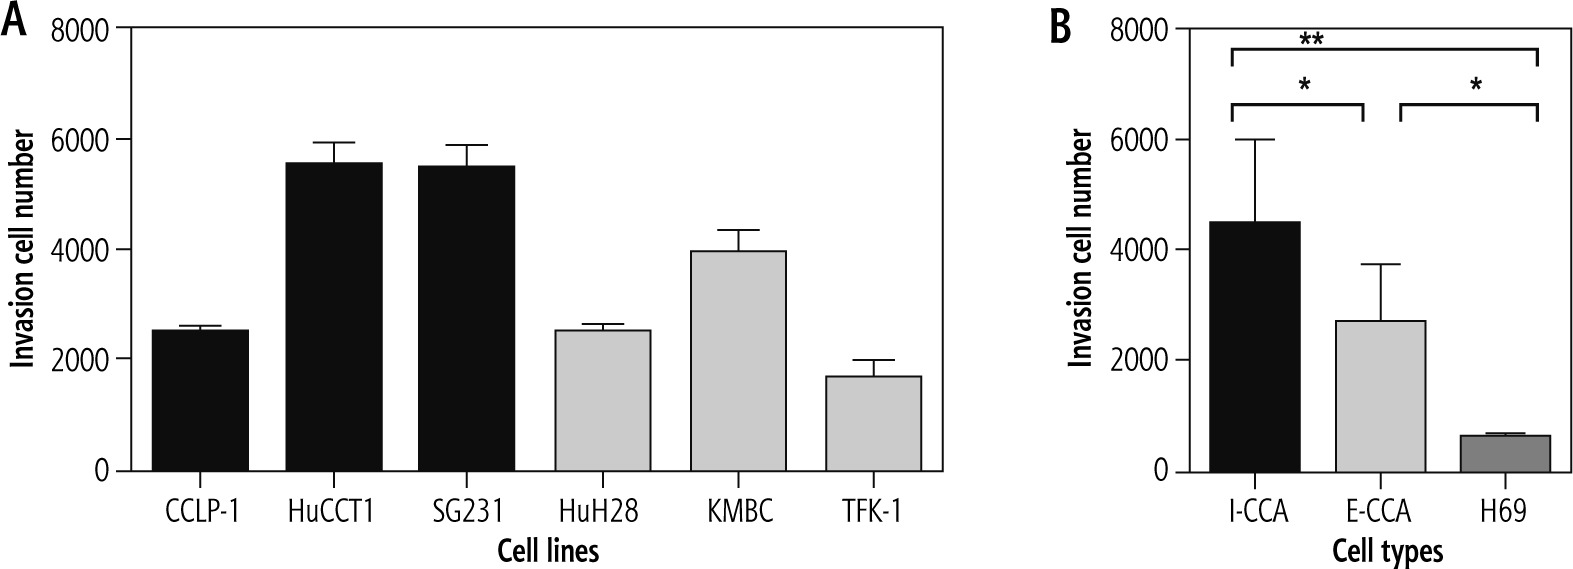
Invasion
Figure 5 illustrates the results of cell invasion experiments for I-CCA, E-CCA and non-malignant H69 cholangiocyte cell lines. In general, I-CCA cell lines invaded Transwell chambers to a greater extent than E-CCA cell lines (cell numbers: 4,466 ±1,531 vs. 2,692 ±1,030, p < 0.05). Both tumor cell lines invaded to a greater extent than non-malignant H69 cholangiocytes (562 ±78.9, p < 0.001 and 0.05, respectively).
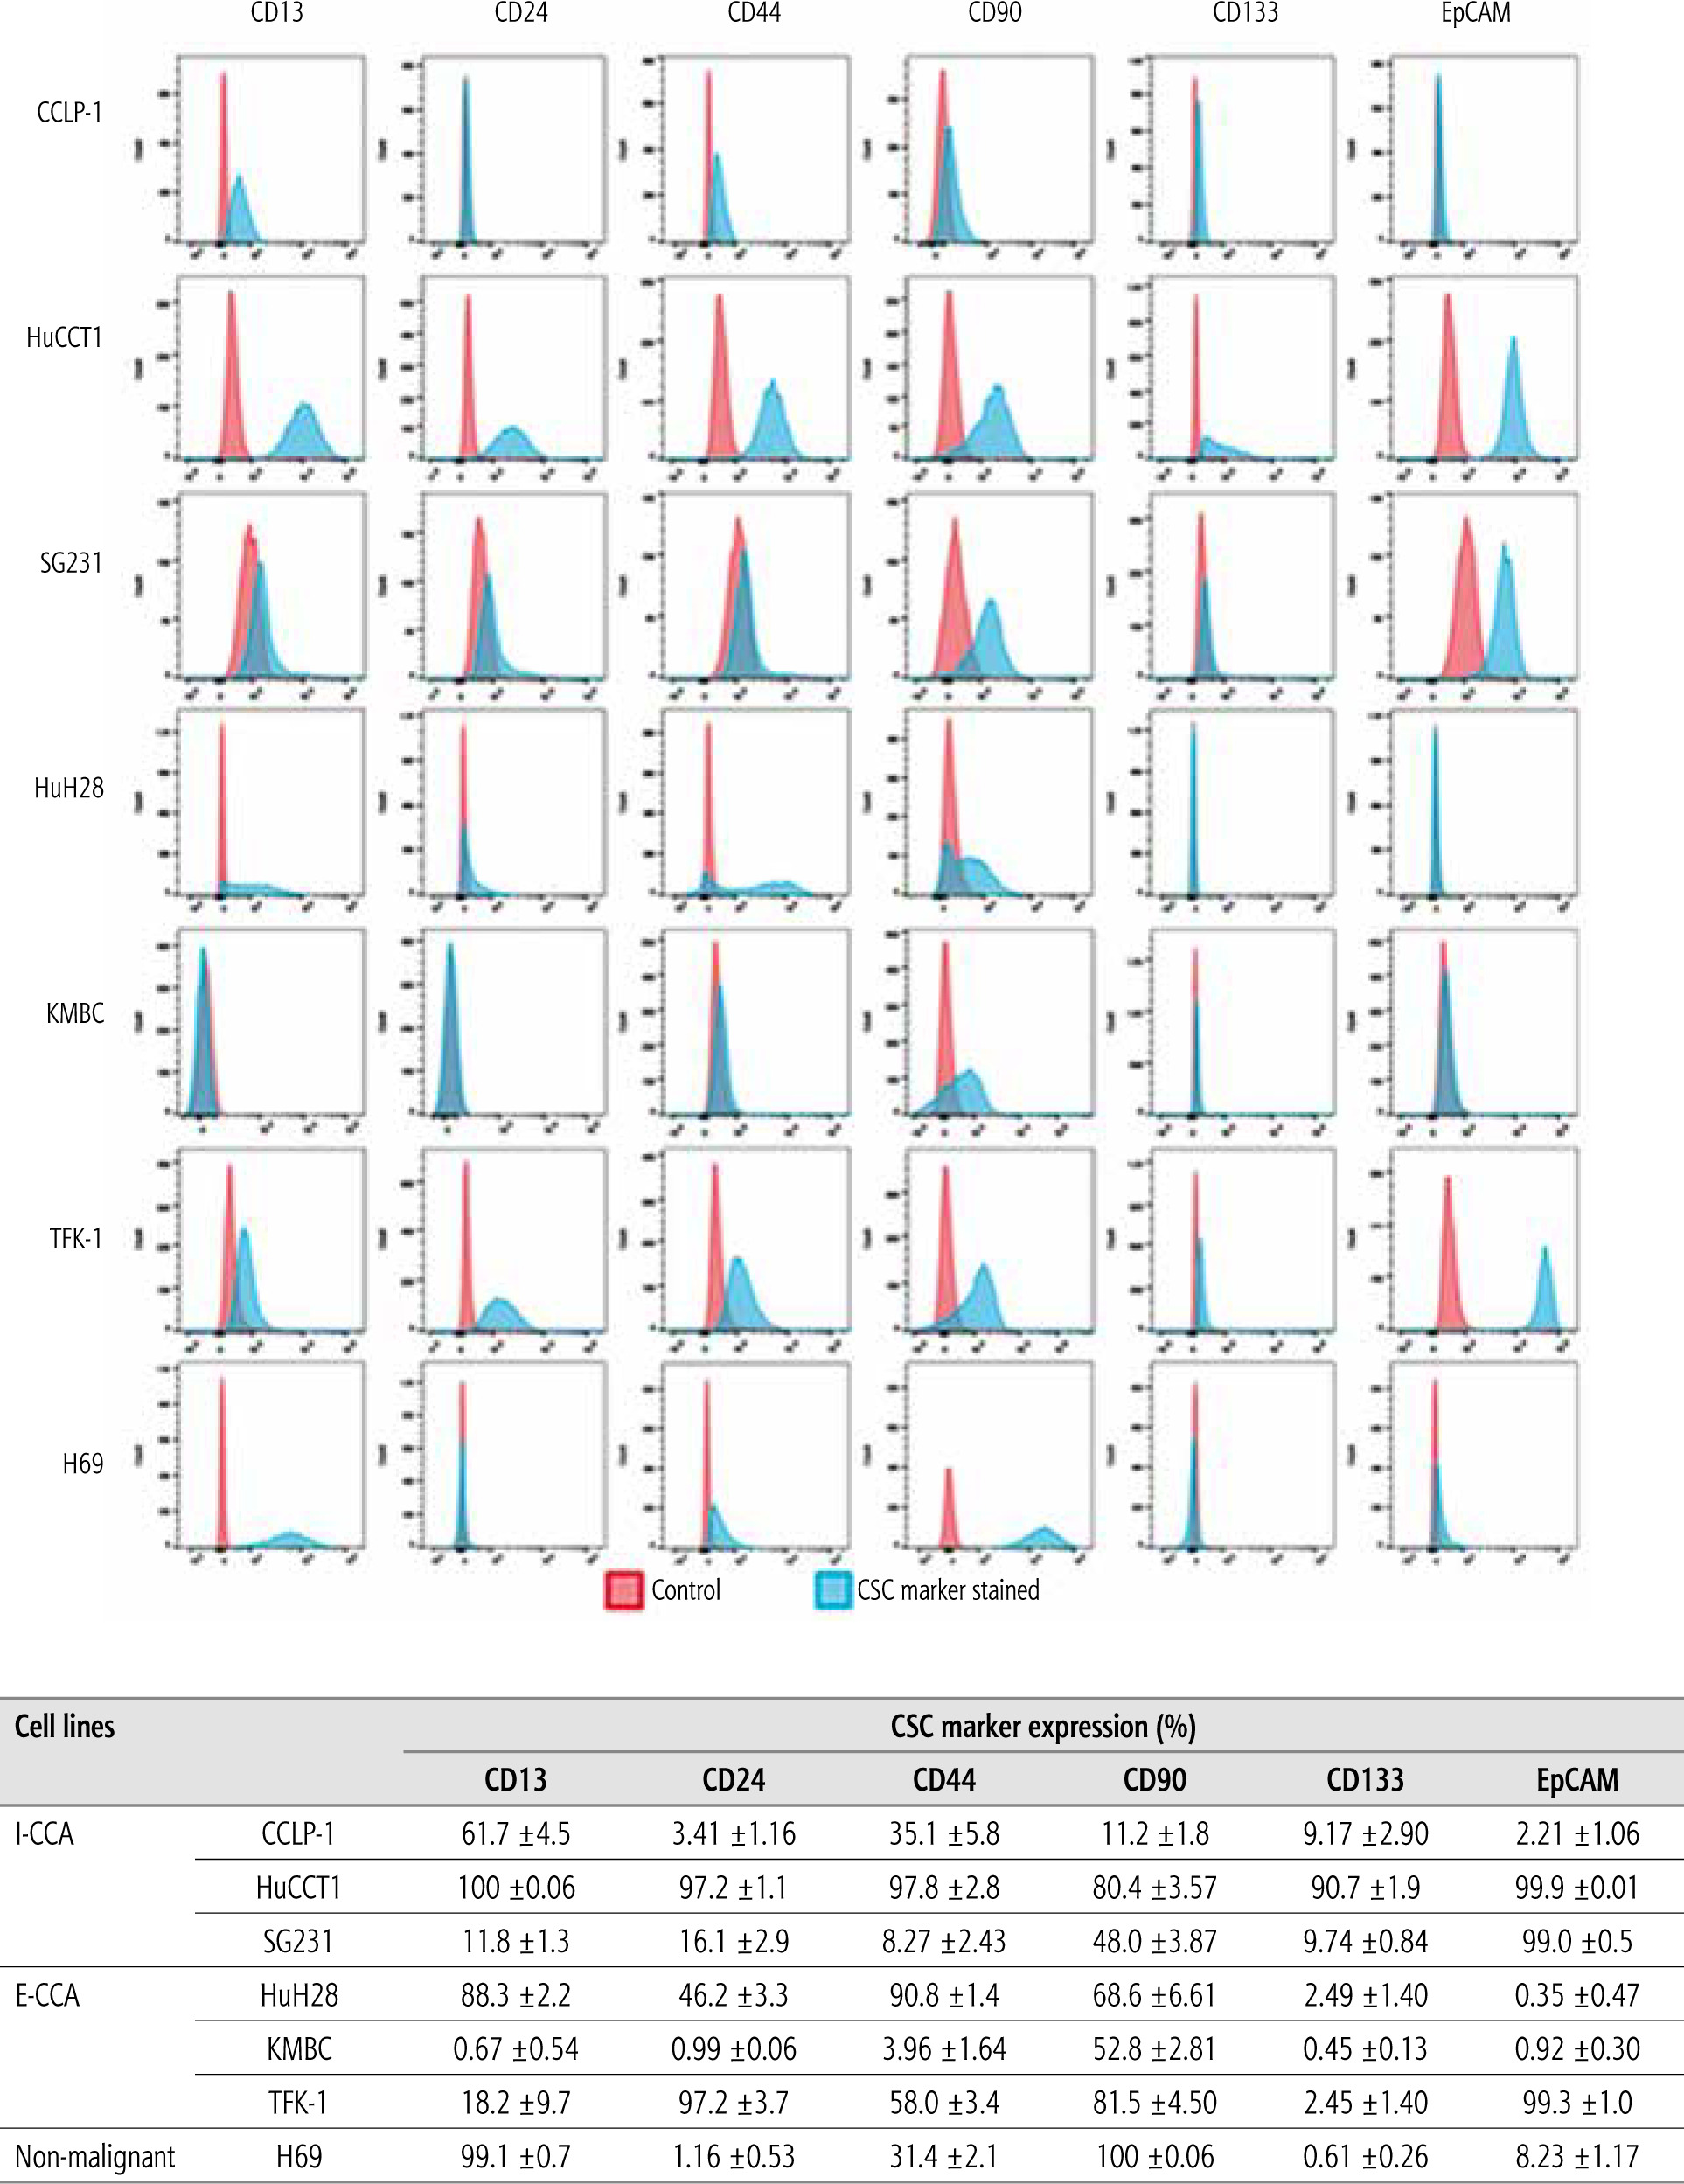
CSC prevalence and SCSM expression
By employing flow cytometry, the prevalence and distribution of SCSMs – CD13, CD24, CD44, CD90, CD133 and EpCAM – were documented (Fig. 6). Among the six CCA cell lines, HuCCT1 cells appeared to have the highest expression of all six stem cell surface markers, while few KMBC cells expressed these markers other than CD90, which was expressed by 53% of KMBC cells. Other cell lines expressed intermediate prevalence of cell surface markers. Overall, there were no significant differences in the prevalence of CSCs or SCSMs between I-CCA and E-CCA cell lines. Almost all non-malignant H69 cholangiocytes expressed CD13 and CD90.
Fig. 6
Expression of stem cell surface markers (SCSMs) in cancer stem cell (CSC) in I-CCA (CCLP-1, HuCCT1, SG231), E-CCA (HuH28, KMBC, TFK-1) and nonmalignant H69 cholangiocyte cell lines. Cells were stained with isotype-matched mABs (IgG1) or fluorescence-conjugated mAbs against CD13, CD24, CD44, CD90, CD133, and EpCAM and analyzed by flow cytometry. A) Cells stained with IgG1 (control/red color) and mAbs against the SCSM (blue color). B) Prevalence of SCSM positive population in each cell line. Data presented as the mean ±SD from triplicate experiments
To determine whether SCSMs were consistently expressed (a feature of stem cell replication), cells were cultured for 30 days and marker expression documented at the end of the culture period. As shown in Table 1, there were no significant changes in SCSMs over the 30 day period.
Table 1
Stem cell surface marker expression in I-CCA and E-CCA cells after 30 days in culture
Finally, to determine whether specific SCSMs associate with certain tumor cell growth features, correlation coefficients were calculated for each stem cell marker and cell proliferation, colony/spheroid formation, migration and invasion assays. The results (Table 2) revealed no significant correlations between specific SCSMs and cell growth properties.
Table 2
P-values of correlations between stem cell surface markers and tumor growth features in cholangiocarcinoma cells
Discussion
The results of this study suggest that I-CCA cells proliferate more rapidly and are more invasive than E-CCA cells. However, other tumor cell growth features such as colony/spheroid formation and cell migration were similar in the two cell populations. The results also suggest that differences in cell proliferative activity and invasion cannot be explained by differences in the prevalence and/or SCSM expression profiles of CSCs within the tumor cell populations. Overall, the results support the concept that at least some of the clinical differences in I-CCA and E-CCA growth reflect inherent differences in the two cell populations, but others likely reflect differences in their respective tumor microenvironments.
Numerous previous clinical studies have documented significant differences in I-CCA and E-CCA growth patterns (reviewed in ref. [2]). Specifically, I-CCAs form masses with well demarcated (add space between words) demarcated nodules that grow in a radial pattern. They tend to invade the local microvasculature and develop distant metastases. Microscopically, ductular morphology with mucin production or features of hepatocellular differentiation may be present. E-CCAs on the other hand tend to be sclerosing or polypoid and non-mucin producing [4, 21]. They tend to grow within bile duct lumens, along the bile duct wall or parallel to adjacent tissue planes and tend not to invade or metastasize. In addition, the derivation of I-CCA and E-CCA may differ in that I-CCAs are thought to be derived from the malignant transformation of hepatic stem cells [22, 23], whereas E-CCAs develop as a result of epithelial to mesenchymal transformation of ductular cholangiocytes [21].
Cancer stem cells are a subpopulation of cells that influence tumor growth and progression [6]. Previous studies have documented adverse clinical outcomes in patients with high CSC prevalence [24]. In CCA, Cardinale et al. reported that more than 30% of the human CCA tumor mass consists of CSCs [25]. In the present study, at least one SCSM was expressed in the majority of I-CCA and E-CCA cell lines. However, there was much heterogeneity. For example, 99% of SG231 (I-CCA) cells were EpCAM positive and 48% CD90 positive, while other markers were present in less than 20% of SG231 cells. In HuH28 (E-CCA) cells, 91% expressed CD44, 88% CD13, 69% CD90, 46% CD24, while less than 2% were CD133 and EpCAM positive. Notwithstanding these differences, there was no clear suggestion that I-CCA and E-CCA cell lines had increased (or decreased) CSC prevalence or a predominance of specific SCSMs. Moreover, there were no associations between these SCSMs and tumor cell growth features.
Taken together, the results of this study suggest that both intrinsic differences in cell biology and the influence of the tumor microenvironment are more responsible for determining tumor growth patterns than the prevalence/SCSM expression profiles of CSCs within the tumor. Of note, the specific component(s) of the tumor microenvironment which may include the extracellular matrix, chemokines, bile salts, and neuropeptides have yet to be identified [26, 27].
There are a number of limitations to this study that warrant emphasis. First, although the cell lines studied were designated I-CCA or E-CCA by their sources [16, 28], controversy exists regarding such classifications, particularly for cells derived from tumors within the hilar region of the liver. This concern is underscored by the uncertainty of the derivation of HuH28 cells, which have been considered I-CCA by some investigators and E-CCA by others [16, 28]. Second, although H69 cholangiocytes are considered non-malignant, they are SV40-transformed (i.e. immortalized) and therefore possess anti-apoptotic properties, and cannot be considered normal cholangiocytes. This distinction was apparent in their ability to form colonies/spheroids and their expression of certain SCSMs. Finally, future in vivo studies are required to compare the relative contributions of tumor cells and the microenvironment to tumor growth. Such experimentation is also required to identify the specific features within the tumor microenvironment responsible for any differences observed.
In conclusion, while cell proliferation and invasion are significantly increased in I-CCA compared to E-CCA cells, other tumor cell properties are similar in the two cell populations. In addition, the prevalence and SCSM expression profiles of CSCs within I-CCA and E-CCA cells are similar and do not associate with specific tumor cell growth features. Overall, these findings contribute to our understanding of the differences in the clinical courses of I-CCA and E-CCA in humans.


