
Introduction
Gallbladder cancer (GBC) is a rare biliary tract malignancy with distinct ethnic and geographical variations [1]. It is highly prevalent in North India, with a reported incidence of 10-22/100,000 in women [2]. It carries a dismal prognosis with a reported 5-year survival rate of around 5% [3]. Signs and symptoms are often absent and nonspecific until late stages, leading to delayed diagnosis and difficulty in treatment [1].
Surgery is the only curative treatment but can be offered only in a small proportion of patients with advanced disease. Even in patients with advanced GBC who undergo surgery, recurrence and metastasis are common and the long-term survival rate is less than 30% [3]. Preoperative diagnosis, especially in the laparoscopic era, is important to choose the correct surgical method and avoid reoperations [4]. Apart from correct preoperative diagnosis, it is important to identify histological type, histological grade, and stage of GBC for treatment planning and prognostication [5-7]. Typically, low grade GBC identified at an earlier stage has a better prognosis when managed with radical surgery [6]. Intensive postoperative surveillance can be adopted in high-risk groups to detect early recurrence and metastasis [7].
Imaging plays an integral role in the diagnosis and staging of GBC. Cross sectional imaging provides comprehensive anatomical information allowing assessment of staging and resectability [8, 9]. Despite the advances in imaging techniques, characterization of gallbladder lesions poses a significant challenge [10-12]. Incidental GBC identified during or after surgery accounts for 15-30% of all GBCs [4].
Currently, histological evaluation, molecular typing and grading of GBC are performed on tissue samples obtained before or after surgery [13, 14]. Fine needle aspiration and biopsy are invasive procedures with risk of inadequate sampling, bile contamination, and needle tract seeding [15-18]. Conventional imaging techniques are unable to predict histological type and grade and prognosticate patients based on the imaging characteristics.
Radiomics is a rapidly growing field of radiology research [19]. It allows extraction of quantitative data from routinely acquired radiological images. These data can be used to decode tumour phenotype and heterogeneity, which are surrogate markers of biological aggressiveness, allowing prognostication, therapy, and response prediction [20, 21]. A few previous studies have evaluated the clinical utility of radiomic features of biliary tract cancer and other abdominal malignancies [22-26]. However, to the best of our knowledge, no dedicated study on radiomics in GBC has been conducted until now.
The purpose of our pilot study was to identify the radiomic signature of GBC based on computed tomography (CT)-based texture analysis. The aim was to predict the clinical outcomes of patients with GBC based on CT radiomic features.
Material and methods
This was a retrospective study of consecutive patients with clinically suspected GBC presenting to the department of surgical gastroenterology of a tertiary care referral hospital between January 2017 and January 2020. The study was approved by the institutional ethics committee. In view of retrospective nature of the study, written informed consent was not obtained. Patients with suspicion of GBC based on clinical evaluation and imaging, who underwent CT scans in our institute, were considered eligible for inclusion. The CT images, clinical, and histological or cytological data were retrieved from the database. Patients in whom the pre-operative CT images in Digital Imaging and Communications in Medicine (DICOM) format were unavailable, those with incomplete clinical data, and those in whom the cytology or histology was not performed, or the details were not available, were excluded.
Image acquisition
CT examination: CT scans were acquired on multidetector-row CT scanners (64, 128, or 256-detector row scanners, ACT, GE Health care; Somatom definition flash, Siemens Healthcare; Philips iCT, respectively). The acquisition comprised multiphase CT examination with an arterial and portal venous phase following intravenous injection of non-ionic contrast (Omnipaque 300, GE healthcare). The arterial phase scans were acquired following injection of contrast at the rate of 4-5 ml/s using bolus tracking technique, whereby the acquisition was triggered when attenuation of more than 150 HU was achieved in the region of interest placed over the abdominal aorta at the level of T12. The portal venous scans were acquired at 65 seconds from the start of contrast injection. The arterial phase scans were acquired from the dome of diaphragm to the lower edge of the liver and portal venous scans were acquired from the level of domes of diaphragm to the pubic symphysis. The scan parameters were tube current 300 mAs, voltage 120 kVp, pitch 0.993, field of view (FOV) 350 mm and slice thickness 1 mm.
Image analysis
CT images were reviewed by two radiologists, with 2 years (PR) and 8 years (PG) of experience in reading abdominal CT scans, in consensus. The radiologists were blinded to the clinical, cytological, and histological data. The anatomical imaging features of gallbladder lesions including type (mass replacing gallbladder fossa, polypoidal intraluminal mass, or mass with associated gallbladder wall thickening), size, extent, local invasion, biliary involvement, gallstones, ascites and liver, lymph node and omental metastases were recorded. A single axial CT section in the venous phase depicting the maximum extent of the disease was selected for texture analysis. The imaging data were anonymised and transferred to a commercially available research software (TexRAD, Feedback Medical Limited, London, England) platform for extraction of radiomic features.
Surgical details of patients were recorded. Histological or cytological data were retrieved, and diagnosis, type of cancer, and grade were recorded.
Follow-up
Patients were followed up until death or 31st July 2020 if they were still alive. Overall survival was defined as the time (months) between date of diagnosis and last follow-up (alive or death).
CT texture analysis
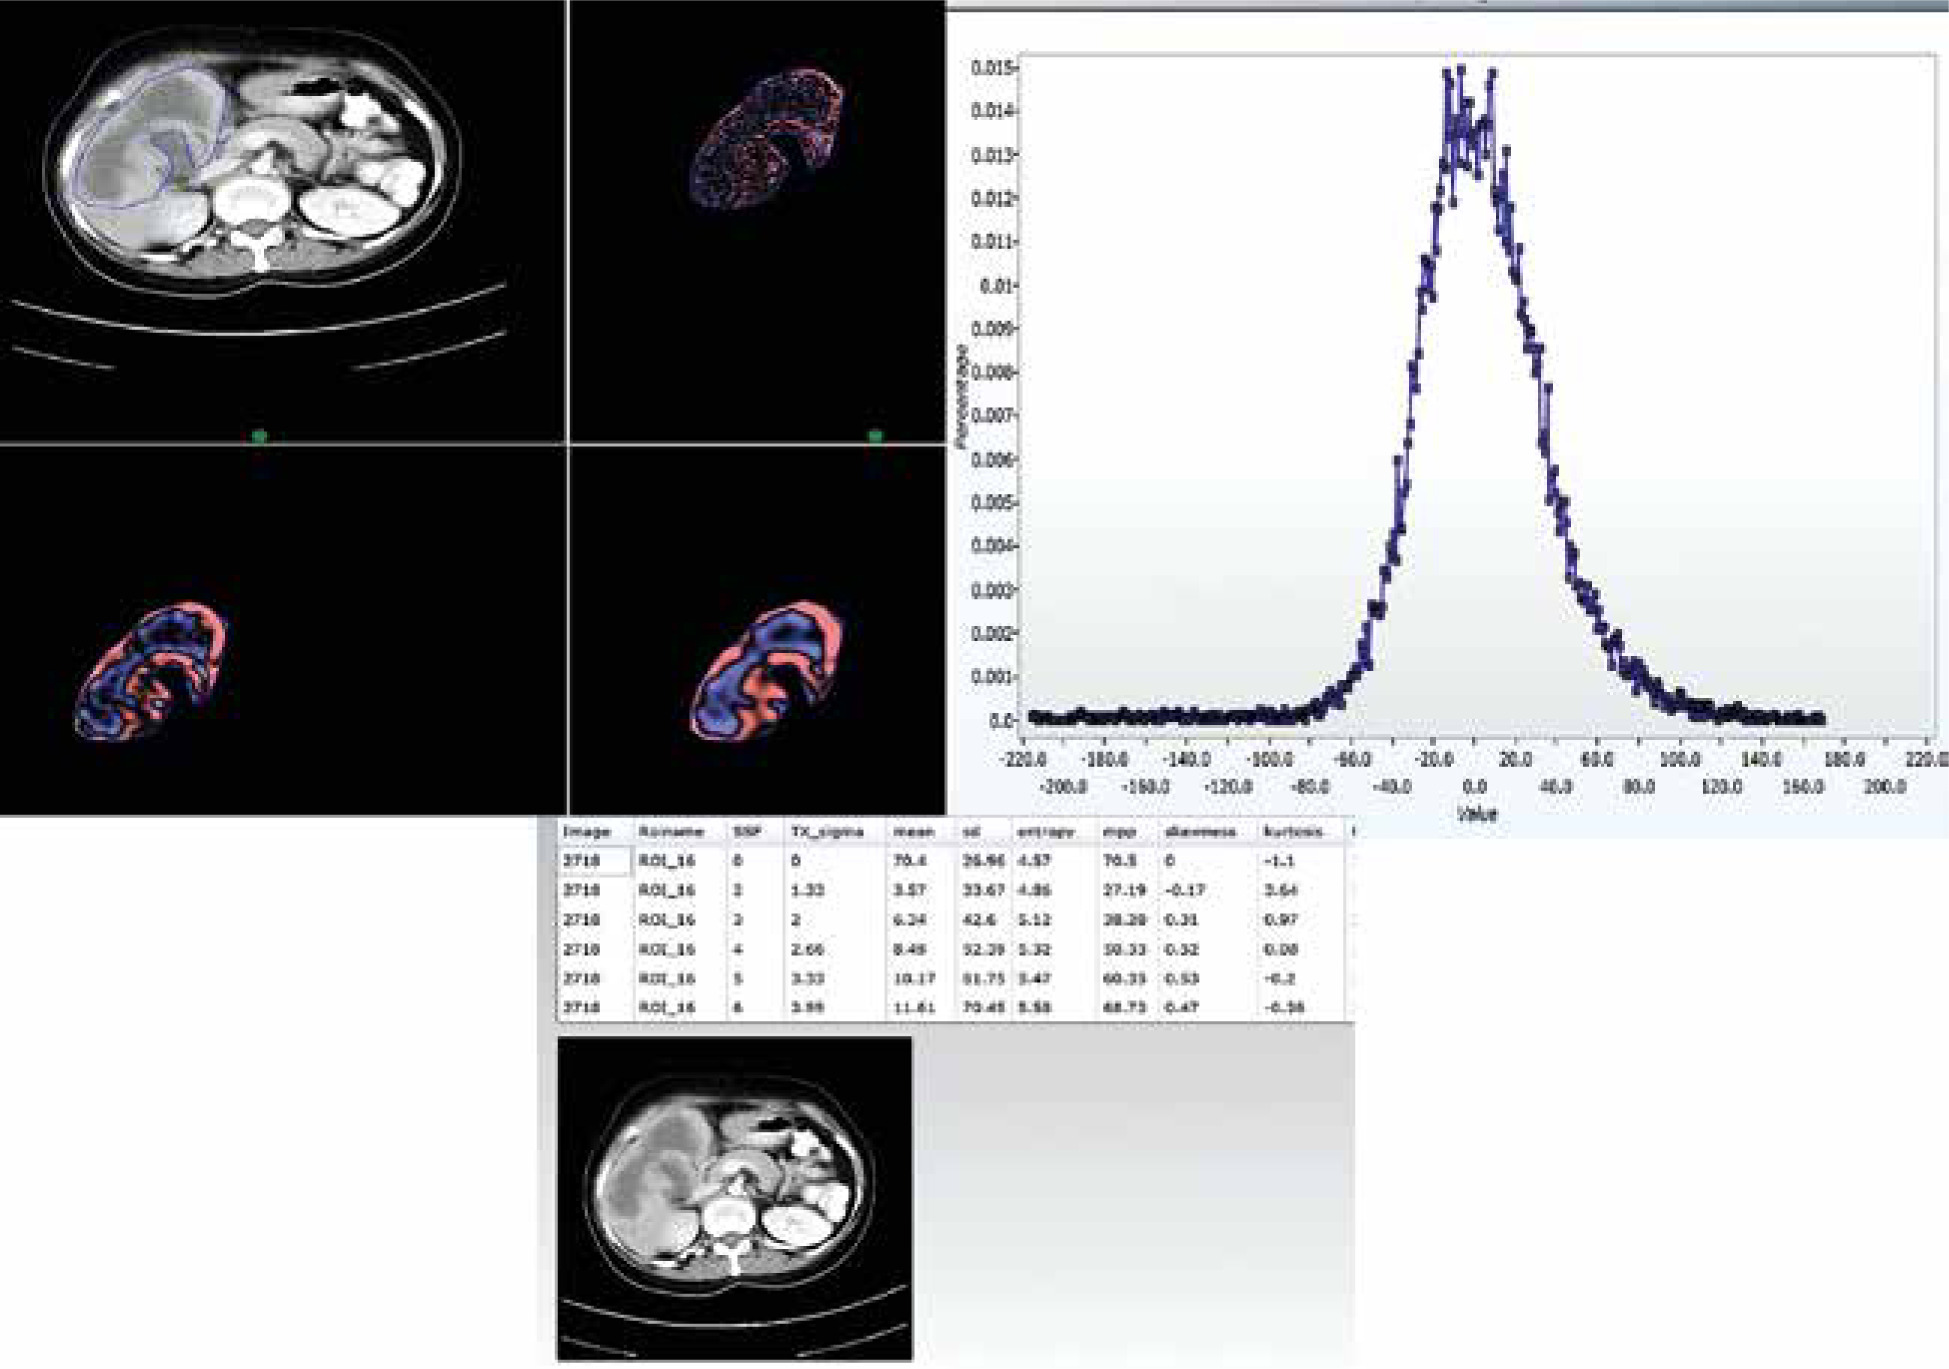
The ROI was drawn including the entire lesion using free hand technique. Areas of fat, air, dense calcification, or bone were excluded. To achieve this, the range of pixels was set between –50 and 200 HU within the ROI [20]. CT texture analysis (CTTA) assessed the heterogeneity within each ROI on the CT axial image using a filtration-histogram based textural analysis (TA) technique. The filtration step using a band-pass Laplacian of Gaussian (LoG) filter (similar to non-orthogonal wavelet), consisted of extracting and enhancing image features of different sizes and intensity variation corresponding to the spatial scale of the filter (SSF in radius). The feature scales used ranged from SSF = 2 to 6 mm, where the fine texture scale corresponded to SSF = 2 mm, medium texture scales corresponded to SSF = 3-5 mm and the coarse texture scale corresponded to SSF = 6 mm. Following the filtration step, quantification of texture was undertaken using statistical- and histogram-based parameters at each derived (filter-scale, SSF value) image as well as on the conventional image (without filtration, SSF = 0). Statistical and histogram parameters comprised mean intensity (which reflects average brightness), standard deviation (which reflects width of the histogram or dispersion from the average), entropy (which reflects irregularity), mean number of positive pixels (which reflects average brightness of only positive pixel values), kurtosis (which reflects pointedness or peakedness or sharpness of the histogram distribution) and skewness (which reflects asymmetry of the histogram distribution) [19]. Filtration-histogram based TA has undergone the qualification and validation process as evidenced from several publications in the literature in an oncological and non-oncological setting [20, 21, 27]. A simulation and phantom study by Miles et al. highlighted what the filtration-histogram based TA means and how it reflects different components of heterogeneity (object/feature size, number/concentration of objects/features and variation in intensity of the objects/features in relation to the background) [19]. Figure 1 provides a visual illustration of the filtration-histogram based CTTA for a gallbladder lesion.
Fig. 1
Contrast enhanced axial CT image of a female patient with pathologically proven gallbladder cancer with texture features. A) CT image showing region of interest drawn around tumour (blue line) and corresponding images of fine, medium, and coarse textures. B) Histogram derived from image showing pixel distribution at filter value of 2 mm. C) Table of texture parameters across the different SSF values: 0 – conventional, 2 mm – fine texture scale, 3-5 mm – medium texture scales, and 6 mm – coarse texture scale
Statistical analysis
The Kruskal-Wallis test, Mann-Whitney test and t-test appropriately assessed the ability of CT texture parameters to differentiate between the different patient histological categories and sub-categories (malignancy vs. non-malignancy; well vs. moderately vs. poorly differentiated cancers; metastases vs. no-metastasis). Correlation between the CT texture features and length of overall survival was determined using Spearman’s rank correlation (rs). Univariate KaplanMeier survival analysis assessed the ability of CTTA to predict overall survival at the optimal cut-off value for each texture metric. The log-rank test assessed the difference between the survival curves for good and poor prognostic patient groups. Multivariate analysis was performed using logistic regression to identify the factors predictive of overall survival. Statistical analysis was carried out using SPSS (IBM Corp. Released 2017. IBM SPSS Statistics for Macintosh, Version 25.0. Armonk, NY: IBM Corp.) with a p value < 0.05 considered to be significant.
Results
Demographic details and baseline imaging characteristics
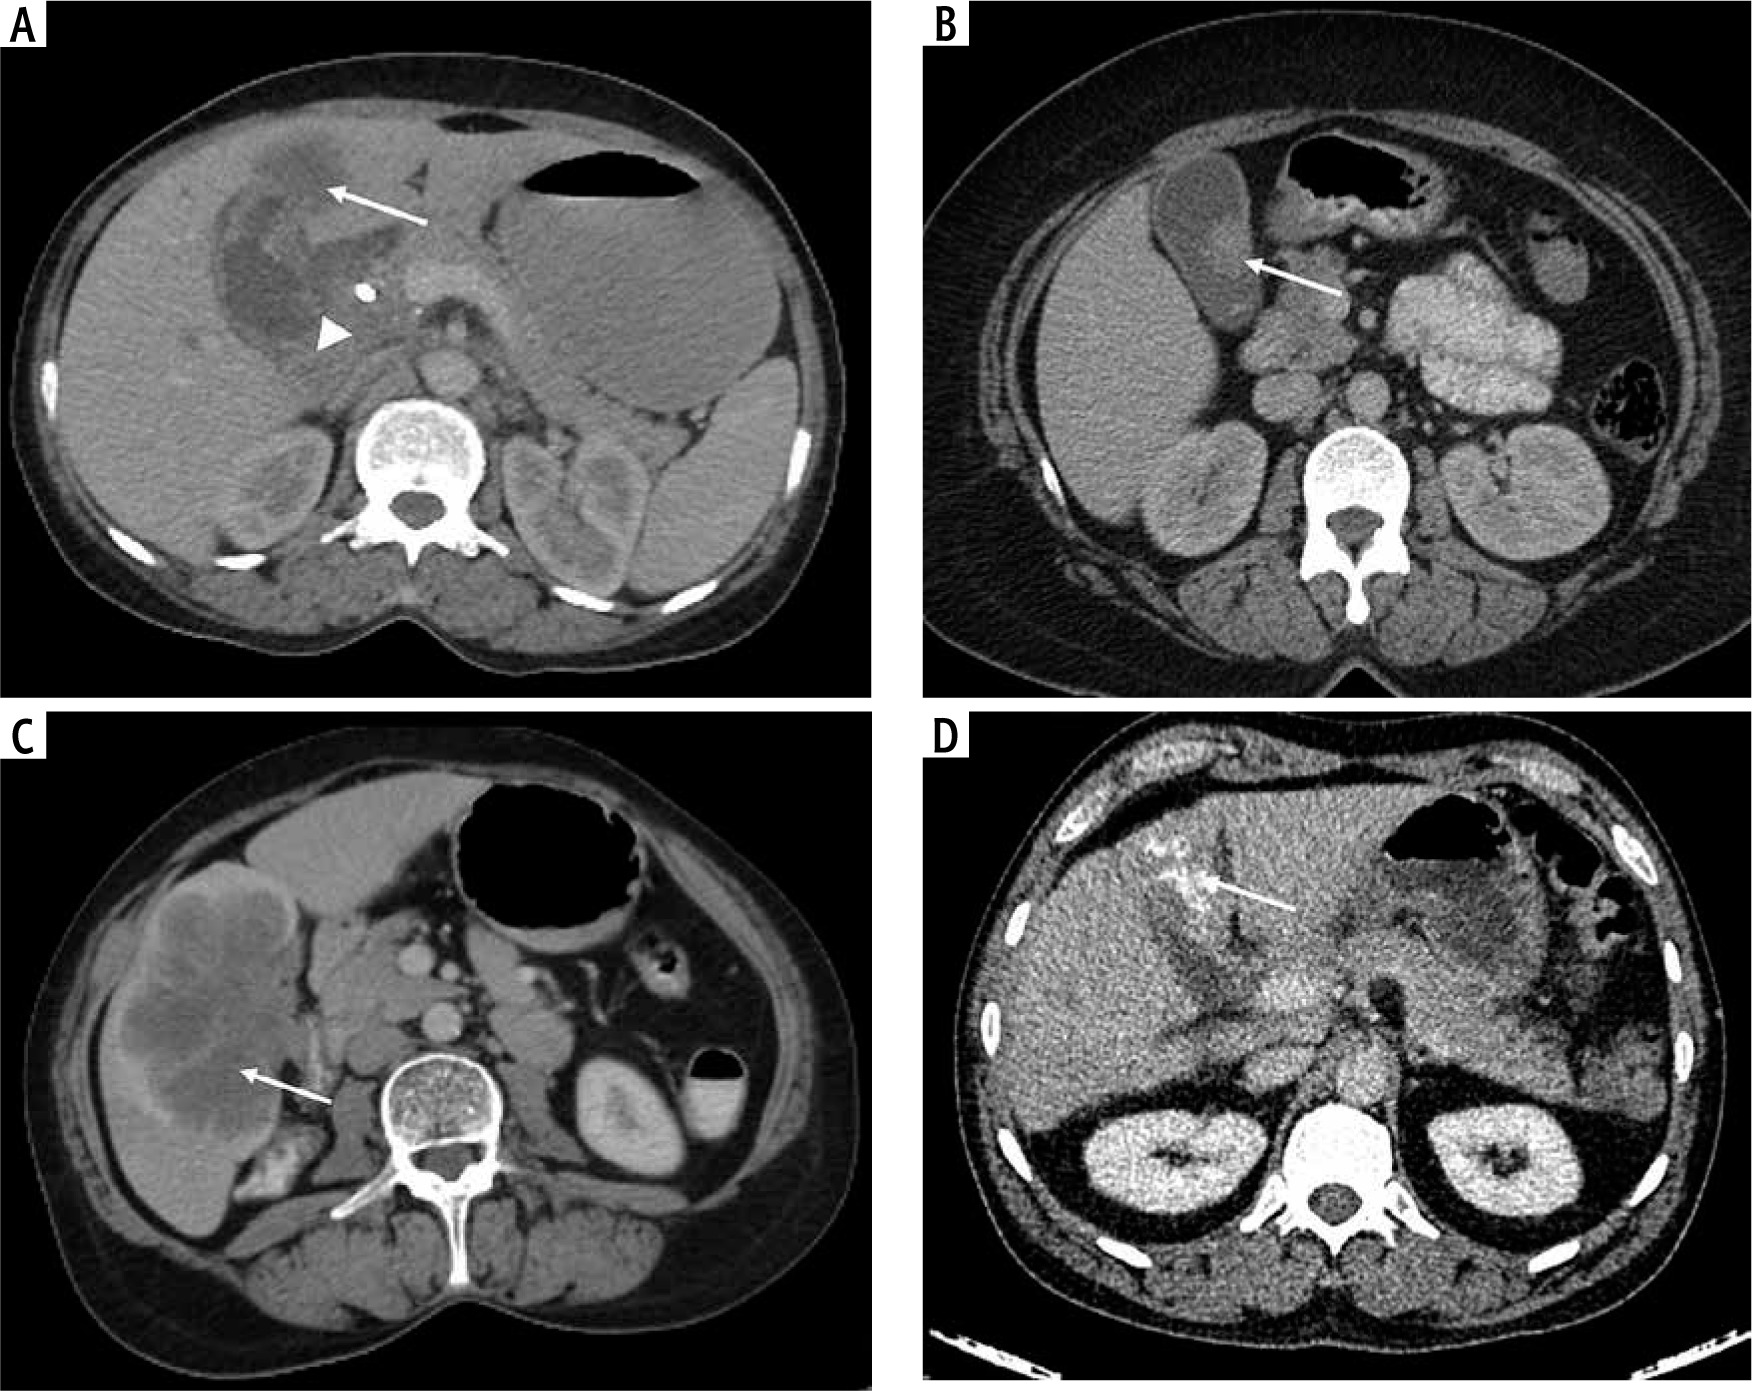
During the study period, we identified 189 patients with suspected GBC. After reviewing the clinical and imaging database, we excluded 129 patients with incomplete clinical or imaging details and patients in whom CT imaging data were not available in the DICOM file format. Of the total 60 patients, 22 were excluded as they had only gallbladder wall thickening on CT imaging without associated gallbladder mass or only post-operative scans done at our institute. Finally, 38 patients were included (Fig. 2). There was female predominance with 31 (81.5%) females and 7 (18.5%) males. Mean age was 53.1 years (range 28-76 years). An exophytic gallbladder mass with associated gallbladder wall thickening was present in 22 (58%) patients. Twelve (31.5%) patients had an intraluminal polypoidal mass with or without gallbladder wall thickening and four (10.5%) had a mass replacing the gallbladder (Fig. 3). The mean of the maximum dimension of mass was 2.8 cm (range 1-10 cm). Ten patients had CT evidence of gallstones within the lumen of the gallbladder. Five patients had discrete liver lesions, of which one was metastasis, one cholangitic abscess, two simple cysts, and one lesion was too small to characterise with CT or sample. Twenty-four (63%) patients had bilobar biliary radical dilatation, of whom 12 had only mild central dilatation and the rest had both peripheral and central biliary radical dilatation. Two patients had left percutaneous transhepatic biliary drainage and three CBD stenting prior to the CT scan. Six patients had ascites limited to the pelvis, out of which two had peritoneal and omental nodules. Aetiology of ascites was not clear in four patients. One patient had discrete omental and peritoneal nodules without ascites. Seventeen (44.7%) patients had periportal lymphadenopathy and seven (18.4%) patients had retroperitoneal lymphadenopathy (including precaval, aorto-caval, and para-aortic lymph nodes).
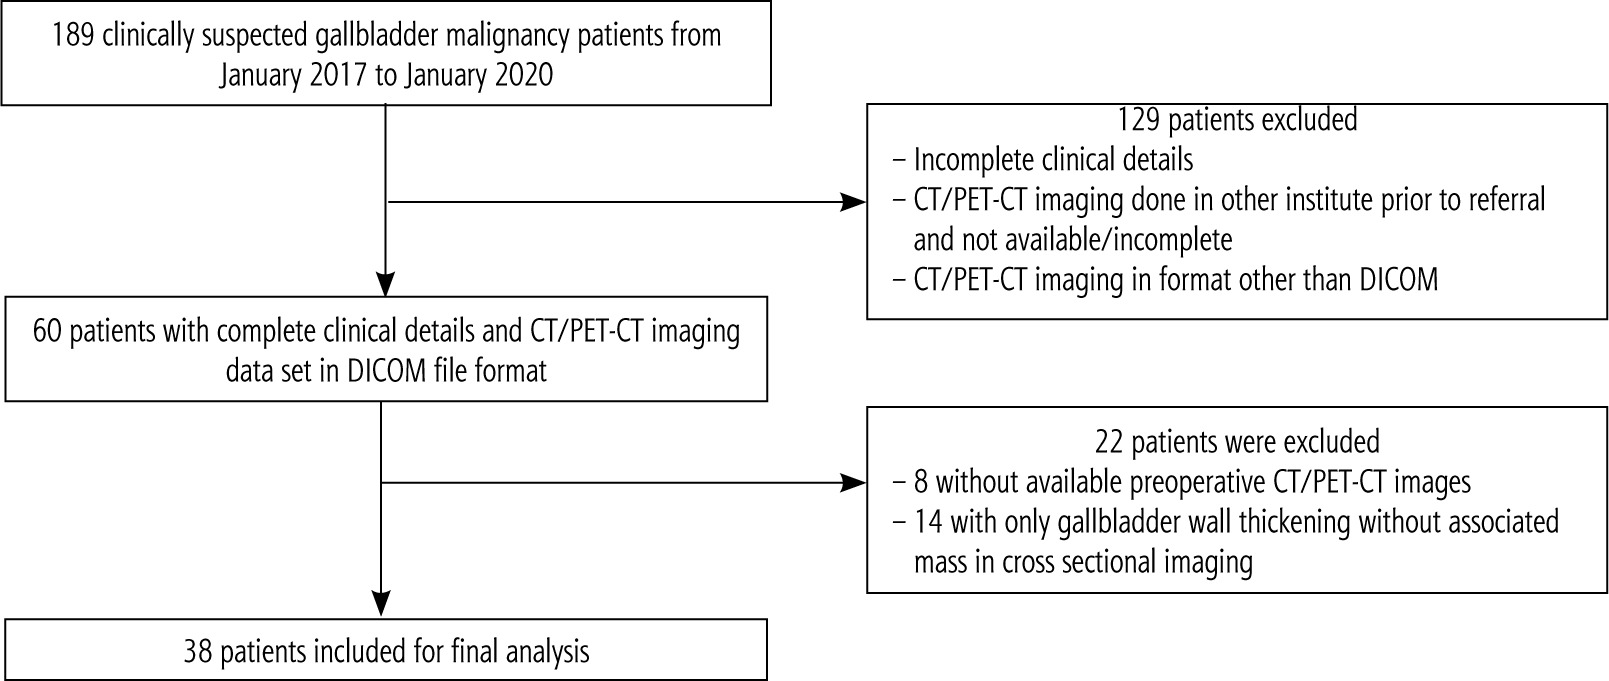
Fig. 3
Morphological types of gallbladder cancer. Axial contrast CT images depict asymmetric gallbladder wall thickening at fundus with associated exophytic mass in segment IV of liver (A, white arrow), heterogenous intraluminal polypoidal lesion ~ 2.5 cm in maximum dimension (B, white arrow) and heterogenous attenuation mass in gallbladder fossa with gallbladder not separately visualized (C, white arrow). D shows heterogenous exophytic mass with multiple calcific foci within (white arrow). All the above lesions were pathologically proven adenocarcinoma with good differentiation (B), moderate differentiation (C) and not otherwise specified (A, D), respectively, histological grades. Note is made of a periportal lymph node (arrowhead), with a CBD stent anterior to it (A)
The baseline imaging characteristics are summarised in Table 1.
Table 1
Baseline imaging characteristics
Histopathology and cytology details
Eighteen patients had histopathological analysis of the post-cholecystectomy gallbladder specimen (n = 14) or the sample obtained during laparotomy (n = 4, surgery deferred in view of metastatic disease), and the rest of the patients had cytological analysis – percutaneous fine needle aspiration under ultrasound guidance. Malignancy was confirmed in 29 patients in histopathology or cytology analysis, and the rest had no features of malignancy. The various types of malignancy detected in histopathology or cytology are shown in Table 2. Of the 9 patients with no features of malignancy, one had a benign gallbladder polyp with antral metaplasia and no malignant cells, and one had myofibroblastic proliferation with fibroadipose tissue in the gallbladder mass. The rest had non-specific changes or inflammation. Eleven patients had pathologically proven lymph nodal or distant metastasis at the time of initial presentation or the follow-up period.
Table 2
Histological type and grade of 29 patients with pathologically proven gallbladder malignancy
Follow-up
We had a follow-up of 18 patients over the study period. Seven patients died during the study period and 11 patients were alive at the time of the last follow-up. The mean overall survival was 9.7 months (range, 3-43 months).
CT texture analysis
The average values of the texture parameters from the filtration-histogram technique on single section axial venous phase images are given in Table 3.
Table 3
Average values of CT texture parameters
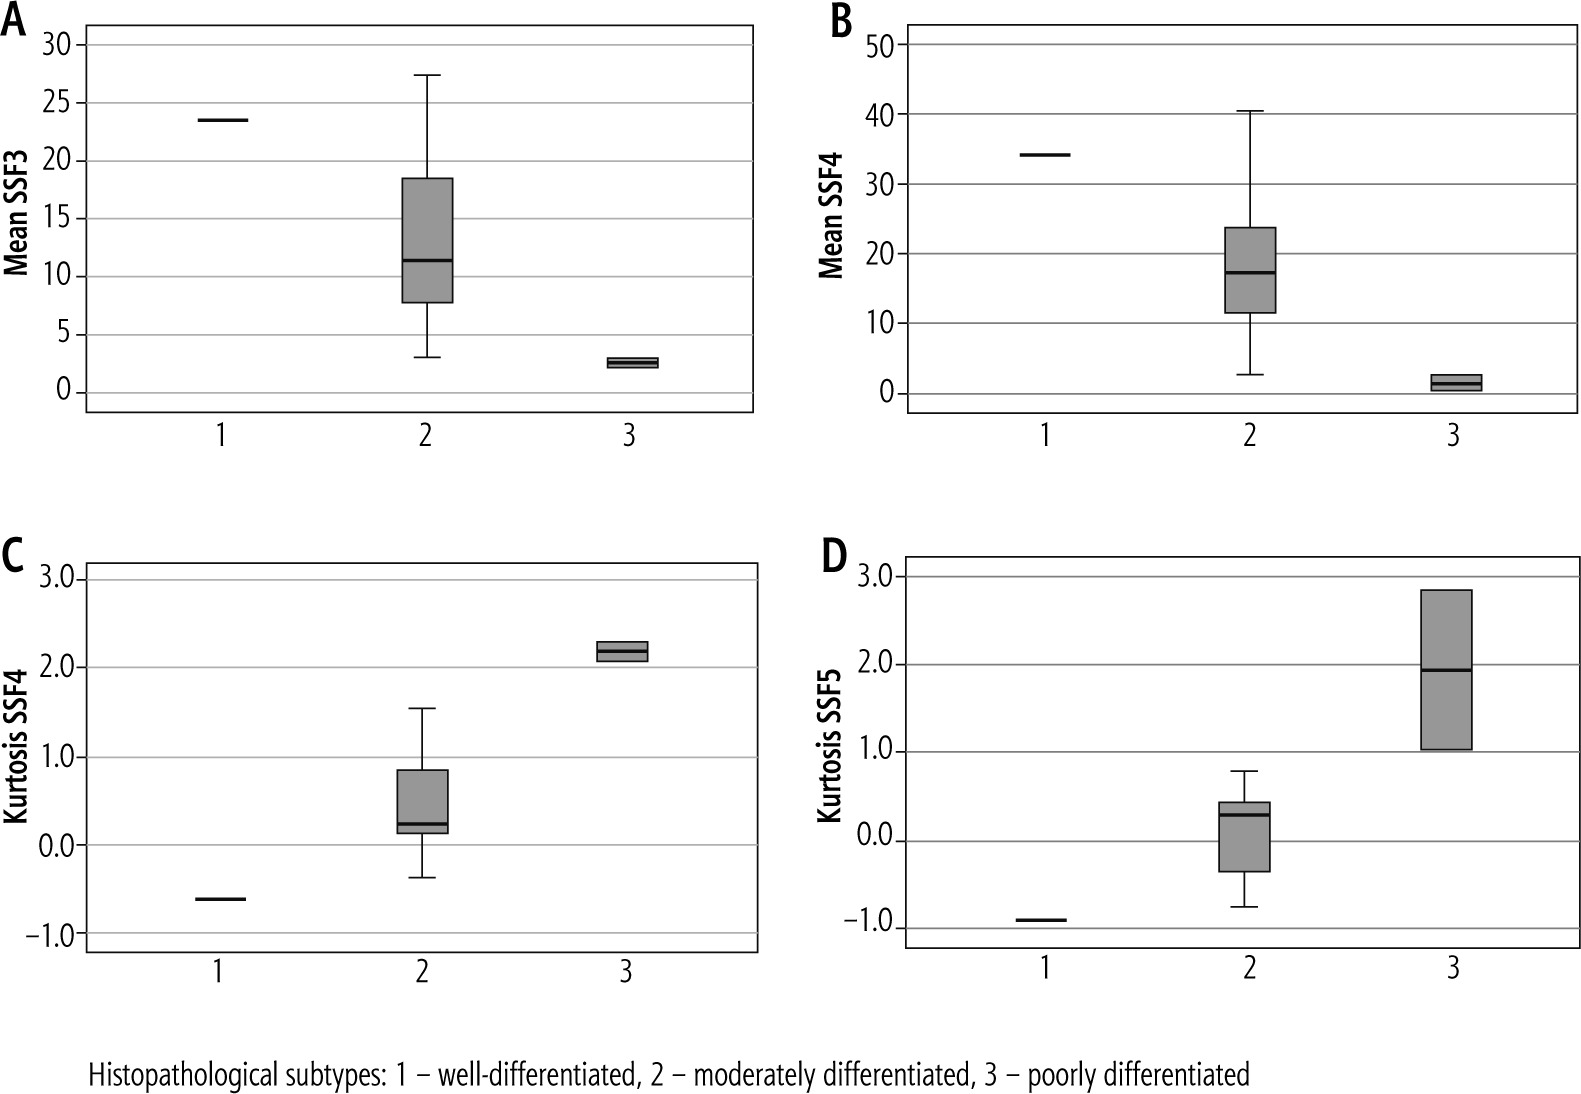
Association with the histological grade of GBC: The mean intensity values at medium texture scales (SSF = 3 and SSF = 4) were significantly lower in patients with poorly differentiated adenocarcinoma (p < 0.05) (Fig. 4). A significant association was found between kurtosis value and degree of differentiation of adenocarcinoma (well differentiated vs. moderately differentiated vs. poorly differentiated) at medium texture scales (SSF = 4 and SSF = 5, p = 0.05). The kurtosis values were the lowest for well-differentiated tumours and highest for poorly differentiated tumours.
Fig. 4
Boxplots showing the trends in the mean value at SSF3 and 4 (A, B) and kurtosis at SSF4 and 5 (C, D)
Association with gallstones, malignancy, and metastasis: None of the texture parameters were found to be significantly associated with gallstones. Higher values of skewness at medium texture scales (SSF = 4, p = 0.09 and SSF = 5, p = 0.06) were seen in patients with malignancy, but they were not statistically significant. Similarly, higher values of kurtosis at coarse texture scales (SSF = 6) were seen in patients with metastases, but not reaching statistical significance (p = 0.08).
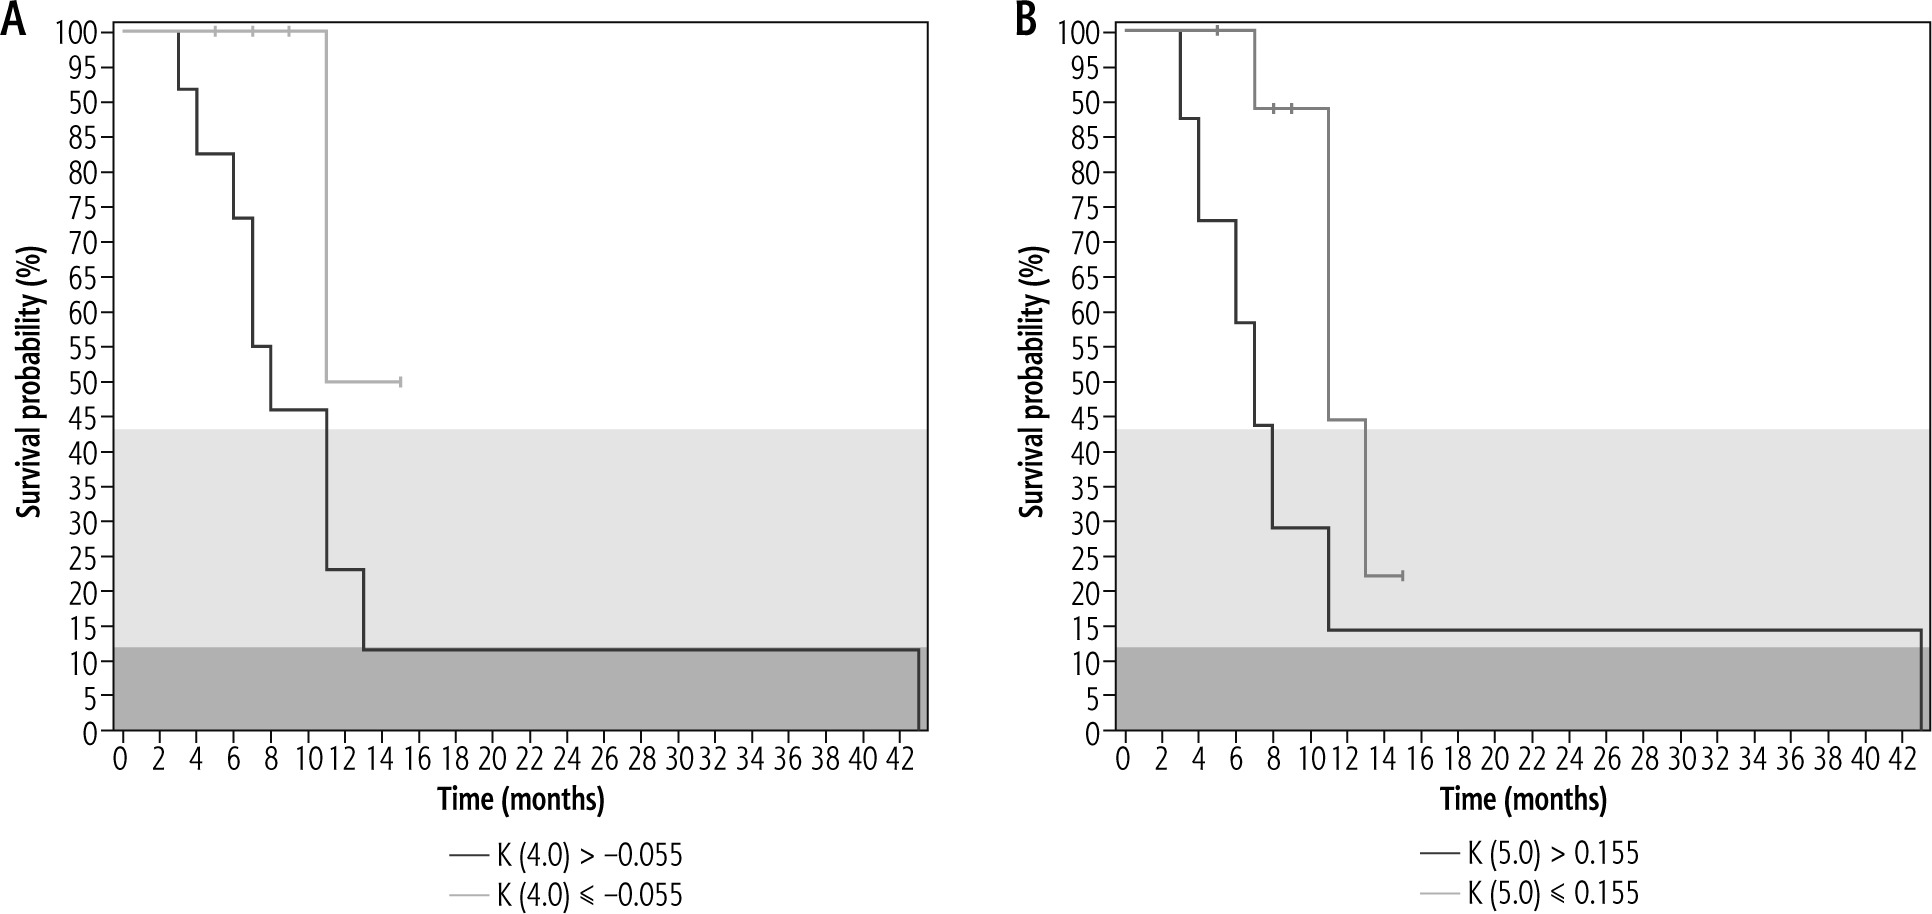
Association/correlation with overall survival: The only texture parameter that was significantly associated with survival was kurtosis (p = 0.020) at medium texture scales (SSF = 3 and 4). Figure 5 shows the Kaplan-Meier survival plots. There was a significant negative correlation between length of overall survival and entropy at fine texture scale (SSF = 2, rs = –0.610, p = 0.007), medium texture scale (SSF = 3-5, rs = –0.590 to –0.636, p = 0.005-0.010), and coarse texture scale (SSF = 6, rs = –0.675, 0.003). Additionally, the skewness at fine texture scale (SSF = 2) had a significant negative correlation (rs = –0.514, p = 0.029) with the length of overall survival. Based on multivariate analysis (including CT texture parameters, size of the tumour, morphological and histological subtypes, presence of gallstones, and presence of metastases), the factors found to be significantly associated with the length of overall survival were MPP (p = 0.02), skewness (p = –0.046), and kurtosis (0.018) at SSF = 0, and SD (p = 0.045) at SSF = 2.
Discussion
Our preliminary study reports the results of CT texture analysis in patients with GBC. We found that the mean and kurtosis at medium texture scale were significantly associated with the histological grade of tumour. Kurtosis at medium texture scale was significantly associated with overall survival rate. There was a significant negative correlation between the length of overall survival and entropy at all texture scales and kurtosis at fine texture scale. In multivariate analysis, the mean value of positive pixels (MPP), skewness, and kurtosis without filtration and SD at fine texture scale significantly predicted the length of overall survival. Also, skewness and kurtosis at medium and coarse texture scales demonstrated higher values in malignant lesions, although not reaching statistical significance.
A few previous studies have evaluated the role of texture analysis in biliary tract pathologies [22, 24, 25]. However, the data regarding GBC are sparse. Choi et al. assessed the utility of texture analysis at high resolution ultrasound for risk stratification of gallbladder polyps larger than 10 mm [24]. In their study including 136 patients, texture features that were significantly associated with carcinoma were higher skewness and lower contrast derived from grey-level co-occurrence matrices. The authors proposed a model in which the presence of at least one high resolution ultrasound feature and at least one texture feature was associated with a specificity of 93.8% for diagnosis of carcinoma. In a study by Ji et al. a radiomics model for predicting lymph node metastasis from intrahepatic cholangiocarcinoma was proposed [25]. The radiomics features were extracted from 103 patients on arterial phase CT images. The signature comprising 8 lymph node related features showed good calibration and discrimination in the training as well as the validation cohort. The radiomics nomogram was an independent predictor of overall survival and disease-free survival. In another study by Ji et al. a radiomics signature on CT to predict lymph node metastases in biliary tract cancer (BTC) was developed [22]. This retrospective study included 177 patients with histologically confirmed BTC (147 cholangiocarcinoma and 30 GBC) without distant metastases who underwent curative resection with lymph node dissection. The texture feature extraction was done on a portal venous phase CT image using an in-house software. A total of 93 threedimensional radiomic features, including 19 first order statistics, 16 shape features, and 58 statistics-based features, were generated from CT images. Validation was done in 70 patients (57 cholangiocarcinoma and 13 GBC). In the nomogram three lymph node related features (skewness, entropy, and shape) were significantly associated with lymph node metastasis in primary and validation cohorts.
We used a filtration-histogram texture-based technique which involved extracting first-order statistics and histogram features from fine, medium, and coarse spatial scale filtered and without filtration (conventional) images. This approach has been extensively utilized and validated and shown to predict key histological features in non-small cell lung cancer, colon cancer with and without KRAS mutation, breast cancer and glioma [19]. Additionally, previous studies have demonstrated good reproducibility for filtration-histogram based texture analysis using multicentre clinical validation, robustness to variation in image acquisition parameters and good inter- and intra-operator repeatability (good intraclass correlation from test-retest technique) [28-30]. Our patient cohort was different from that reported by Ji et al. We included patients with GBC only regardless of the presence of distant metastasis and found that CT texture features were predictive of the histological grade of the tumour and overall survival. These results are like those reported by Oh et al. for hepatocellular carcinoma on CT and by Goyal et al. for renal cell carcinoma on magnetic resonance imaging [21, 31].
There were several limitations to our pilot study. The sample size was small. The contour of the tissue was drawn on a single axial slice. Although the multi-slice or volume delineation would be a better representation of the entire tumour, it is not practical in clinical settings as it is time-consuming and increases variability in the segmentation process. Furthermore, comparable results in heterogeneity assessment between single slice analysis of the largest cross-sectional area versus whole volume analysis have been demonstrated in colorectal cancer [32]. The study was retrospective with its associated biases. The data were heterogeneous in terms of the morphological type of the GBC. Not all patients underwent surgery, and thus histopathological analysis of the primary tumour and lymph nodes was not available for all the patients. However, these limitations are understandable given the pilot study, rarity, and extremely aggressive nature of GBC. Finally, the follow-up data were not available for all patients.
In conclusion, our preliminary results highlight the potential utility of CT texture-based radiomics analysis in patients with GBC. Medium texture scale parameters including both mean and kurtosis, or kurtosis alone, may help predict the histological grade and survival, respectively.


