
Introduction
Atopic dermatitis (AD) is the most common chronic inflammatory eczematous skin disease globally, characterized by dry skin, eczematous lesions, and intense pruritus [1]. It affects individuals of all ages, particularly children [2]. Patients with AD often suffer from sleep disturbances due to severe pruritus, which substantially impacts their physical and mental health over time. Studies [3] have revealed that AD imposes a heavy burden on patients and their families, especially affecting the mental health, work productivity, and quality of life of adult patients. For child patients, decreased sleep quality, fatigue, and psychological stress experienced by caregivers may lead to direct economic losses. In families with children that have mild and moderate-to-severe AD, parents or other caregivers may miss an average of 3.9 days and 9.7 working days, respectively [4]. Moreover, many patients find it difficult to afford the high treatment costs associated with AD [5]. Moreover, AD is often associated with other atopic conditions [6] such as food allergy, allergic rhinitis, and asthma, and is considered the initial stage of the atopic march [7]. Patients with AD are also at higher risk of developing multiple autoimmune diseases [8]. Therefore, early diagnosis and treatment are crucial to prevent complications and improve quality of life.
However, in China, the diagnostic rate of AD remains lower than expected [9]. A survey involving 3,016 dermatologists showed that when diagnosing patients with symmetrical eczematous dermatitis, approximately half of the dermatologists believed that over 90% of these patients should be diagnosed with eczema, while the diagnosis rate for AD was less than 10% [10]. As an incredibly heterogeneous disease [11], the differences in the clinical manifestations and patients’ subjective perceptions of skin lesions pose significant challenges for clinicians in making accurate diagnoses [12]. Consequently, the diagnosis of AD still largely depends on physicians’ experience [13]. However, the clinical diagnosis of AD is often hampered due to mild symptoms, a propensity for atypical morphology and distribution of skin lesions, incomplete medical histories, and limited awareness among both patients and clinicians [14]. These factors contribute to deficiencies in early identification, individualized treatment, patient care, and health education for AD patients. Based on these challenges, this study retrospectively analysed the influencing factors of AD and developed a multivariate visual prediction model, which fills up the gaps in the research on models related to predicting the occurrence of AD. This model assists clinical decision-making and enables clinicians to carry out refined patient management strategies and helps patients gain an intuitive understanding of their disease severity, thereby facilitating better self-management and improving treatment compliance.
Material and methods
Study subjects
This study was approved by the Ethics Committee of the Fourth Affiliated Hospital of Soochow University (approval number: 2025 Lun Yan No. 251209) and was conducted in accordance with the Helsinki Declaration. Written consent was obtained from all individuals included in this study, or their legal guardians or wards. The research data were analysed anonymously and personal identifiers were completely removed. Patients diagnosed with dermatitis and eczema and treated at the Dermatology Department of the Fourth Affiliated Hospital of Soochow University from January 2021 to May 2025 were selected as potential study participants. Inclusion criteria: (1) diagnosis of AD according to the Chinese diagnostic criteria recommended in the Chinese Guidelines for the Diagnosis and Treatment of Atopic Dermatitis (Version 2020); (2) patients admitted to the hospital for dermatitis-related complaints for the first time; (3) completed laboratory tests including analyses of eosinophil (EOS) count and serum total immunoglobulin E (tIgE); and (4) complete clinical data. Exclusion criteria: patients with autoimmune, neoplastic, haematological, parasitic, or other conditions that may influence EOS count or serum tIgE levels.
Clinical data collection
Patient data, including age, gender, number of medical visits, and medical history, were collected through the laboratory information system of the Clinical Laboratory Centre.
Laboratory tests
On the day of enrolment, two venous blood samples were drawn from the inner elbows of participating patients using vacuum collection tubes. One tube contained EDTA-K2 as an anticoagulant for whole blood analysis, and the other was a serum separation tube with coagulant and serum separation gel. EOS counts in peripheral blood samples were measured using an automatic haematology analyzer (BC-6800Plus, Mindray, China). The reference ranges were 0.04–0.74 × 10⁹/l for children and 0.02–0.52 × 10⁹/l for adults; values exceeding these thresholds were considered positive. Serum tIgE levels were measured using an automatic fluorescence immunoassay analyzer (Phadia 250, Thermo Fisher Scientific, USA), with a reference value of < 60 kU/l; values above 60 kU/l were considered positive.
Data analysis
SPSS 27.0 was used for statistical analysis. All data were first assessed for normality using the Shapiro-Wilk test (S-W test). Non-normally distributed quantitative data were expressed as M (P25, P75), and comparisons between groups were performed using Wilcoxon rank-sum tests (U tests). Categorical data were expressed as percentages and analysed using χ2 tests. Binary logistic regression was used for both univariate and multivariate analyses and the influencing factors identified as significant were included in the development of the nomogram predictive model, which was plotted using R Studio. The bootstrap sampling method was employed to perform 1,000 self-sampling internal validations of the nomogram prediction model. Model performance was evaluated using receiver operating characteristic (ROC) curves, goodness-of-fit was evaluated using the Hosmer-Lemeshow test (H-L) and calibration curve, and clinical applicability was evaluated using clinical decision curve analysis (DCA). The significance level was set at α = 0.05.
Results
Analysis of clinical data between the AD group and non-AD group
Analysis revealed significant differences in age, history of allergic diseases, family history of allergy, infantile onset history, number of medical visits, EOS count, and tIgE level between the AD and non-AD groups (p < 0.001, Table 1).
Table 1
Analysis of clinical data between the AD group and non-AD group
Analysis of grouping in the training set and validation set
A total of 469 patients with dermatitis and eczema were included in this study. They were randomly divided into a training set (328 cases) and a validation set (141 cases) at a 3 : 7 ratio. There were no differences between the two groups in terms of gender, age, family history, medical history, EOS count, and total IgE levels, confirming their suitability for establishing and validating the prediction model (Table 2).
Table 2
Analysis of grouping characteristics of the training set and validation set
Univariate and multivariate logistic regression analyses
A total of 328 cases were included in the training set, among which 150 cases were in the AD group and 178 cases were in the non-AD group. Univariate analysis showed that age, tIgE level, EOS count, number of visits, history of allergic diseases, family history of allergy, infantile onset history, and positive rate of tIgE were statistically significant (p < 0.01). Multivariate analysis of the above variables further confirmed that history of allergic diseases, family history of allergy, infantile onset history, and the number of medical visits were significant factors independently associated with AD incidence (p < 0.01, Table 3).
Table 3
Univariate and multivariate logistic regression analyses in the training set
| Variables | Univariate logistic regression analysis | Multivariate logistic regression analysis | ||||||||
|---|---|---|---|---|---|---|---|---|---|---|
| β | S.E | Z | P | OR (95% CI) | β | S.E | Z | P | OR (95% CI) | |
| Gender (cases, %) | ||||||||||
| Female* | Ref | Ref | ||||||||
| Male | –0.04 | 0.22 | –0.19 | 0.848 | 0.96 (0.62–1.48) | 0.21 | 0.28 | 0.75 | 0.451 | 1.23 (0.71–2.13) |
| History of onset in infancy (cases, %) | ||||||||||
| None* | ||||||||||
| Yes | 3.79 | 1.02 | 3.71 | < 0.001 | 44.25 (5.97–328.25) | 3.17 | 1.07 | 2.96 | 0.003 | 23.80 (2.92–193.62) |
| History of allergic diseases (cases, %) | ||||||||||
| None* | ||||||||||
| Yes | 1.37 | 0.27 | 5.14 | < 0.001 | 3.94 (2.34–6.65) | 0.99 | 0.32 | 3.11 | 0.002 | 2.68 (1.44–5.00) |
| Family history of allergy (cases, %) | ||||||||||
| None* | Ref | Ref | ||||||||
| Yes | 1.33 | 0.24 | 5.55 | < 0.001 | 3.79 (2.37–6.06) | 0.83 | 0.30 | 2.75 | 0.006 | 2.30 (1.27–4.17) |
| Age [years] M (P25, P75) | –0.03 | 0.01 | –5.19 | < 0.001 | 0.97 (0.96–0.98) | –0.01 | 0.01 | –1.77 | 0.077 | 0.99 (0.97–1.00) |
| IgE | 0.01 | 0.00 | 3.63 | < 0.001 | 1.01 (1.01–1.01) | 0.00 | 0.00 | 1.60 | 0.109 | 1.00 (1.00–1.00) |
| EOS | 0.71 | 0.41 | 1.75 | 0.081 | 2.03 (0.92–4.49) | 0.15 | 0.68 | 0.23 | 0.820 | 1.17 (0.31–4.40) |
| Number of doctor visits (times) | 0.15 | 0.03 | 4.92 | < 0.001 | 1.16 (1.10–1.24) | 0.15 | 0.04 | 4.28 | < 0.001 | 1.16 (1.08–1.24) |
Establishment of an AD prediction model
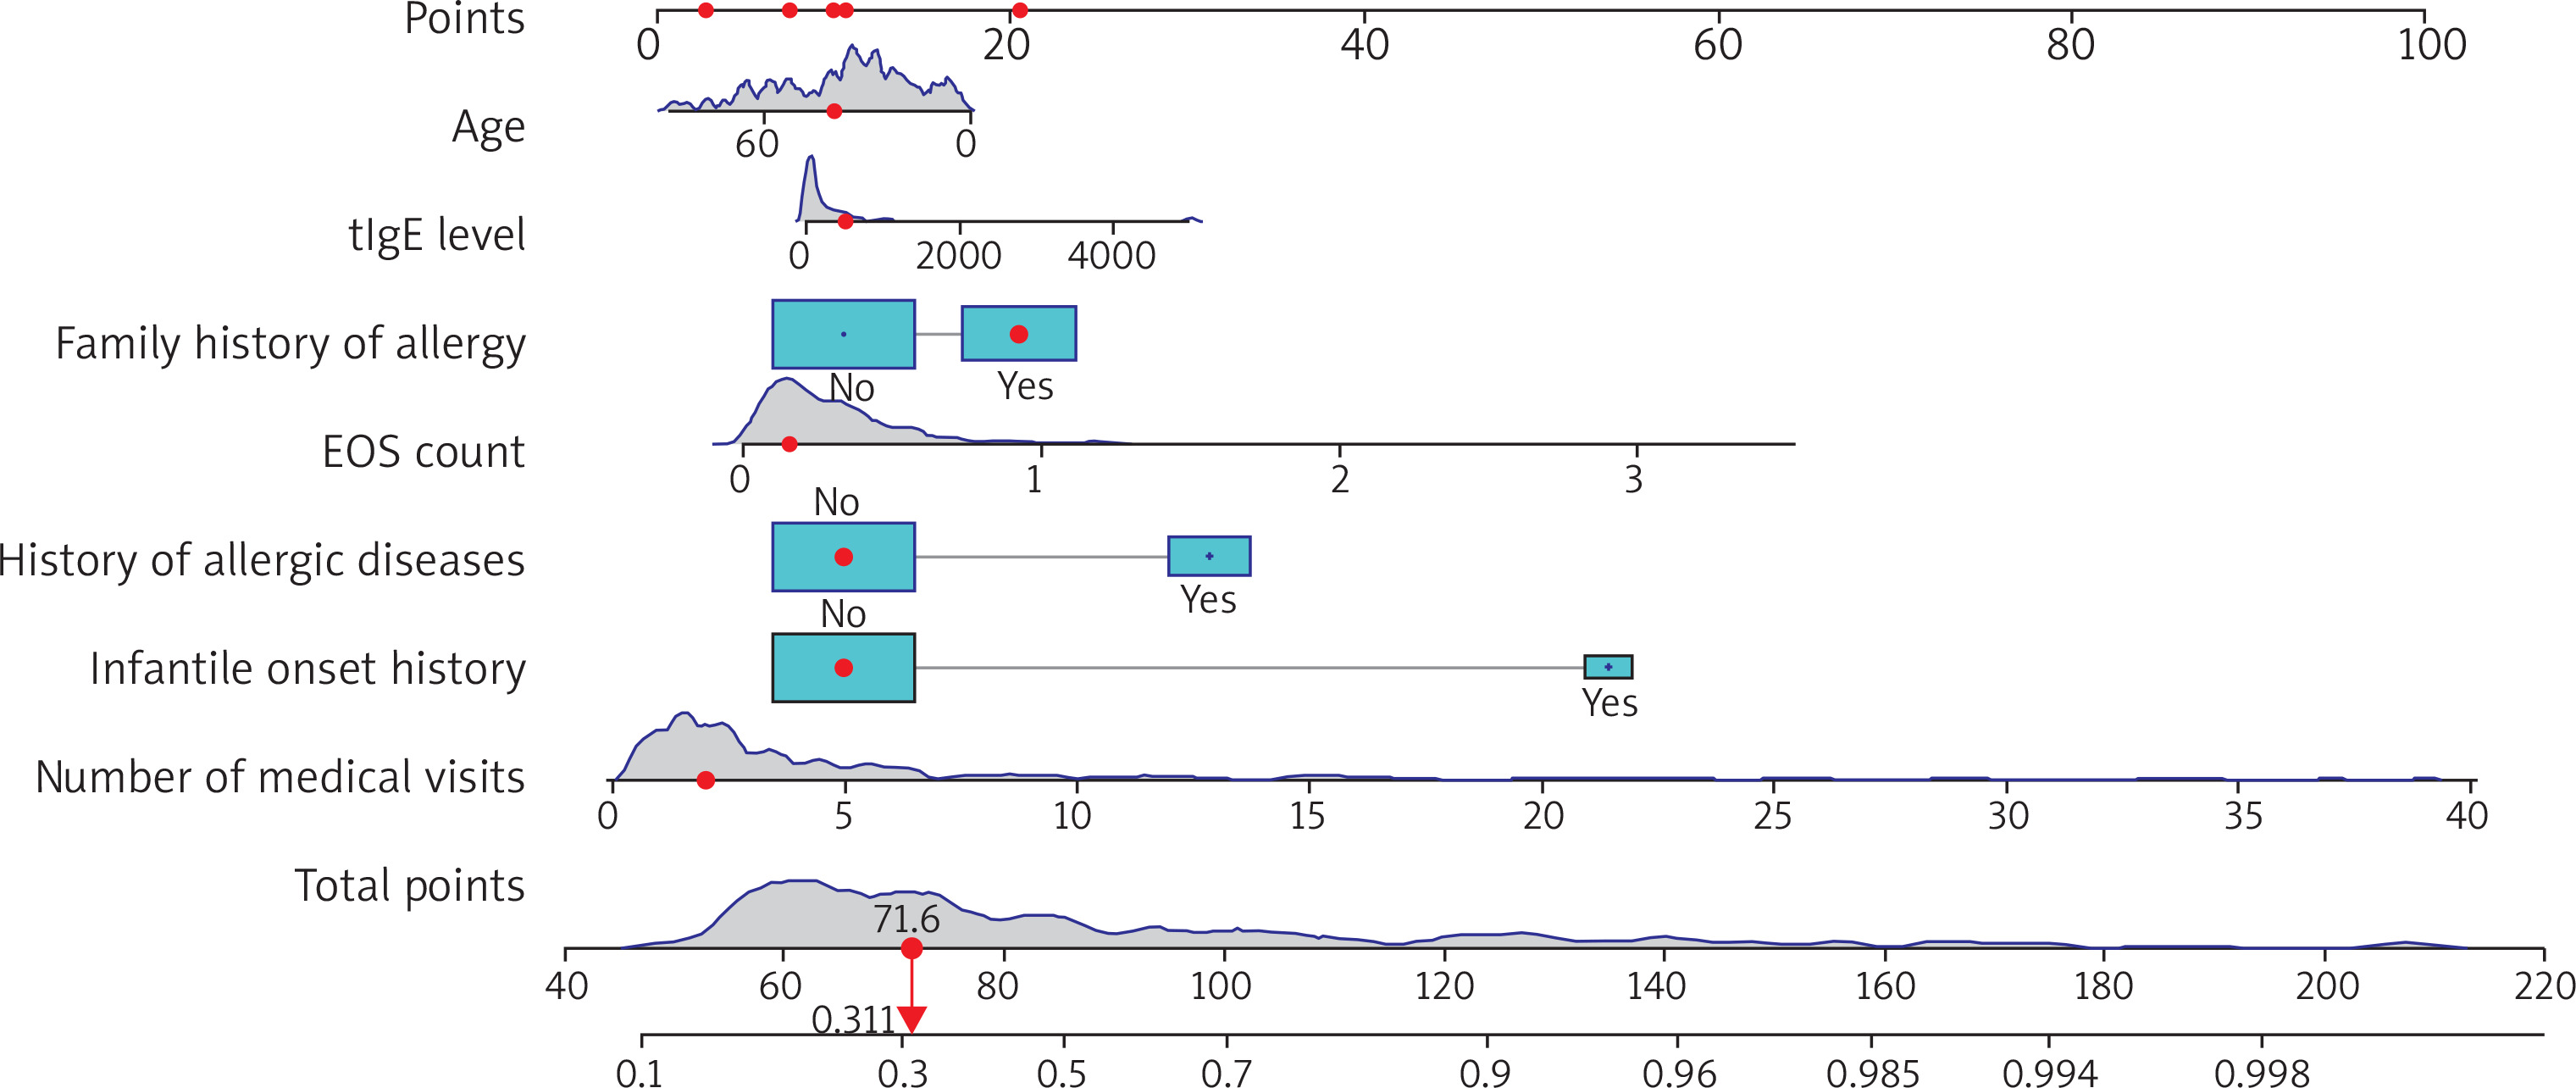
As shown in Figure 1, a nomogram prediction model was constructed incorporating age, EOS count, tIgE level, family history of allergy, history of allergic diseases, infantile onset history, and number of visits (selected based on clinical relevance and multivariate analysis results). The total value corresponds to a risk value, which represents the probability of AD occurrence in patients.
Figure 1
The nomogram for predicting the risk of atopic dermatitis (AD) in patients with dermatitis and eczema. Interpretation of the nomogram: for each variable, locate the corresponding position on the horizontal axis according to the actual situation and draw a vertical line upward to obtain a specific score on the “Points” scale. Sum the scores of the seven variables in sequence to obtain the total score. Locate the position corresponding to the total score on the “Total Points” scale and draw a vertical line downward. The value on the “Probability” scale corresponding to this vertical line is the risk prediction value for the patient
Performance evaluation of the model
Calibration and discriminative ability
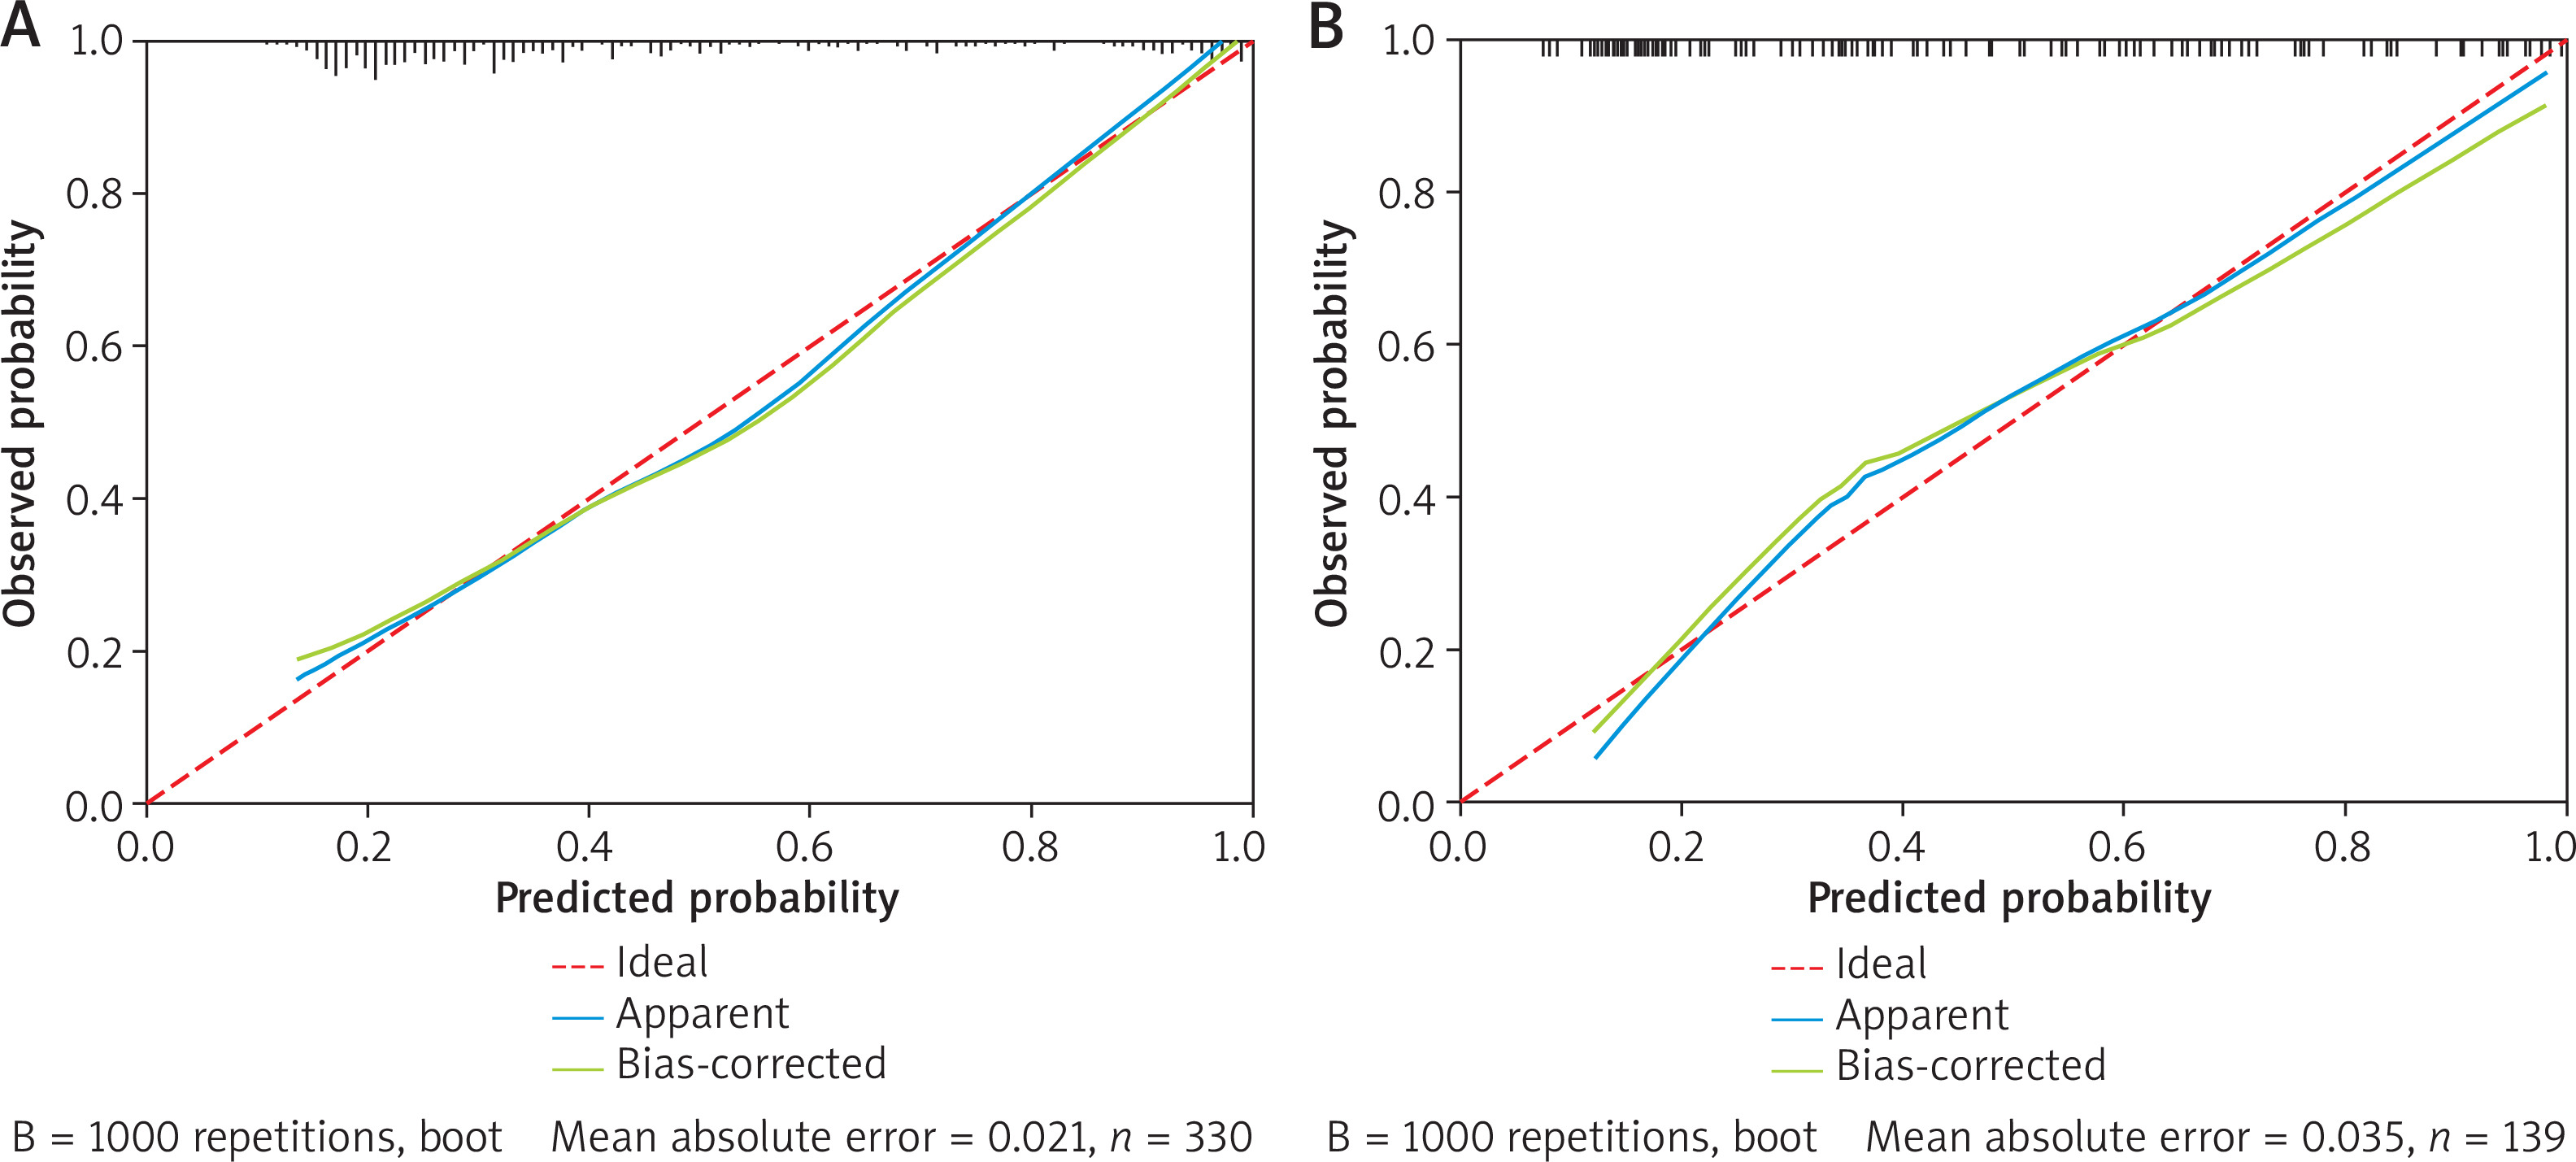
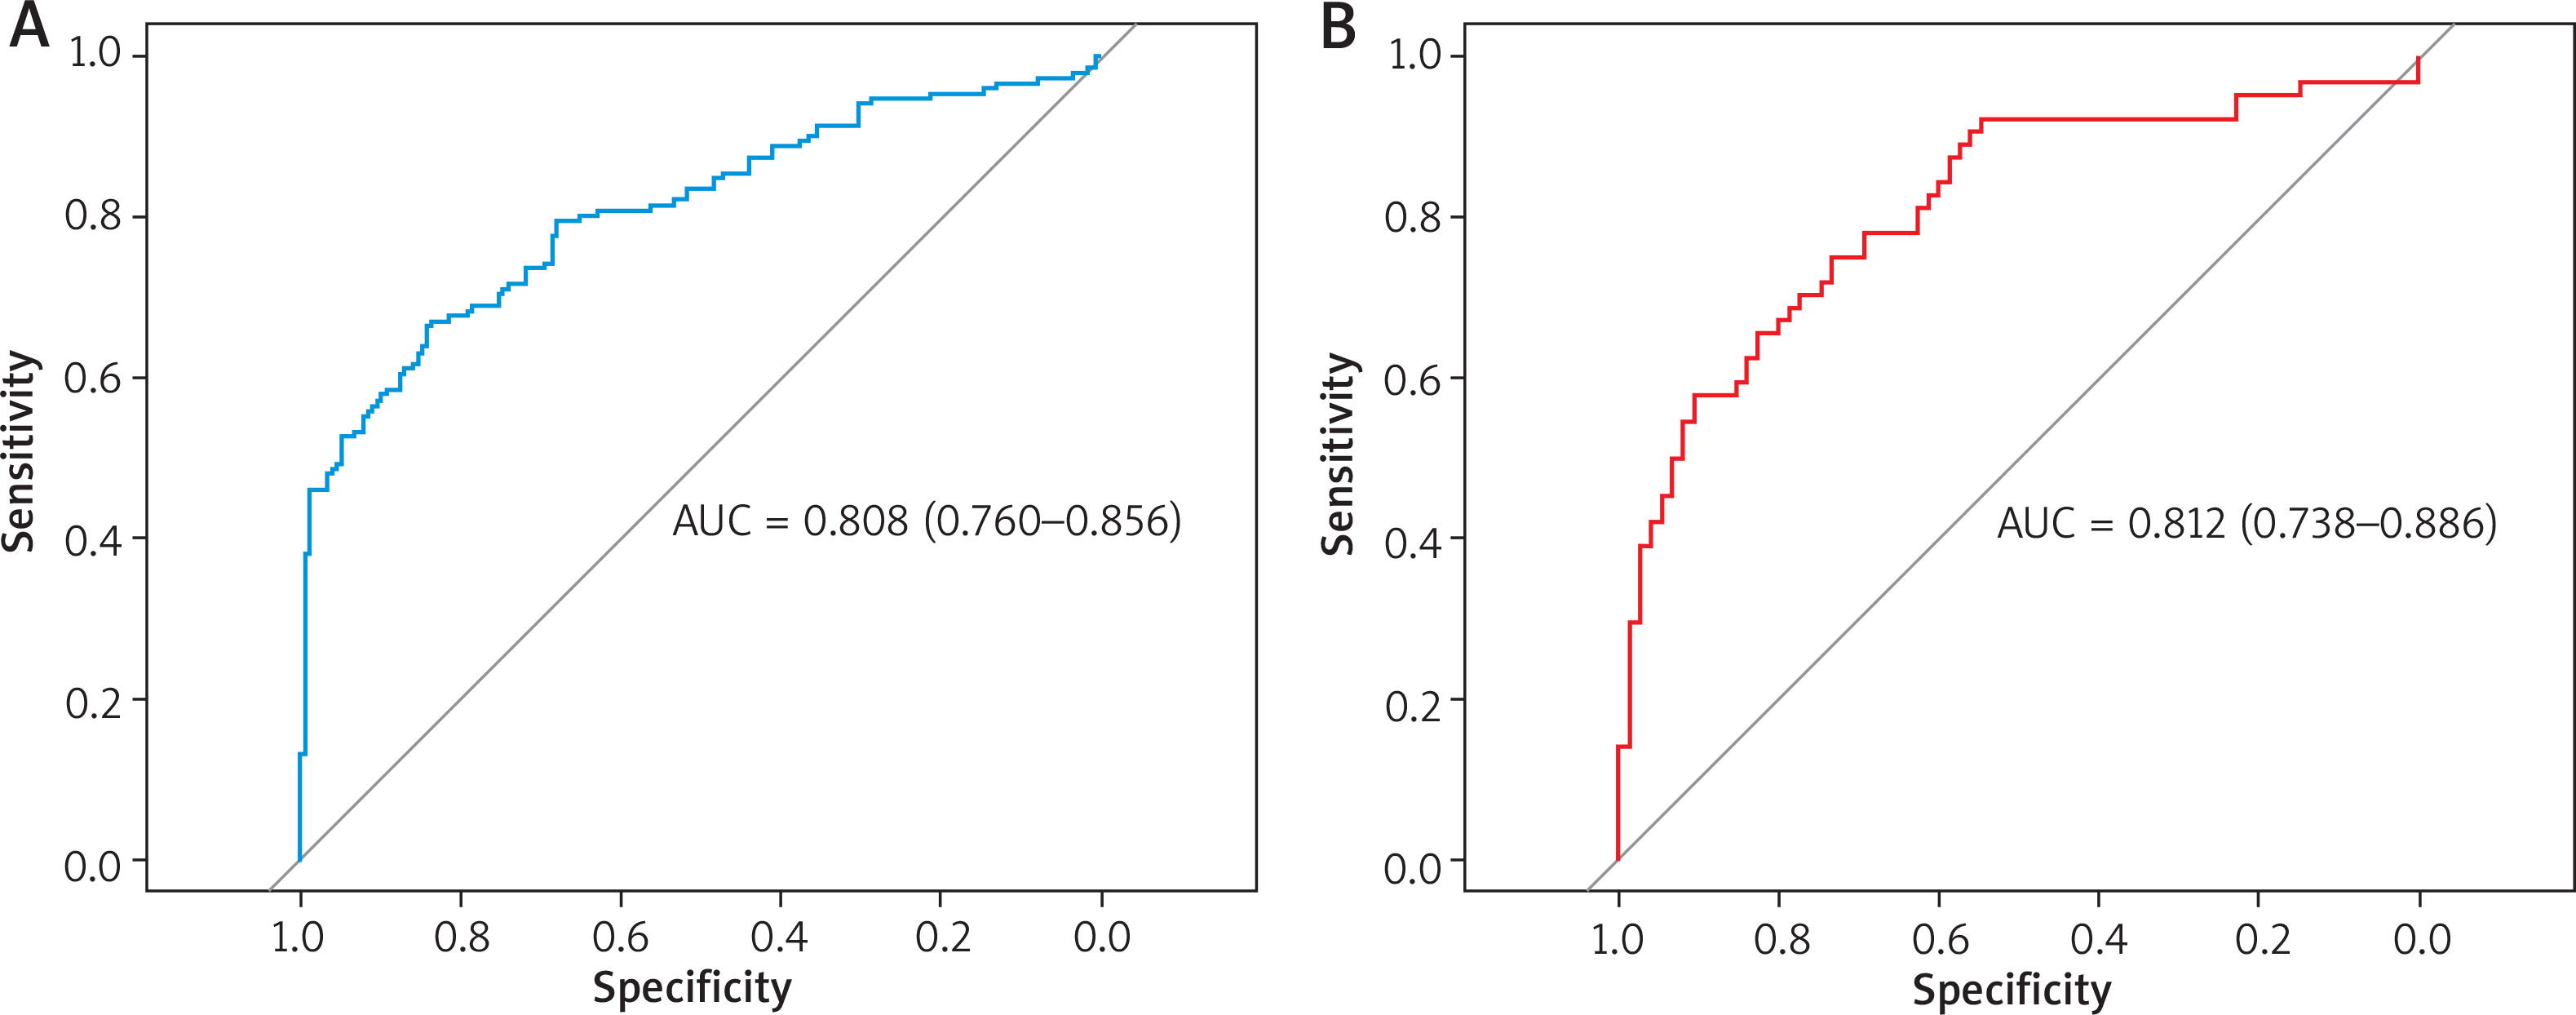
The results of the Hosmer-Lemeshow test showed that for both the training set (χ2 = 6.68, p = 0.57) and the validation set (χ2 = 7.96, p = 0.44), the p-values were both greater than 0.05, indicating an appropriate goodness-of-fit of the model. The calibration curve showed that the model’s predicted probability of AD occurrence closely matched the observed outcomes, suggesting a high degree of fit and consistency (Figure 2). The concordance indices (C-index) of the training set and the validation set were 0.807 and 0.809, respectively, indicating robust discriminative ability. Additionally, the ROC curve showed areas under the curve (AUC) of 0.808 in the training set and 0.812 in the validation set, suggesting accurate predictive performance of the model (Table 4, Figure 3).
Figure 2
Calibration curve analysis of the nomogram prediction model. The calibration curve shows that the mean absolute errors (MAE) of the training set and the validation set are small (0.021 and 0.035, respectively), indicating that the model has good calibration and consistency: A – train, B – test
Clinical applicability of the model
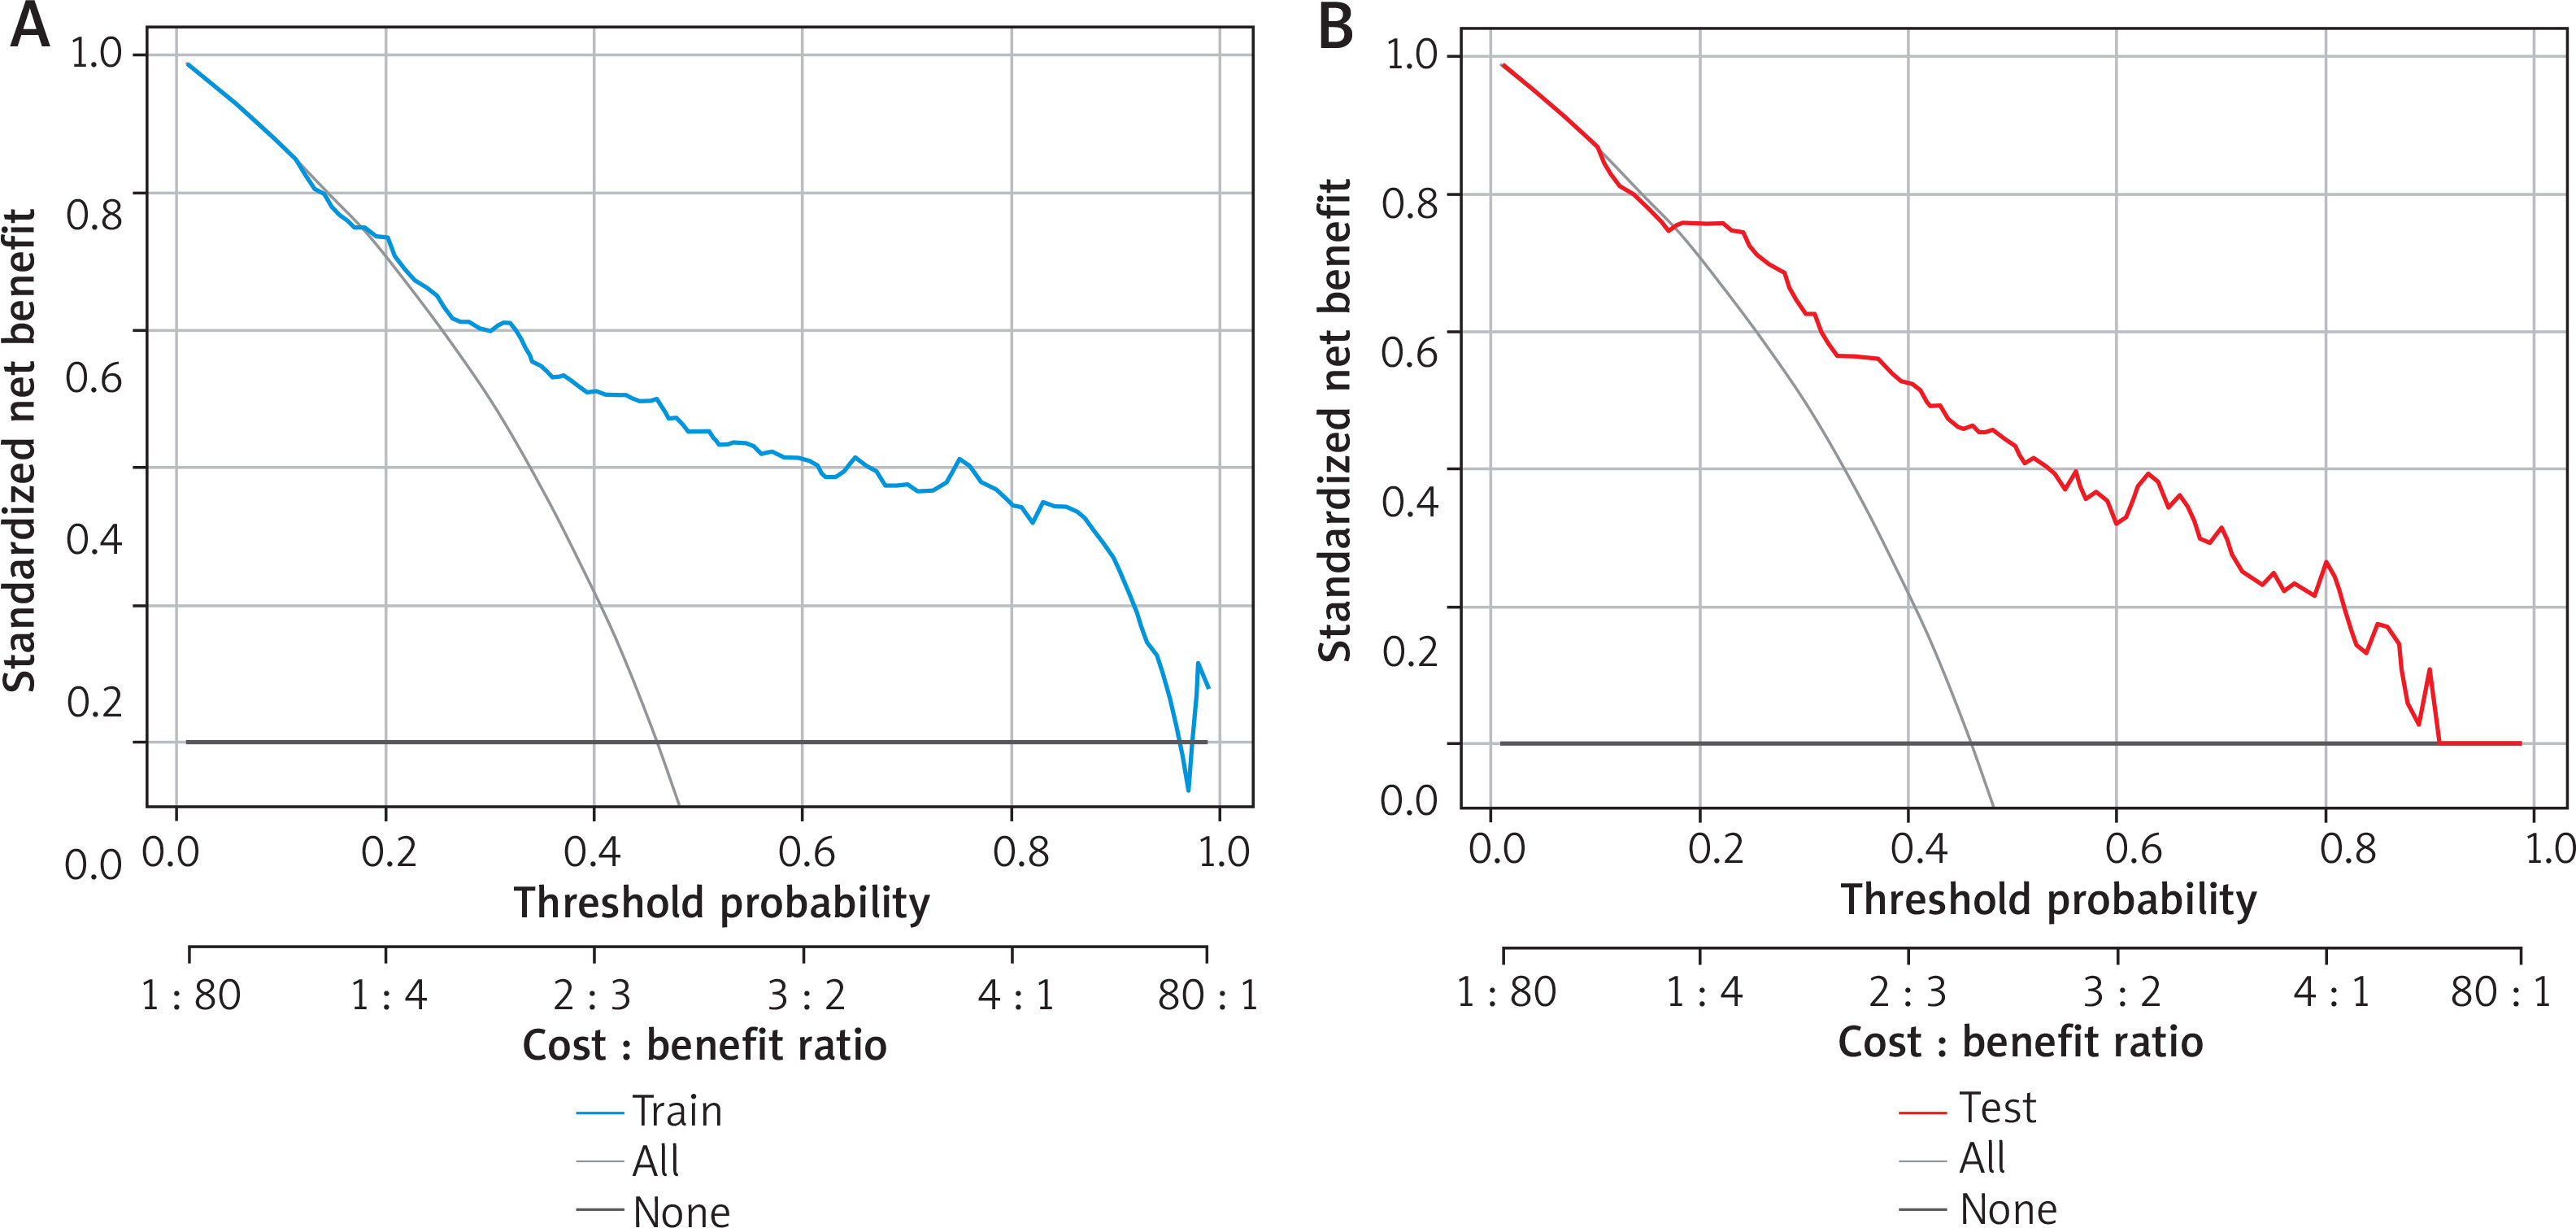
The DCA results showed that the area to the right of the full-intervention line and above the non-intervention line fell within a reasonable prediction range, indicating that the model provided certain net clinical benefits in predicting AD. This suggests that the model has practical value for clinical decision-making (Figure 4).
Discussion
In recent decades, the prevalence of AD in China has been steadily increasing [15]. A 2014 study reported that among 8,758 outpatients with dermatitis and eczema from 39 tertiary hospitals in 15 provinces and cities across the country, the prevalence of AD was 7.8% (95% CI: 7.3–8.4) [16]. AD not only affects skin health but also imposes significant direct and indirect economic burdens. A nationwide internet-based questionnaire survey conducted across 31 provinces in China from February to March 2022 showed that the total annual cost of AD for the 599 families surveyed in the study was approximately 28,591.92 yuan, with direct costs accounting for 92.8% of this amount [17]. Additionally, a predictive study [18] based on the Global Burden of Disease database predicted that the prevalence of AD in children under 9 years old in China will continue to rise through 2030, highlighting the need for strategies to reduce the burden of AD. These findings underscore the fact that AD has become a significant public health concern. Although many studies have focused on its clinical manifestations, drug efficacy, and prognosis, relatively few have investigated the factors that influence its development. Moreover, most of these studies have selected healthy individuals as the control group, rather than patients with other forms of dermatitis and eczema. However, in clinical practice, a greater challenge lies in distinguishing AD from other forms of dermatitis and eczema. In China, multiple expert consensuses and guidelines have been issued, aiming to standardize the clinical pathways for diagnosis and treatment of AD. These include strategies for drug use, adverse reaction monitoring, and management of special populations, providing comprehensive guidance for the prevention, medication, and care for AD patients [19–22]. The whole-course management strategy for AD patients is significantly different from that of other dermatitis and eczema conditions. Therefore, in this study, the Chinese diagnostic criteria for AD were used to categorize patients with dermatitis and eczema into AD and non-AD groups. Subsequently, a prediction model was developed using univariate and multivariate logistic regression analyses to quantitatively assess the risk of AD among patients with dermatitis and eczema, aiming to assist clinical decision-making and improve patient prognosis.
Relative to patients with other types of dermatitis and eczema, those with AD tend to have more frequent doctor visits due to prolonged disease duration, persistent pruritus, and its significant impact on their daily life, which further confirms the substantial disease burden of AD. The number of medical visits was significantly higher in the AD group than in the non-AD group in the present study. A study by Fishbein et al. [23] showed that a family history of allergic diseases, including asthma and allergic rhinitis, increases the risk of AD. Further research [24] has indicated that if 1 parent has an allergic disease, the risk of their offspring developing AD increases by 1.5 times. In the present study, the proportions of patients with a history of allergic diseases and a family history of allergy were higher in the AD group than in the non-AD group, consistent with previous findings. Moreover, AD frequently presents early in life [25], with approximately 60% of patients developing symptoms within the first year of life and about 90% by the age of 5 [26]. In the present study, the age of patients in the AD group was lower than that of those in the non-AD group, and the proportion with a history of infantile onset was higher in the AD group, aligning with prior research.
Prior studies have demonstrated that upon activation by allergens, Th2 cells secrete cytokines such as interleukin-4 (IL-4) and IL-13, which initiate type 2 inflammatory responses and impair the integrity of the skin barrier [27, 28]. IL-4 and IL-13 jointly induce the migration of differentiated EOS to inflammatory sites, enhance EOS degranulation, and promote class switching in B cells to produce IgE. This leads to elevated peripheral blood EOS and serum tIgE levels, both of which play important roles in the pathogenesis of AD [29–31]. Elevated IgE is associated with extrinsic AD and atopic comorbidities, and up to 25% of AD patients may harbour IgE that targets keratinocytes, further contributing to skin barrier damage [32]. Another study showed that changes in IgE levels during treatment may be used to monitor treatment efficacy [33]. In the present study, both EOS count and serum tIgE level were significantly higher in the AD group compared to the non-AD group, supporting the central role of Th2-type immune responses in AD pathogenesis and suggesting the potential value of EOS and tIgE as biomarkers in evaluating AD severity. Therefore, these two objective laboratory markers were included in the risk nomogram model developed herein.
This study revealed that the number of doctor visits, history of allergic diseases, family history of allergy, and infantile onset history were all significantly associated with a higher risk of AD. This suggests that dermatologists should pay special attention to patients with dermatitis and eczema who have frequent medical visits, a history of allergic diseases, a family history of allergy, and early onset, and consider early interventions to improve outcomes. As an atopic disease [34], EOS count and tIgE levels are key laboratory indicators. However, in the univariate and multivariate analysis in this study, EOS count did not remain significantly associated with AD incidence, possibly due to the chronic nature of the disease in many patients who had already received prior treatment. Previous studies have shown that peripheral blood EOS levels gradually decline and stabilize after treatment [35–37]. However, although age and tIgE levels showed significant associations with the outcome in univariate analysis, they were not significant in multivariate analysis. This may be due to the interference of confounding factors, insufficient sample size, or dilution of the effect size. Notably, elevated tIgE level is usually the result of immune responses after AD onset rather than an independent pathogenic cause [38]. Clinically, the interpretation of IgE levels should be individualized by considering patient phenotypes, allergen detection profiles, and genetic background.
Based on the above influencing factors, a risk nomogram model was constructed to visually represent the relationship between these factors and AD risk more intuitively. The area under the ROC curve was greater than 0.8 both in the training and validation sets, demonstrating good discriminative ability of the model. The calibration curve revealed good agreement between predicted and actual probabilities. Additionally, DCA demonstrated that the model had certain clinical application value. These results suggest that the regression model has strong predictive capability and generalizability and may assist junior physicians and community-level hospitals in more accurately assessing the risk of AD.
The study has several limitations. As a single-centre study with a small sample size, it is susceptible to the introduction of bias. Moreover, the results are only reflective of the patient population of the hospital where the study was conducted. Meanwhile, we noticed that the sensitivity of the model is not particularly high. Possible reasons include the fact that potential confounding variables, such as lifestyle factors (e.g., hygiene and dietary habits), genetic susceptibility, and environmental exposures, have not been taken into account. On the other hand, the small sample size and uneven distribution of samples have limited the model’s ability to comprehensively capture the characteristics and patterns of the predicted outcomes. Furthermore, due to limitations in current detection methods, some potentially relevant influencing factors, such as ultraviolet exposure, gut microbiota dysregulation, and psychological status, could not be included in these analyses.
Conclusions
In this study, the factors that influence AD were investigated and used to guide the development of a nomogram prediction model with a high clinical predictive value. The resultant model is expected to provide a reliable basis for assessing the risk of AD, and to support prevention efforts and the advancement of precision medicine. In the future, we plan to expand the sample size, comprehensively investigate additional influencing factors of AD, conduct external validation to demonstrate the model’s generalization ability, explore the molecular mechanisms of AD pathogenesis in-depth, refine clinical application strategies, and provide more effective solutions for clinical practice.


