
Introduction
The main goal of asthma management is to achieve good symptom control and minimise the risk of exacerbations [1]. Lack of asthma control can be caused by several factors, including phenotype, lack of compliance, continuous exposure to irritants, and drug resistance.
There is evidence of the significance of peripheral airways in asthma management [2]. Inflammation in the peripheral airways is associated with bronchial hyperresponsiveness and the deterioration of asthma control. Moreover, the inability of conventional inhalation therapy to effectively reach this area of the lung is one of the possible causes of uncontrolled disease [3]. Therefore, the need to monitor peripheral airway function to the level of the acinus is apparent. Although spirometry is widely used to detect airflow limitation, it is not considered a sensitive test for the peripheral airways. In the assessment of peripheral airway function are tests evaluating premature airway closure, air trapping, respiratory impedance, and ventilation inhomogeneity are more useful [4]. These methods include impulse oscillometry (IOS), which measures airway resistance and the elastic properties of the peripheral airways [5], nitrogen multiple-breath washout test (N2MBW), which quantifies ventilation inhomogeneity [6], and body plethysmography, which provides additional information on lung volumes and airway resistance [7]. The advantage of these methods is that they evaluate pulmonary function during tidal breathing, which requires only passive cooperation and is especially useful in the paediatric population and for patients who cannot perform forced respiratory manoeuvres. Therefore, some of these methods (e.g. IOS) are becoming widely available and can be successfully implemented in outpatient care settings. Although several studies have reported the usefulness of N2MBW, IOS, and body plethysmography in the assessment of paediatric asthma, it is still unclear which method most effectively predicts poor asthma control in children. Each of these tests evaluates different properties of the peripheral airways and reflects disparate aspects of their function. Therefore, this study was conducted to compare the diagnostic accuracy of several peripheral airway function measures as predictors of poor asthma control in children [8, 9].
Aim
This study aims to assess the value of peripheral airway measurements derived from N2MBW, IOS, and body plethysmography for the assessment of asthma control in children and to determine which of the methods best differentiates between children with controlled and uncontrolled asthma.
Material and methods
The Ethics Committee of the Medical University of Warsaw approved this study. Children aged 6–17 years with asthma who attended the Department of Paediatric Pneumonology and Allergy of the Medical University of Warsaw between April 2018 and April 2020 and met the inclusion criteria were recruited. The inclusion criteria were the ability to perform lung function tests and the provision of signed informed consent for participation by the parents/caregivers. The exclusion criteria included a diagnosis of other chronic pulmonary diseases, congenital lung malformation, congenital heart disease, or bronchopulmonary dysplasia and a history of prematurity, low birth weight, or need for mechanical ventilation in the neonatal period. Asthma diagnosis and severity assessment were based on the Global Initiative for Asthma (GINA) guidelines [1]. Asthma control at the time of the study was determined using the Asthma Control Test (ACT) for children ≥ 12 years of age and the Childhood Asthma Control Test (cACT) for children < 12 years of age [10]. Poorly controlled asthma was defined according to an ACT or cACT score ≤ 19 points. Controlled asthma was defined as an ACT score of 20–25 or cACT score of 20–27 points and no report of exacerbations or changes in symptoms or medication use for at least 6 weeks before the study.
Procedures
The participants underwent pulmonary function testing (PFT) in the following order: IOS (Vyntus IOS; CareFusion, San Diego, CA, USA), fractional exhaled nitric oxide (NO) (NOA 280i; Sievers; GE Analytical Instruments, Boulder, CO, USA), N2MBW (Exhalyzer®DN2 MBW device; Eco Medics AG, Duernten, Switzerland, software version Spiroware 3.2.1, the data then had been recalculated for Spiroware 3.3.1), spirometry (Vyntus IOS; CareFusion, San Diego, CA, USA), and body plethysmography (Master Screen Body; CareFusion, San Diego, CA, USA). All measurements were performed according to American Thoracic Society/European Respiratory Society recommendations [11, 12] and published guidelines for N2MBW and IOS [13–15]. Recorded parameters in spirometry included forced expiratory volume in 1 s (FEV1), forced vital capacity (FVC), and FEV1/FVC ratio. Body plethysmography measurements included specific airway resistance (sReff), total lung capacity (TLC), residual volume (RV), and RV/TLC ratio. Resistance at 5 Hz (R5), resistance at 20 Hz (R20), frequency dependence of resistance (R5–R20), reactance at 5 Hz (X5), the area under the curve of reactance between 5 Hz and resonant frequency (AX), and resonance frequency (Fres) were assessed via IOS. Lung clearance index (LCI) at 2.5% of the initial concentration of N2, conductive ventilation inhomogeneity (Scond), and acinar ventilation inhomogeneity (Sacin) were calculated via N2MBW test. Finally, the fraction of expired NO (FeNO) was asessed. All measured parameters are expressed as z-scores, except FeNO, R5-R20, AX, and all N2MBW measurements, which are presented only as absolute values. Reference values were provided by the Global Lung Function Initiative 2012 for spirometry [16], Zapletal et al. for body plethysmography [17], Dencker et al. for IOS [18]. For N2MBW reference values provided by Anagnostopoulou et al. were applied [19]. The abnormal results were defined as z-scores exceeding the range from –1.645 to 1.645. An obstructive ventilatory defect was defined as a z-score of FEV1/FVC ratio < –1.645, and air trapping was diagnosed when the z-score of the RV/TLC ratio was > 1.645.
Statistical analysis
Statistical analysis was performed using the Statistica 13.3 software package (StatSoft, Inc., Tulsa, OK, USA). Data are presented as medians and interquartile ranges. Due to non-normal distribution, non-parametric tests were used: Mann-Whitney U test for interval variables and χ2 test for quantitative variables. The two-tailed significance level was set at p < 0.05. The receiver operating characteristic (ROC) method was used to evaluate the accuracy of peripheral airway measures for predicting asthma control. The area under the ROC (AUC) was calculated. Only parameters for which significant differences between the two study groups were found were included in the analysis.
Results
Baseline patient characteristics
Sixty-four children aged 6–17 years were included in this study. Thirty-five children were classified as having controlled asthma, and 29 children were assigned to the uncontrolled asthma group. There were no significant differences in demographic characteristics (i.e. age, height, weight, and body mass index) between the study groups. The groups were comparable in terms of asthma severity according to the GINA score. Most of the patients with asthma were receiving regular treatment at the time of the study (Table 1).
Table 1
Patient characteristics. Data are presented as median and IQR.
| Parameter | Controlled asthma n = 35 | Uncontrolled asthma n = 29 | P-value |
|---|---|---|---|
| Age [years]† | 12 (7–17) | 13 (6–17) | > 0.05 |
| Male sex/whole group§ | 23/35 | 18/29 | > 0.05 |
| Height (%)† | 158 (145–170) | 157 (147–163) | > 0.05 |
| Weight (%)† | 50 (37–62) | 50 (36–68) | > 0.05 |
| BMI (%)‡ | 19 (17–23) | 19 (17–24) | > 0.05 |
| ACT score† | 25 (23–-25) | 19 (18–19) | < 0.01 |
| Daily corticosteroid dose (µg budesonide equivalent) | 222 | 226,2 | > 0.05 |
| Inhaled corticosteroid and long-acting β agonist§ | 56% (13/23) | 45% (9/20) | > 0.05 |
| Inhaled corticosteroid and leukotriene antagonist§ | 4% (1/23) | 5% (1/20) | > 0.05 |
| GINA 1–2§ | 34% (12/35) | 34% (10/29) | > 0.05 |
| GINA 3§ | 46% (16/35) | 41% (12/29) | > 0.05 |
| GINA 4–5§ | 20% (7/35) | 24% (7/29) | > 0.05 |
Comparison of pulmonary function parameters according to control status
Several PFT parameters differed significantly between the groups (Table 2). Spirometry revealed significant differences between the groups regarding parameters reflecting airway patency, which were significantly lower in the group with uncontrolled asthma (p < 0.01 for FEV1 and p = 0.03 for FEV1/FVC). Body plethysmography revealed significantly higher specific resistance in the group with uncontrolled asthma (p = 0.01). The RV/TLC ratio, which indicates air trapping, was not significantly different between the study groups; however, the prevalence of abnormal RV/TLC ratios was higher in children with uncontrolled asthma (14%, 4/29) compared with those with controlled asthma (6%, 2/35). There were significant differences in all N2MBW parameters between the study groups, with the higher results in the group with uncontrolled asthma (p < 0.01 for all N2MBW measurements, i.e. LCI, Scond, Sacin). Several peripheral airway parameters measured via IOS differed significantly between the study groups (p < 0.01 for AX, Fres, and p = 0.02 for R5–R20). However, there were no significant differences in the median R5 and X5 z-scores between the groups. The median exhaled NO value in children with uncontrolled asthma was higher than in children with controlled asthma; however, the difference was not statistically significant.
Table 2
Pulmonary function measurements and observed differences between study groups. All results are presented as z-scores, except R5-R20, AX, LCI, Scond and Sacin. Data are presented as median and IQR
[i] FEV1 – forced expiratory volume in 1 s, FVC – forced vital capacity, RV – residual volume, TLC – total lung capacity, RV/TLC – ratio of residual volume to total lung capacity, sReff – specific airway resistance, R5 – resistance at 5 Hz, R20 – resistance at 20 Hz, R5–R20 – frequency dependence of resistance, X5 – reactance at 5 Hz, AX – area under the reactance curve, Fres – resonant frequency, Scond – conductive ventilation inhomogeneity, Sacin – acinar ventilation inhomogeneity, LCI – lung clearance index, FeNO – fractional exhaled nitric oxide. All variables compared by U-Mann-Whitney test.
Diagnostic accuracy of peripheral airway measures for poor asthma control
ROC analysis was performed to identify the discriminative properties of the measurements in distinguishing between children with controlled and uncontrolled asthma (Table 3, Figure 1). Peripheral airway parameters, including AX, R5–R20, Fres, ventilation heterogeneity indices, and sReff, performed well, with disparate specificity and sensitivity. LCI, Sacin and Fres had the best performance metrics (AUC = 0.76, 0.73 and 0.74, respectively). It should be emphasised that Sacin had the highest sensitivity (0.85) for predicting poor asthma control among all the peripheral airway function measures; however, it had low specificity (0.54). In contrast, LCI and Fres had high specificity (LCI: 0.97 and Fres: 1.0) but low sensitivity (LCI: 0.46 and Fres: 0.38) for predicting control status. Compared with LCI and Sacin, Scond had slightly lower diagnostic accuracy for asthma control (AUC = 0.71), with low specificity (0.57), but high sensitivity (0.82) for predicting asthma control status.
Figure 1
Receiver operator characteristics (ROC) curves for body plethysmography specific airway resistance (sReff), impulse oscillometry and inert gas washout test measures to identify uncontrolled asthma
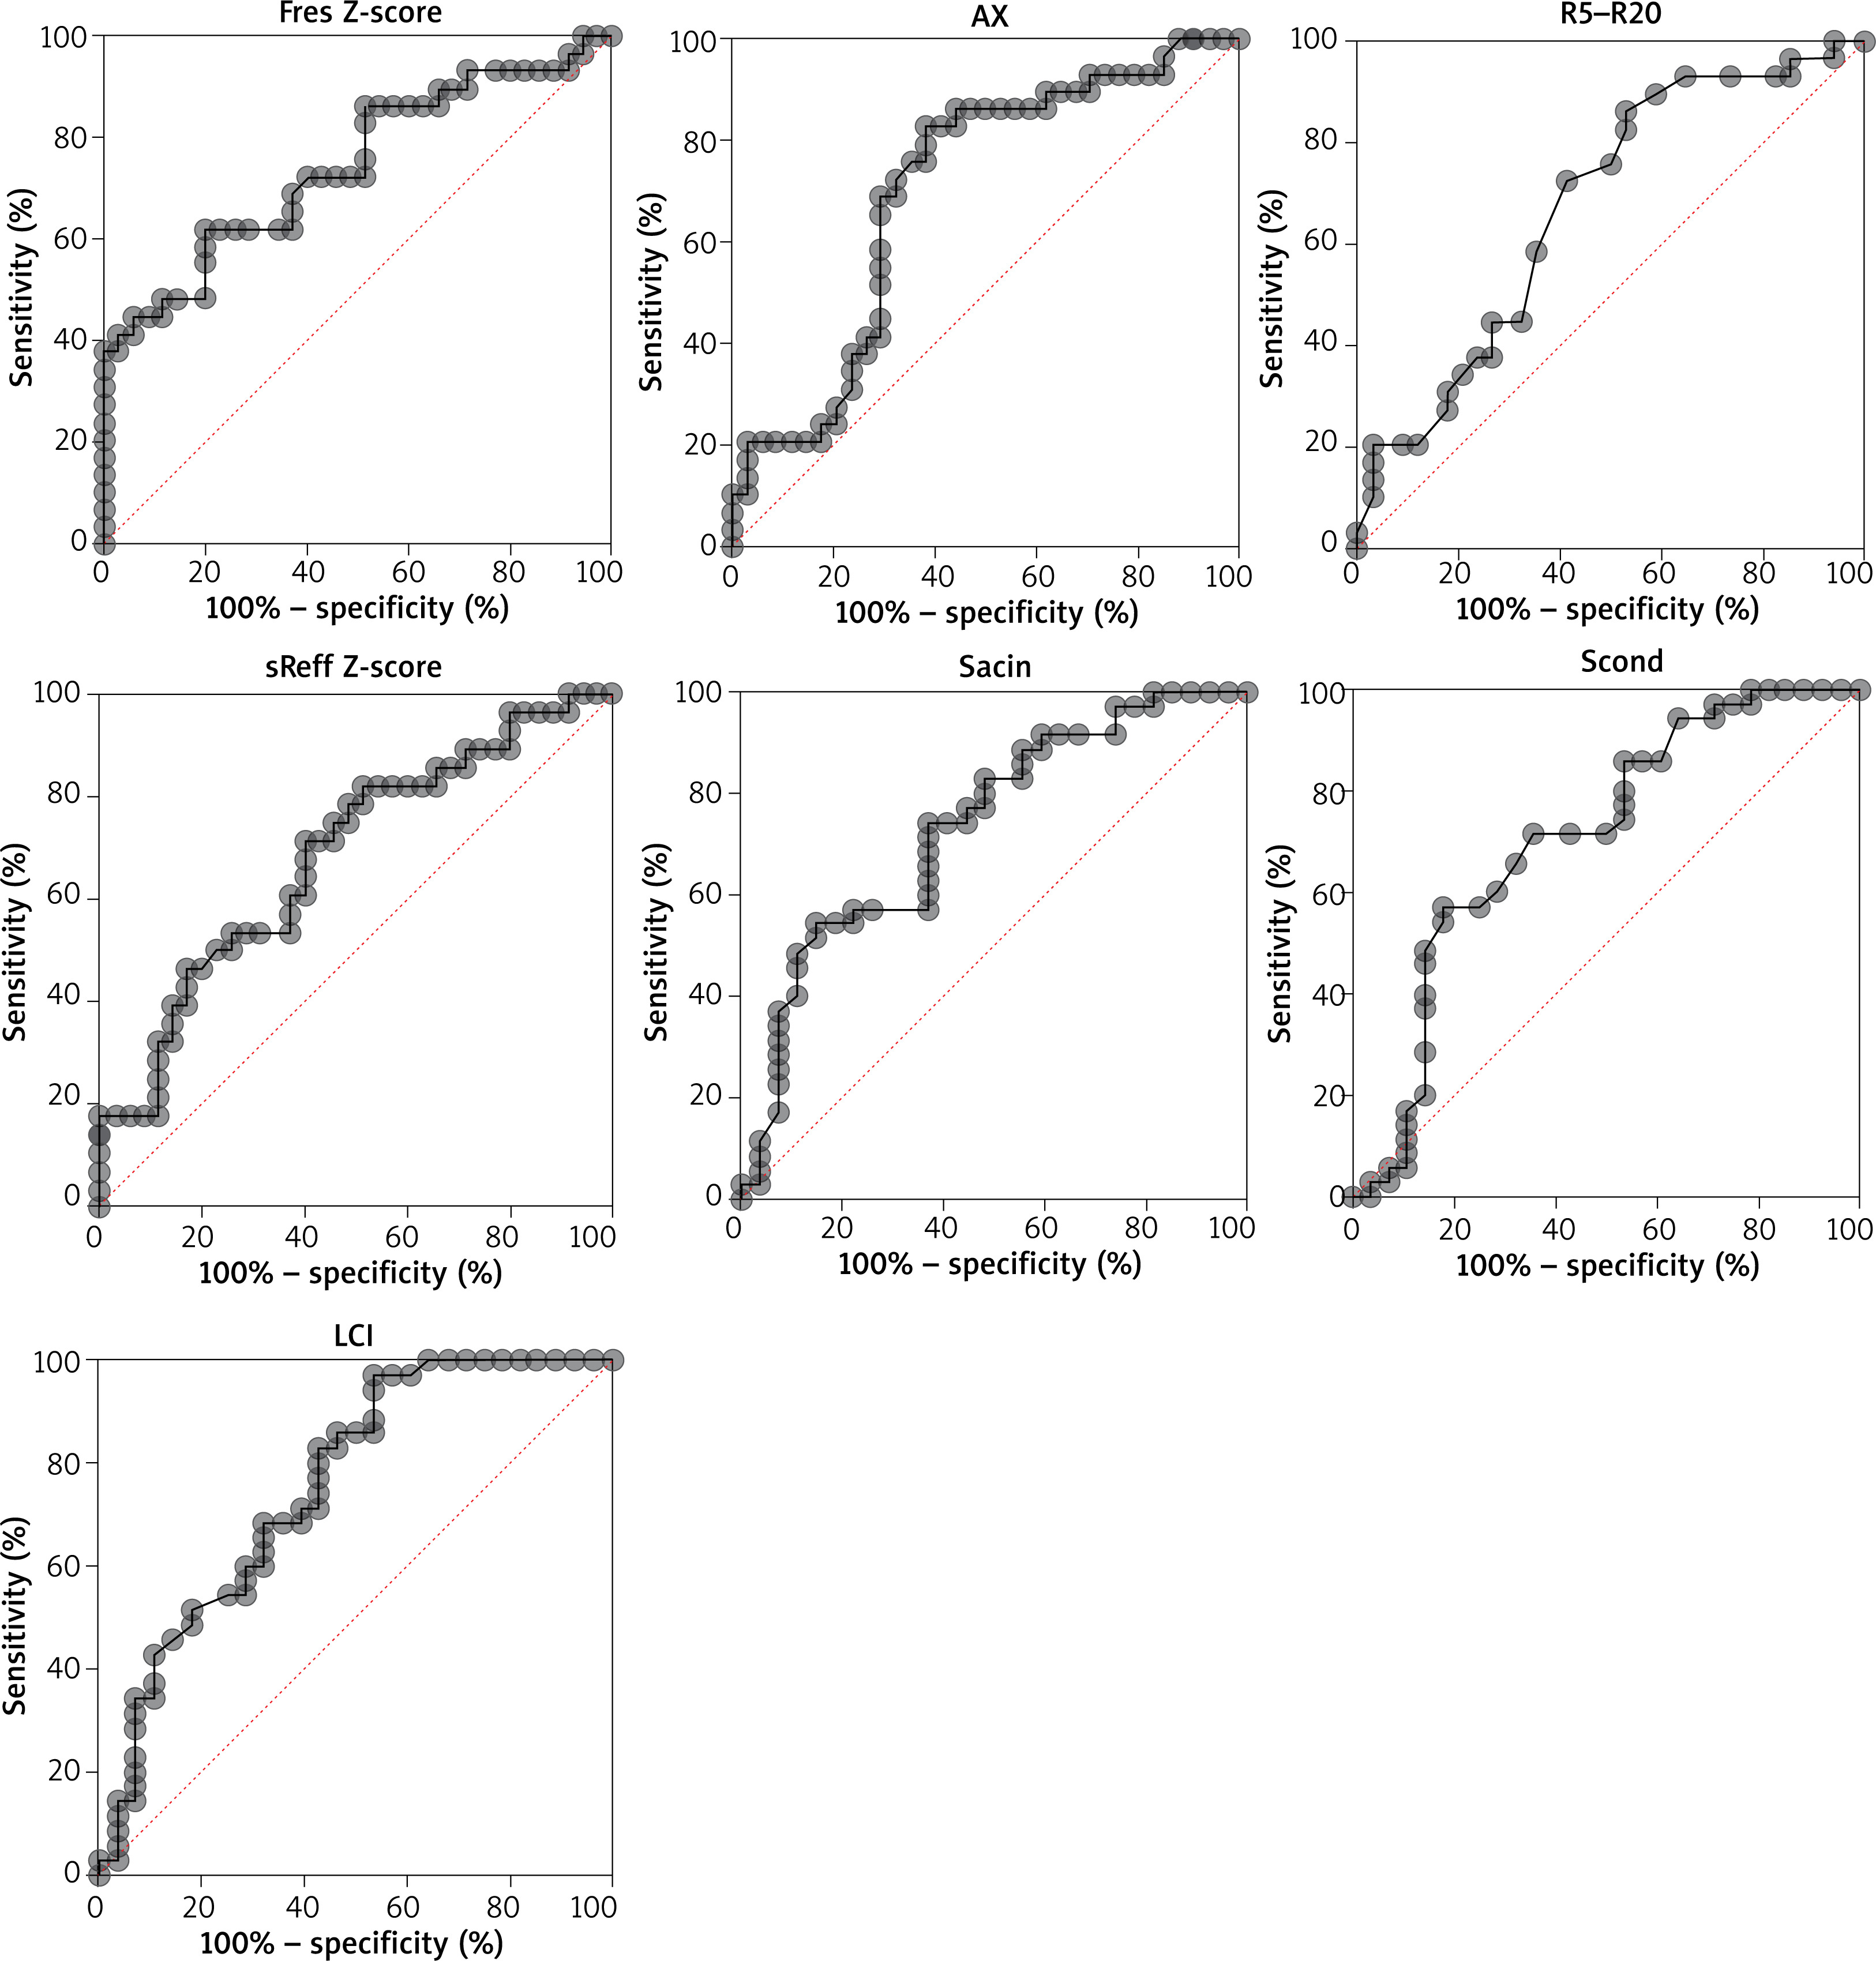
Table 3
Diagnostic accuracy of peripheral airways function measurements. ROC analyses were performed for all variables in z-scores, except R5–-R20 and AX
[i] sReff – specific airway resistance, R5–R20 – frequency dependence of resistance, AX – area under the curve of reactance between 5Hz and resonant frequency, Fres – resonant frequency, Scond – conductive ventilation inhomogeneity, Sacin – acinar ventilation inhomogeneity, LCI – lung clearance index, AUC – area under the curve, CI – confidence interval.
Among all the IOS variables, Fres performed best. The results for AX and R5–R20 indicated good utility in distinguishing between children with controlled and uncontrolled asthma, with favourable sensitivity (AX: 0.83, R5–R20: 0.72) but low specificity (AX: 0.62, R5–R20: 0.59). The results for body plethysmography revealed that specific resistance had high specificity (0.8) but low sensitivity (0.46) for indicating asthma control (AUC = 0.68).
Discussion
This study highlights the utility of peripheral airway measures in the assessment of asthma control in children. Most of the evaluated parameters were significantly increased in children with uncontrolled asthma. LCI had the highest diagnostic accuracy for asthma control, which represents overall ventilation heterogeneity, and it was highly specific for uncontrolled asthma. Sacin was the most sensitive indicator of uncontrolled asthma among all the peripheral airway measures. This is in line with some recently published study outcomes. In a study by Keen et al., increased Sacin values were found in children with uncontrolled asthma [20]. Ventilation heterogeneity within the acinus positively correlated with alveolar exhaled NO concentration, which indicates the presence of inflammatory processes in this area of the lung and disease activity. These findings suggest that the peripherally located acinar zone is an important target for asthma therapy. The remaining N2MBW parameter – Scond, which represents the ventilation inhomogeneity within conductive airways – also had good sensitivity for uncontrolled asthma. These results are consistent with recent studies confirming the relationship between conductive airway disturbances and asthma control [8, 18]. According to the IOS measurements, Fres, AX and R5–R20 were significantly higher in children with uncontrolled asthma. The increase in Fres, AX, and R5–R20 in symptomatic patients may be related to an increase in peripheral airway tone and a decrease in lung compliance, which reflects increased stiffness in the lung tissue [19]. Lungs with decreased compliance have impaired capacitive energy storage and require high pressure to inflate. Resonance frequency provided the highest diagnostic accuracy among all IOS measures and high specificity for asthma control. This might suggest that children with good symptom control are likely to have a Fres in the normal range. On the contrary, AX and R5–R20 were highly sensitive for uncontrolled asthma. Distinctions in performance metrics between these parameters (i.e. Fres, AX, and R5-R20), including sensitivity and specificity, might be related to the higher variability of Fres compared with AX. AX represents the integrated response of all frequencies between 5 Hz and Fres, while Fres reflects the response at a specific frequency. Therefore, AX is more sensitive than Fres in indicating asthma control status. In addition, the comparable performance of AX and R5–R20 indicates that they provide integrative information, as it has been suggested recently [19]. At equivalent airway pressures, stiffer peripheral airways have a smaller calibre, which increases the resistance to flow [8, 20, 21]. The results of this study did not indicate significant differences in z-scores for X5 or R5 between children with controlled and uncontrolled asthma. This observation is in line with recently published study outcomes that indicated the low utility of X5 and R5 for the evaluation of paediatric asthma [22, 23]. Specific airway resistance measured by body plethysmography is a promising diagnostic tool in the assessment of asthma control [24–26]. Mahut et al. reported a good correlation between peripheral airway function and asthma symptom burden [26]. In our study, sReff had moderate diagnostic accuracy and high specificity for poor asthma control. Although the additional value of air trapping – defined as abnormal RV/TLC in the assessment of asthma control in children was recently recognised by Korten et al. and Labbé et al., it is important to note that it is a relatively infrequently used clinical indicator of obstruction in the peripheral airways, and its presence indicates significantly exacerbated changes in this area [27–29]. In a study conducted by Postma et al. on adults with asthma, abnormal RV/TLC ratio had the lowest prevalence among all peripheral airway parameters (i.e. IOS and N2MBW indices, FEF25–75, and FVC via spirometry) evaluated as measures of peripheral airway dysfunction [30]. In our study, no significant differences were observed in air trapping between the two study groups; however, the prevalence of abnormal results was slightly higher in children with uncontrolled asthma compared with children with controlled asthma. Therefore, further research on a larger group of patients is needed to clarify RV/TLC utility in assessment of paediatric asthma. Our findings did not indicate differences in FeNO between the two study groups, which may have been related to the high prevalence of corticosteroid treatment in most children with controlled or uncontrolled asthma. Furthermore, a recent study has reported the low utility of FeNO in the assessment of asthma control in children [30].
The present cross-sectional study included a limited number of patients; therefore, the results must be interpreted with caution. However, the main findings of the study are in line with recent reports.
Conclusions
Among the evaluated peripheral airway parameters, LCI, Sacin and Fres had the best discriminative capacity for poor symptom control in children with asthma. However, none of the measures had ideal performance metrics or perfect sensitivity and specificity, suggesting that a combination of measures would be most effective. While body plethysmography had lower overall diagnostic accuracy for asthma control, specific airway resistance is a promising diagnostic tool in the assessment of children with asthma.


