
Introduction
Hepatocellular carcinoma (HCC) is considered as one of the most common malignant tumors as well as an ecumenical health concern [1]. Parallel to several other tumors, HCC is recognized by the involvement of several gene networks in addition to imbalance of many signaling pathways [2, 3]. Protein-coding genes and noncoding RNA (ncRNA) genes are involved in these genetic dysregulations [4]. Although the former was the research subject, the latter (ncRNA) has recently been realized to play a part in the pathological processes involved in HCC development. It is noteworthy that the great plurality of the human genome is transcribed into ncRNA, whereas 2% or less of the genome encodes proteins directly [5].
Functional RNA that is not translated into protein is called ncRNA. ncRNAs include ribosomal RNA (rRNA), transfer RNA (tRNA), and small nuclear ribonucleic acids (snRNA) that process pre-mRNA, piwiinteracting RNA (piRNA), long noncoding RNA (lncRNA), microRNA (miRNA), etc. [6]. The ability to perform biological functions at the gene expression level is a common characteristic feature of these RNAs [7].
Plentiful ncRNAs were described as functional molecules that have a crucial function in different biological processes and pathological conditions through the advances in high-throughput sequencing technology [8]. lncRNAs and miRNA organize different pathological processes, such as tumor occurrence [9]. Some essential ncRNAs have been recognized to participate in the pathophysiology of the disease in the scope of HCC [10].
Hypoxia-inducible factors (HIFs) are identified as essential transcriptional regulators which are activated during hypoxia [11]. The study on HIFs is currently concentrated on two main manifestations, the transcriptional regulation mechanism of HIFs as well as the cancer therapy that targets HIFs [12].
Plasmacytoma variant translocation 1 (PVT1) is one of the lncRNA class that is encoded by the PVT1 gene (also recognized as the Pvt1 oncogene). PVT1 functions as an oncogene that participates in multiple cancers phenotype [13].
Antisense non-coding RNA in the INK4 locus (ANRIL) is a lncRNA that consists of 19 exons, spanning 126.3 kb in the genome [14]. It binds to CBX7 (Chromebox 7) in the polycomb repressive complex 1 and to SUZ12, a component of polycomb repression complex 2 and via these interactions has been implicated in transcriptional repression. ANRIL-mediated recruitment of these complexes alters the shape of epigenetic chromatin and, hence, in a cis-acting manner it suppresses the expression of such a gene cluster [15]. Thus, in this study we aimed to estimate the differential expression of lncRNA (aHIF, hPVT1, and ANRIL) in HCC on top of chronic HCV and HBV infections and determine whether lncRNAs were selectively dysregulated according to viral etiology, and furthermore we studied their associations with clinical criteria.
Material and methods
Subjects
This study was carried out in the Tropical Medicine Department in collaboration with the Medical Biochemistry and Molecular Biology Department, Faculty of Medicine. This study included one hundred and eighty-two participants. They were selected from the Tropical Medicine Department between April 2017 and December 2019. Participants were categorized into four groups: group A included 45 HCC patients with chronic HCV infection, group B was composed of forty HCC patients with chronic HBV infection, group C included 50 patients with liver cirrhosis on top of chronic viral hepatitis: HCV (37 patients) or HBV (13 patients), and group D comprised 47 apparently healthy subjects who were HBV and HCV negative and of matched age and gender as controls. HBV and HCV infections were identified by detecting HCVAb or HBsAg that was established by real-time polymerase chain reaction (PCR).
For all subjects, history, clinical evaluation, laboratory investigations and abdomino-pelvic ultrasonography were done. Patients with HCC or liver cirrhosis not related to chronic HBV or HCV were excluded from the study in addition to previously treated HCC patients and patients with malignant disease elsewhere in the body. Hepatocellular carcinoma detected in ultrasound evaluation was confirmed by characteristic features in triphasic computed tomography (CT) (wash out lesions). HCC patients were exposed to baseline computed tomography of the chest, abdomen and pelvis and bone scan for valuation of distant metastases.
Ethical approval: This study was performed under the direction of the Helsinki Declaration. All participants gave informed consent assured by the Faculty of Medicine, Menoufia University ethical committee.
Methods
Blood sampling
All subjects in this study donated 10 ml venous blood samples. Five milliliters of fresh blood were used for estimation of the following: Two milliliters of fresh blood were placed in ethylenediamine tetra-acetic acid (EDTA)-containing tubes and were used for a complete blood count (CBC) by Sysmex XN-1000 (Japan, 19723, B.M Egypt company). One milliliter of fresh blood was gathered in a citrate tube for PT and INR measurement (BIOMED – LIQUIPLASTIN diagnostic kit, Germany). Two milliliters of fresh blood were placed in EDTA-containing tubes, then centrifuged at 4000 rpm for 10 min for separation of plasma that was further used for lncRNA extraction and quantification by real-time PCR.
Serum was isolated from the remaining 5 ml of blood in a plain tube, left to coagulate for 30 min, then centrifuged at 4000 rpm for 10 min; for further investigation of liver function tests including serum alanine aminotransferase (ALT), aspartate aminotransferase (AST) by the kinetic UV-optimized method IFCC LTEC Kit (England), serum albumin by employing a quantitative method of enhanced specificity, the bromocresol green colorimetric method, by a Diamond Diagnostic Kit (Germany), total and direct bilirubin was assayed by a Diamond Diagnostics Kit (Germany), serum creatinine by standard colorimetric tests utilizing a Diamond Diagnostics Kit (Germany), serum urea by Mod Berthelot enzymatic colorimetric method using a Diamond Diagnostics Kit (Germany). Detection of α-fetoprotein (AFP) and serological markers of HCVAb and HBsAg was performed by enzyme-linked fluorescent immunoassay (ELFA) utilizing miniVIDAS systems (bioMerieux, Marcy l’Etoile, France); positive tests were assured by real-time PCR to give precise quantitation of HCV RNA and HBV DNA.
Detection and quantitation of lncRNAs by real-time PCR
First the lncRNAs were extracted from plasma samples using a miRNeasy Mini Kit (cat. no. 217004, Qiagen, Germany) that syndicates phenol/guanidine-based samples’ lysis with silica-membrane-based purification of RNA. Secondly, reverse transcription (RT) of RNA into cDNA by high capacity cDNA Reverse Transcription Kits supplied by Thermo Fisher Scientific, Applied Biosystem, was performed. Then 20 µl of cDNA RT reaction mixture was prepared as follows: 10 µl of RNA sample and 10 µl of 2x RT master mix (that includes 2 µl of 10X RT buffer, 0.8 µl of 25X DNTP Mix (100 mM), 2 µl of 10X RT random primers, 1 µl of MultiScribe reverse transcriptase, 1 µl of RNase inhibitor and 3.2 µl of nuclease free water). The thermal cycler (2720 Singapore) was programmed in these conditions: 25°C for 10 min, 37°C for 120 min, 85°C for 5 min and hold at 4°C. Finally, the quantitative step of lncRNAs including: ANRIL, aHIF and hPVT1 was performed using a real-time PCR instrument (Applied Biosystems 7500 thermal cycler, Foster City, CA, USA) using primers supplied by Thermo Fisher Scientific, Invitrogen, USA, as follows: ANRIL: Forward 5’ CAACATCCACCACTGGATCTTAACA 3’, Reverse 5’ AGCTTCGTATCCCCAATGAGATACA 3’, aHIF: Forward 5’ TTTGTGTTTGAGCATTTTAATAGGC 3’, Reverse 5’ CCAGGCCCCTTTGATCAGCTT 3’, hPVT1: Forward 5’ AAAACGGCAGCAGGAAATGT 3’, Reverse 5’ ATTCCCATAGAAGGGGCAGG 3’. LncRNAs expression was normalized by using glyceraldehyde 3-phosphate dehydrogenase (GAPDH) as a reference gene: Forward 5’ CTCTGCTCCTCCTGTTCGAC 3’, Reverse 5’ TTAAAAGCAGCCCTGGTGAC 3’.
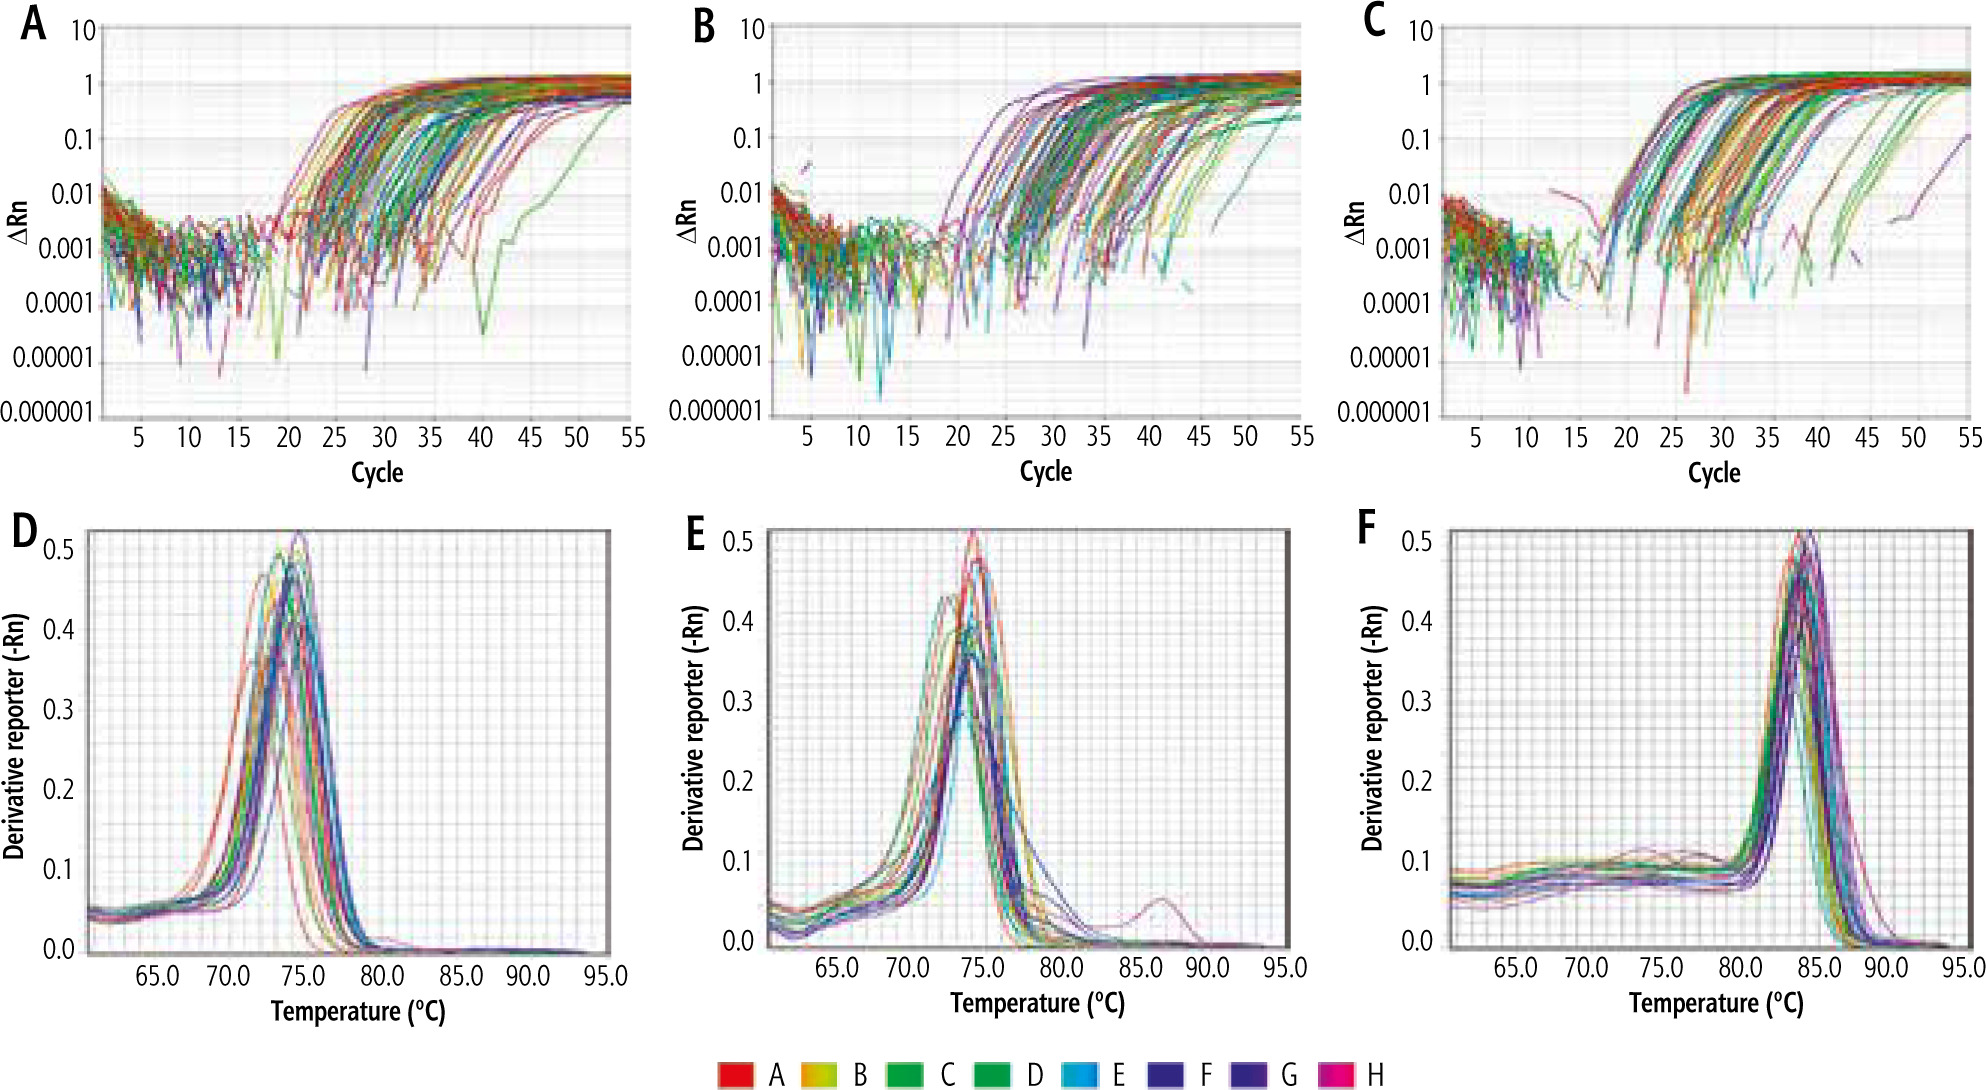
The total volume of the PCR reaction mix for each sample was calculated as 20 µl that contains 10 µl of SYBR green master mix with low ROX dye (Thermo Fisher Scientific, Applied Biosystem), 1 µl of forward primer of both target and reference gene and 1 µl of reverse primer of both target and reference, 3 µl of cDNA (RT) product and 5 µl of nuclease free water. Thermal cycler conditions were initial denaturation at 95°C for 10 minutes followed by 45 cycles of denaturation at 95°C for 15 s and annealing/extension at 60°C for 1 minute. The comparative ΔΔ Ct (cycle threshold) method was used for relative quantitation (RQ), where the amount of target genes ANRIL (Fig. 1A), aHIF (Fig. 1B), hPVT1 (Fig. 1C) are standardized to an endogenous reference gene (GAPDH) as a control. Melting curve analysis was applied for ANRIL (Fig. 1D), aHIF (Fig. 1E), hPVT1 (Fig. 1F) to specify target amplification and to exclude nonspecific amplicons and primer dimers.
Statistical analysis
Data were transferred to the computer and evaluated by means of IBM SPSS version 20.0. (Armonk, NY: IBM Corp.). The Kolmogorov-Smirnov test was performed to verify the normality of variables’ distribution. Receiver operating characteristic curve (ROC) analysis was applied to determine the diagnostic performance of the markers; area > 50% gives satisfactory performance and area about 100% is the best performance. Logistic regression analysis was applied to identify the most independent/affecting factor for influencing patients with HCC on top of chronic HBV and HCV infection. Significance of the obtained results was decided at the 5% level.
Results
This research was performed on 135 patients; they were 108 males (80%) and 27 females (20%) with age ranging from 35 to 75 years. Patients were grouped into 3 groups: group A comprised 45 HCC patients with chronic HCV infection, 34 (75.6%) males and 11 (24.4%) females with a mean age of 55.1 ±12.7; group B was composed of 40 patients with HCC related to chronic HBV infection, 36 (90%) males and 4 (10%) females with a mean age of 50.25 ±8.20; and group C included 50 patients with liver cirrhosis on top of chronic viral hepatitis; HCV or HBV, 38 (76%) males and 12 (24%) females with a mean age of 51.2 ±10.0. In addition, 47 apparently normal individuals with negative HBsAg and HCVAb and of matched age and gender formed a control group (group D) (Table 1).
Table 1
Comparison between the four studied groups according to demographic data, laboratory investigation and lncRNAs markers
[ii] ALT – alanine aminotransferase, AST – aspartate aminotransferase, AFP – α-fetoprotein, Hb – hemoglobin concentration, WBCs – white blood cells, PLT – platelet count,
[iii] INR – international normalized ratio, ANRIL – antisense non-coding RNA in the INK4 locus, aHIF – hypoxia-inducible factors, PVT1 – plasmacytoma variant translocation 1, p – p value for comparing between the studied groups, * statistically significant at p ≤ 0.05
Patients in all groups showed obviously lower count of hemoglobin (Hb), white blood cells (WBCs) and platelets (p < 0.001) vs. controls. The post hoc test for pairwise comparison between each two patient groups revealed that WBC count was clearly lower in group A and group C (p < 0.001) than group B while it did not differ between groups A and C (p = 0.705). In addition, WBC count did not differ between group B and controls (p = 0.173), though Hb and platelets did not significantly differ between patient groups (p > 0.05). Hepatic functions consisting of ALT, total bilirubin and international normalized ratio (INR) (p < 0.001) were predominantly higher in all patients than in controls whereas albumin (p < 0.001) was lower in patients than controls. Pairwise comparison between each two patient groups showed that ALT and albumin did not significantly differ between patient groups but total bilirubin was higher in group C than in group A (p = 0.03) and there was no significant difference between other patient groups and INR was significantly higher in group C than in group A (p = 0.007) and group B (p = 0.001) though it did not differ between groups A and B (p = 0.563). Erythrocyte sedimentation rate (ESR) either estimated at the first or the second hour was markedly higher in groups A and B (p < 0.001) than healthy participants, indicating presence of hepatic inflammation while there was no difference between groups C and D (p > 0.05). Moreover, ESR was higher in both groups A and B than in group C (p < 0.001) while it did not differ between groups A and B (p > 0.05) (Table 1).
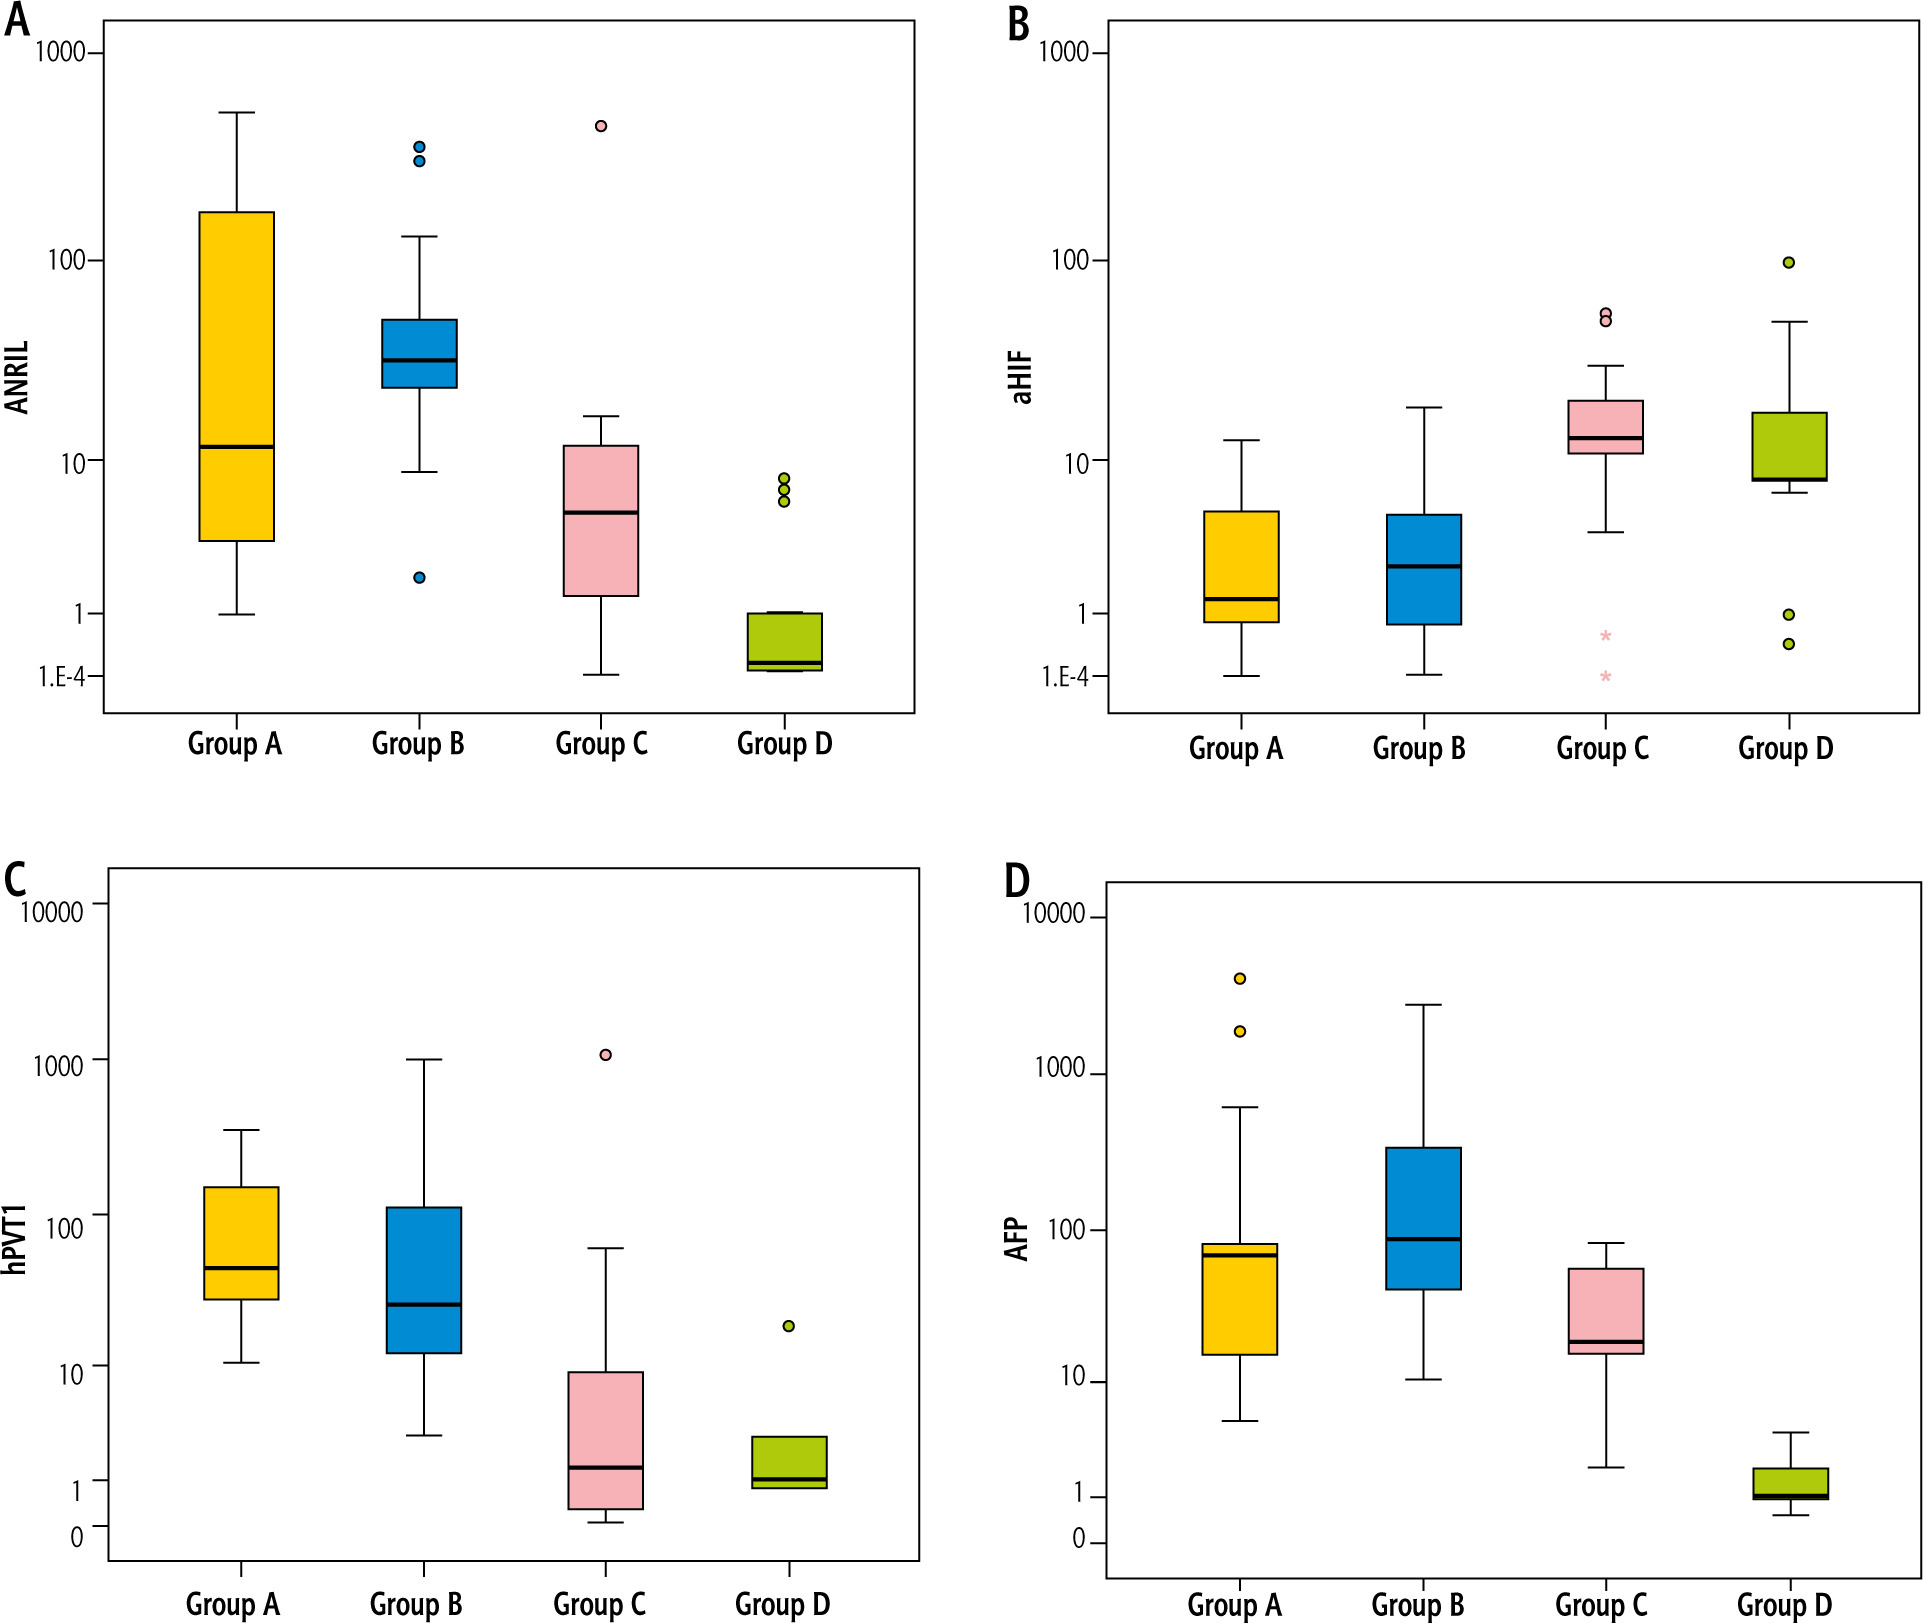
Investigations of hepatic biomarkers revealed that two of the studied lncRNAs, namely ANRIL (Fig. 2A) and hPVT1 (Fig. 2C), were distinctly upregulated in all patients vs. controls (p < 0.001). Dunn’s test for multiple comparisons showed that both were elevated in groups A and B when compared with group C (p < 0.001) while they did not differ between groups A and B even though hPVT1 values were higher in the cirrhotic group than in controls but it did not reach a significant value (p = 0.703). Concerning aHIF, it was evidently downregulated in patients versus controls (p < 0.001) (Fig. 2B). Between groups, it was clearly lower in groups A and B than group C (p < 0.001) while not differing between the 2 HCC groups (p = 0.714) as well as between cirrhotic and control groups (p = 0.053). Also, the classic hepatic biomarker AFP was significantly higher in patients than in the control group (p < 0.001) (Fig. 2D); furthermore, it was elevated in groups A (p = 0.025) and B (p < 0.001) vs. group C though it did not differ between groups A and B (p = 0.055) (Table 1).
Fig. 2
A) ANRIL upregulation in patients vs. controls, B) aHIF downregulation in patients vs. controls, C) hPVT1 upregulation in patients vs. controls, D) AFP upregulation in patients vs. controls
Clinical manifestations of the studied patients are presented in Table 2 where group B manifested the highest percentage of anorexia, 37 (92.5%) (p = 0.004), weight loss, 36 (90%) (p < 0.001) and cachexia, 26 (56%) (p = 0.008). However, other findings including history of abdominal pain, GIT bleeding (hematemesis and/or melena), hepatic encephalopathy, jaundice, edema of lower limbs, local examination of liver, spleen and ascites, and Child score did not differ among patient groups (p > 0.05).
Table 2
Comparison between the three studied groups according to clinical data and triphasic abdominal CT in patient groups
Table 2 presents the triphasic abdominal CT findings of the studied patients; group A presented the highest percentage of portal vein thrombosis 8 (17.8%) (p = 0.004). Hepatic focal lesions (number and size) did not differ between HCC patients in groups A and B (p > 0.05).
Spearman correlation of the hepatic biomarkers (ANRIL, aHIF, hPVT1 and AFP) with measured parameters in group A is shown in Table 3 where aHIF was positively related to platelets (r = 0.451, p = 0.002) and negatively related to maximum tumor size (r = –0.549, p < 0.001) though not related to each other or the remaining parameters. Correlations of biomarkers in group B displayed positive significant relations of aHIF with platelets (r = 0.420, p = 0.007), total bilirubin (r = 0.395, p = 0.012), INR (r = 0.673, p < 0.001), Child score (r = 0.336, p = 0.034) and a negative relation to maximum tumor size (r = –0.367, p = 0.02) while hPVT1 was negatively related to platelets (r = –0.363, p = 0.021), and positively related to total bilirubin (r = 0.336, p = 0.034) and maximum tumor size (r = 0.316, p = 0.047) (Table 4).
Table 3
Correlation between markers (ANRIL, aHIF, hPVT1 and AFP) with different parameters in group A (patients with HCC on top of chronic HCV infection) (n = 45)
Table 4
Correlation between markers with different parameters in group B (patients with HCC on top of chronic HBV infection) (n = 40)
The ROC curve was indicative for ANRIL, aHIF, hPVT1 and AFP to discriminate group A (HCC on top of chronic HCV infection) patients from positive HCV RNA in cirrhotic patients of group C, where circulating aHIF could be the greatest diagnostic biomarker, whereas AUC 0.895 at cutoff ≤ 9.9 had the uppermost sensitivity 86.67% and specificity 91.89% followed by hPVT1 at AUC 0.881 and cutoff > 22.42 had sensitivity 77.78% and specificity 78.38%, then AFP had AUC 0.709 at cutoff > 21 had sensitivity 71.11% and specificity 70.27%, and finally ANRIL had AUC 0.720 at cutoff > 11.01 and had the lowest sensitivity (60.0%) and specificity (67.57%) (Table 5, Fig. 3A). Moreover, combination of AFP with each lncRNA biomarker of (ANRIL, aHIF and hPVT1) revealed a rise of both sensitivity (91.11%) and specificity (83.78%) of aHIF with AUC 0.930 and also hPVT1 had sensitivity 95.56% and specificity 70.27% with AUC 0.903 and for ANRIL sensitivity was 77.78% and specificity 72.97% at AUC 0.787 (Fig. 3C); these results could indicate that combinations of aHIF and AFP could be better used for diagnosis of HCC on top of HCV owing to improvement of both sensitivity and specificity by combination.
Table 5
Agreement (sensitivity, specificity) for ANRIL, aHIF, hPVT1 and AFP to diagnose group A (patients with HCC on top of chronic HCV infection) (n = 45) from positive HCV RNA in group C (patients with liver cirrhosis) (n = 37)
Fig. 3
A) ROC curve for ANRIL, aHIF, hPVT1 and AFP to diagnose patients with HCC on top of chronic HCV infection from patients with liver cirrhosis, B) ROC curve for ANRIL, aHIF, hPVT1 and AFP to diagnose patients with HCC on top of chronic HBV infection from patients with liver cirrhosis, C) ROC curve for combination for AFP with each biomarker of ANRIL, aHIF and hPVT1 to diagnose patients with HCC on top of chronic HCV from patients with liver cirrhosis, D) ROC curve for combination for AFP with each biomarker of ANRIL, aHIF and hPVT1 to diagnose patients with HCC on top of chronic HBV infection (n = 40) from patients with liver cirrhosis
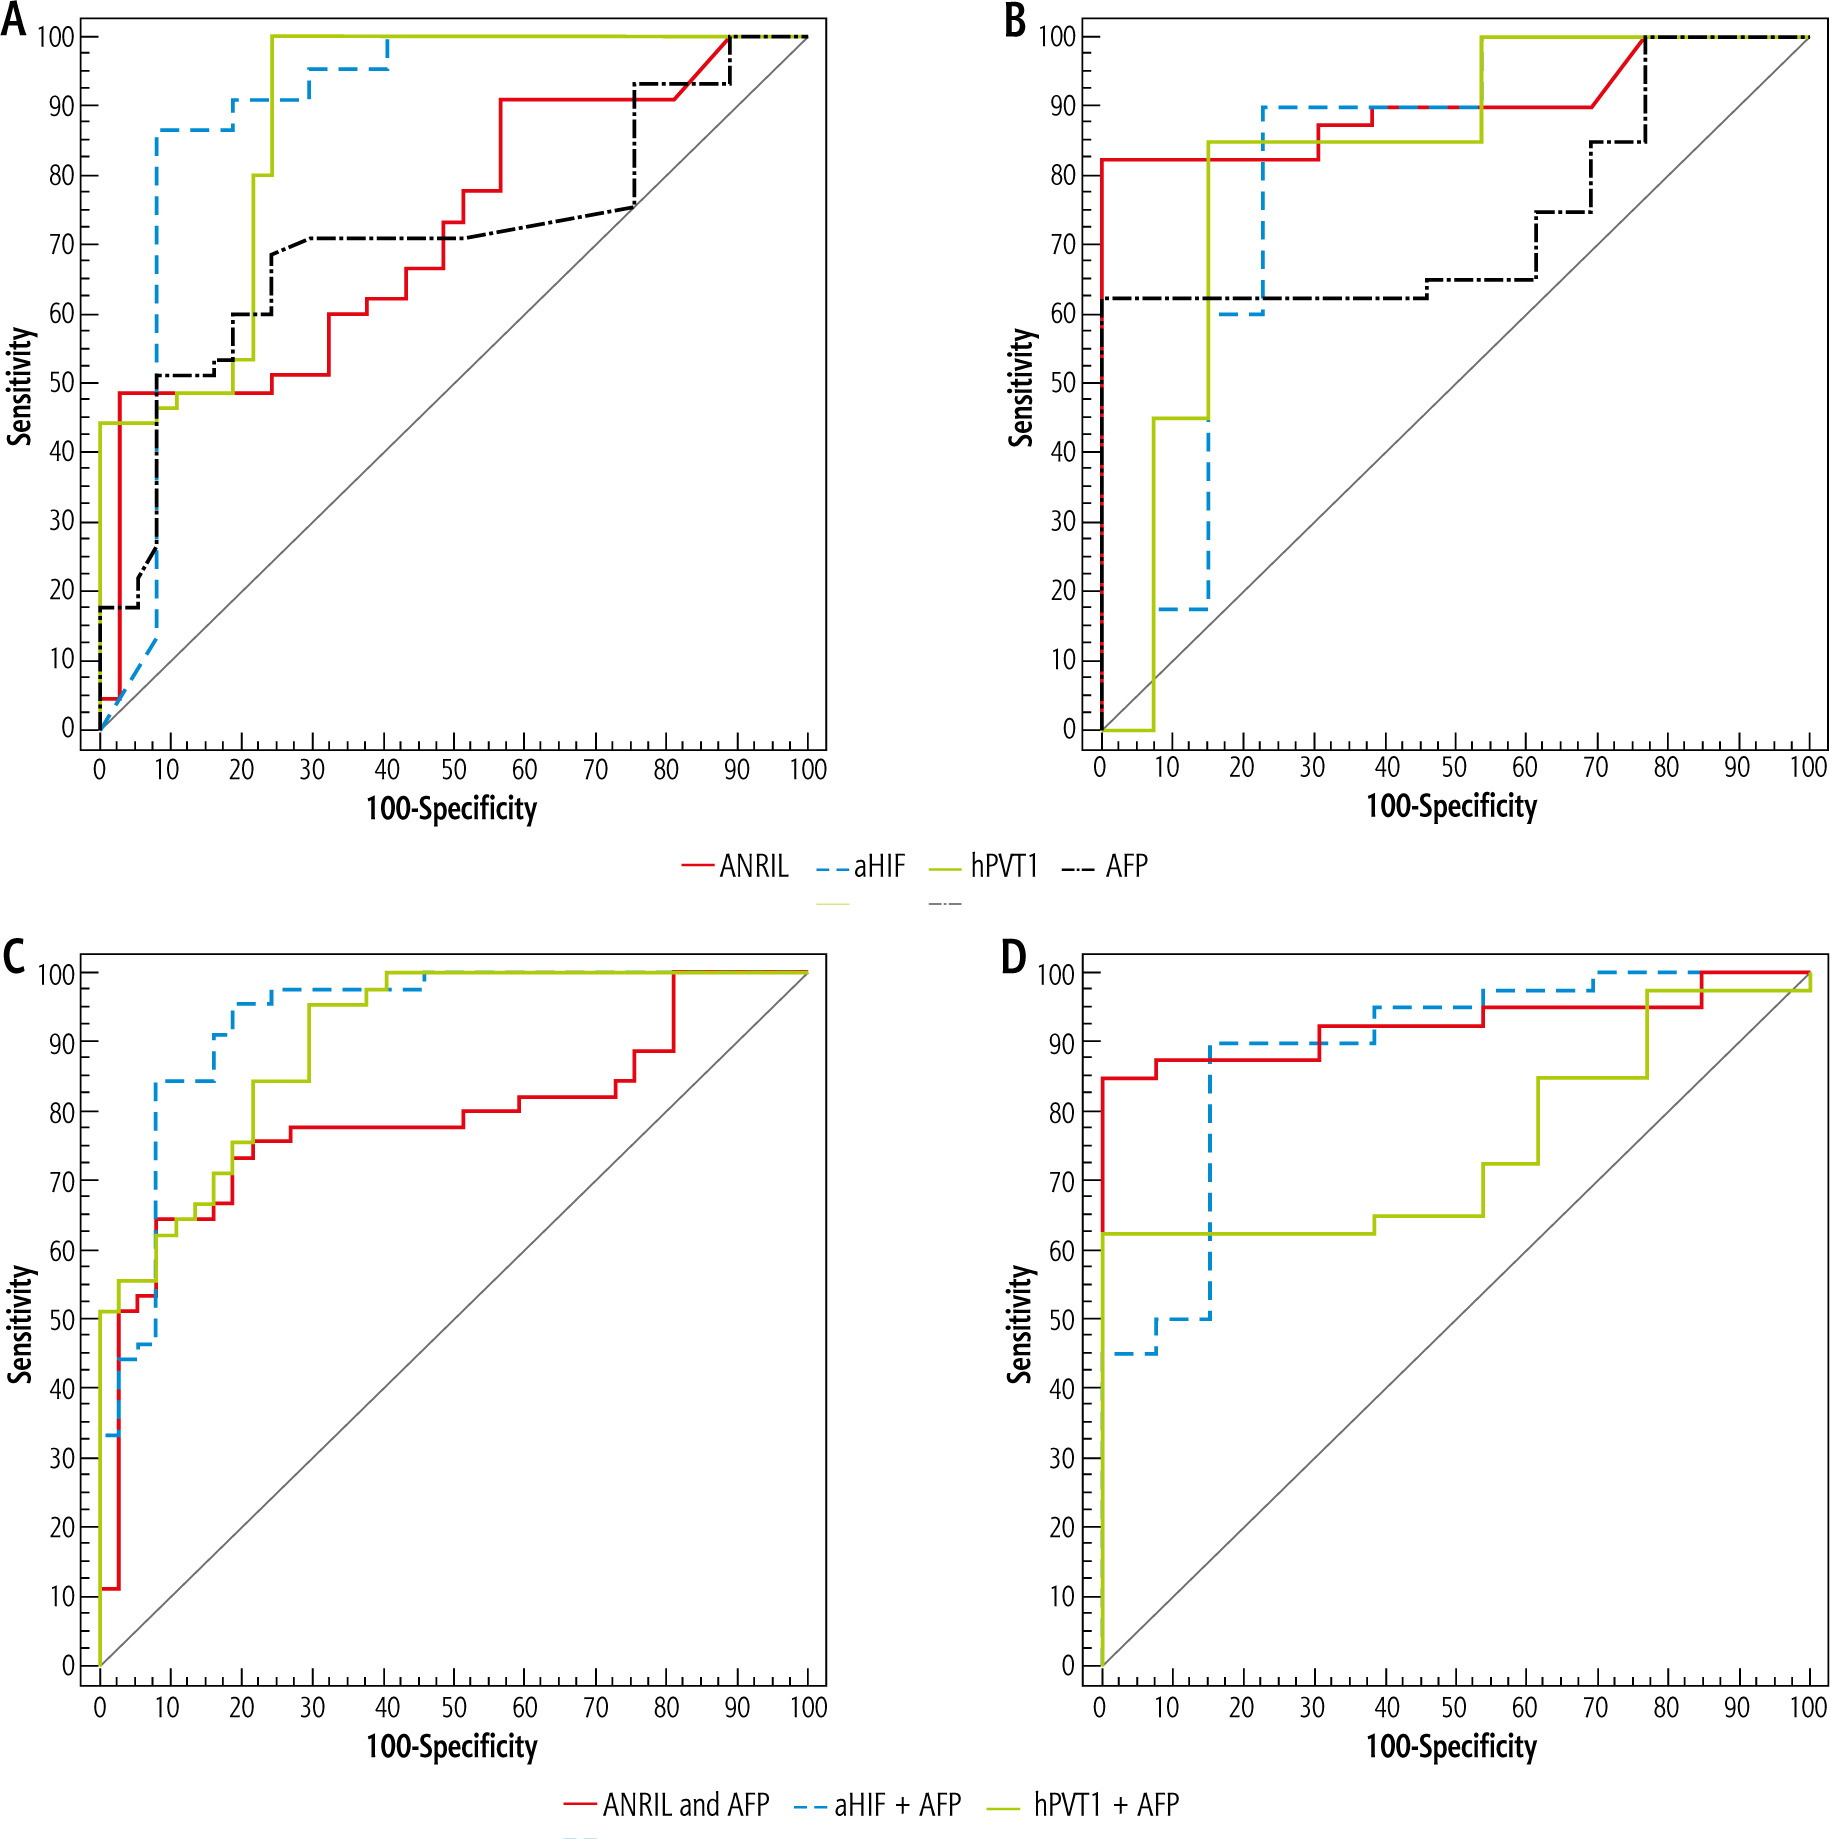
Whereas the ROC curve for ANRIL, aHIF, hPVT1 and AFP to distinguish group B (HCC on top of HBV) patients from positive HBV RNA in cirrhotic patients of group C, where circulating hPVT1 could be the supreme diagnostic biomarker, whereas AUC was 0.823 at cutoff > 7.5, it had sensitivity 85.0% and specificity 84.62%, in addition, ANRIL had AUC 0.902 at cutoff > 11.97 with sensitivity 82.5% and specificity 92.31%, followed by aHIF with AUC 0.798 at cutoff ≤ 5.1 having sensitivity 80.0% and specificity 76.92% and finally AFP AUC was 0.742 at cutoff > 60 and had sensitivity 62.5% and specificity 53.85% (Table 6, Fig. 3B). Furthermore, combination for AFP with each lncRNA biomarker (ANRIL, aHIF and hPVT1) displayed increase of aHIF and ANRIL sensitivity to reach 90% and 85% respectively and increase of specificity to reach 84.62% and 92.31% respectively, with AUC 0.885 and 0.972 respectively; however, combination of hPVT1 and AFP had a conflicting diminishment of both sensitivity and specificity of hPVT1 65% and 61.54% respectively and AUC 0.752, which may indicate that hPVT1 could be individually used as the best diagnostic biomarker for HCC on top of HBV without the need for concomitant measurement of AFP (Fig. 3D).
Table 6
Agreement (sensitivity, specificity) for ANRIL, aHIF, hPVT1 and AFP to diagnose group B (patients with HCC on top of chronic HBV infection) (n = 40) from positive HBV DNA in group C (patients with liver cirrhosis) (n = 13)
Table 7 displays univariate and multivariate logistic regression analysis for the factors distinguishing patients with HCC on top of chronic HCV infection vs. patients with liver cirrhosis related to HCV RNA; we discriminated in univariate analysis that jaundice p = 0.038, OR = 2.604 (1.053-6.439), hepatic encephalopathy p = 0.04, OR = 4.121 (1.065-15.941), Child score p = 0.031, OR = 0.818 (0.681-0.981), ANRIL p < 0.001, OR = 3.499 (1.751-6.992), aHIF p = 0.001, OR = 0.20 (0.079-0.503), hPVT1 p < 0.001, OR = 14.187 (4.230-47.577), AFP p = 0.001, OR = 5.445 (1.932-15.343), which could be noteworthy in diagnosis of HCC, while in multivariate analysis only ANRIL p = 0.021, OR = 4.183 (1.238-14.183) and hPVT1 p = 0.001, OR = 29.682 (3.862-228.135) could be independently used for distinguishing HCC on top of HCV from cirrhotic patients.
Table 7
Univariate and multivariate logistic regression analysis for the parameters affecting group A (patients with HCC on top of chronic HCV infection) (n = 45) vs. positive HCV RNA (× 105) in group C (patients with liver cirrhosis) (n = 37)
Univariate and multivariate analysis for the factors identifying HCC patients on top of HBV vs. patients with liver cirrhosis related to HBV revealed that with the univariate test, ANRIL p = 0.001, OR = 15.70 (3.163-77.945), aHIF p = 0.03, OR = 0.263 (0.079-0.877), hPVT1 p = 0.003, OR = 4.527 (1.662-12.335) and AFP p = 0.016, OR = 4.429 (1.314-14.924) could be meaningful in disease prediction, whereas in multivariate analysis ANRIL p = 0.031, OR = 12.307 (1.263-119.883), aHIF p = 0.049, OR = 0.246 (0.061-0.996), hPVT1 p = 0.047, OR = 3.617 (1.02-12.828) could be independent predictors of HCC on top of HBV infection (Table 8).
Table 8
Univariate and multivariate logistic regression analysis for the parameters affecting group B (patients with HCC on top of chronic HBV infection) (n = 40) vs. negative HCV RNA (× 105) in group C (patients with liver cirrhosis) (n = 13)
Discussion
Hepatocellular carcinoma is deemed to be the most common primary liver malignancy and globally represents a principal cause of cancer-linked mortality [16].
As most HCC patients are diagnosed late with underlying liver dysfunction, the mortality rate of such patients is analogous to the incidence rate. In addition, HCC is still one of the cancers with a worse prognosis; consequently to ameliorate survival in these patients, early detection of HCC is quite important. For patients at risk for HCC progression, the use of reliable biological markers can help in reduction of medical costs as well as lowering HCC mortality [17].
α-fetoprotein has been the habitually utilized biomarker for HCC diagnosis, but its clinical value is challenged because of its low specificity and sensitivity [18, 19]. In addition, AFP levels remain normal in 15-30% of advanced stage HCC patients, and may rise in some chronic hepatitis, liver cirrhosis, and other liver disease patients, resulting in high false negative and false-positive rates [20]. Consequently, for screening and more accurate HCC diagnosis novel markers complementing the limitations of AFP are deemed necessary. We dedicated this study to investigating three important lncRNAs that have been recently linked to liver diseases, i.e. ANRIL, aHIF and hPVT1, and we strikingly displayed noteworthy outcomes counting upregulation of ANRIL and hPVT1 and downregulation of aHIF in patients with HCC on top of HCV and HBV compared with healthy participants. Moreover, cirrhotic patients had higher ANRIL levels than healthy participants although aHIF and hPVT1 levels did not differ between them.
These results were in accordance with previous literature, where lncRNA ANRIL might act as a prospective curative goal as its expression is augmented in HCC tissues and intensely interrelated with progressive clinical features, and the diminishing ANRIL expression might repress HCC cell expansion, relocation and infiltration [21]. An additional report suggested that ANRIL overexpression might be a key issue for HCC progression, over quieting of Kruppel-like factor 2 (KLF2) by binding with PRC2 [22].
Zhang et al. [23] reported that ANRIL levels were elevated both in cirrhosis vs. normal liver and in HCC vs. cirrhosis, signifying its contribution during hepatocarcinogenesis from normal liver over the precancerous stage of cirrhosis. It is observed that ANRIL acts in HCC progression through p15/CDKN2A in cis and in trans through heterochromatin establishment or DNA methylation, since the p15 promoter is often methylated in tumor tissues from HCC patients [24].
A previous report on circulating lncRNA in HCC stated that hPVT1 and uc002mbe.2 were upregulated and together served as a precise diagnostic biomarker [25]. Human hPVT1 is enhanced in HCC tissues and is allied with poor prospects, augmented cellular spread and migration that is attained by attaching and stabilizing a cell cycle gene (NOP2), through switch of transforming growth factor β1 (TGF-β1) [26]. The hPVT1 oncogene boosts tumor evolution and passage through operating as an endogenous sponge for miR-186-5p, eliminating its inhibitory action on YAP1, reestablishing its upregulation in HCC and thus triggering tumorigenesis [27].
Guo et al. [28] confirmed that hPVT1 was elevated in HCC, and inhibition of hPVT1 repressed cell expansion and stimulated apoptosis. They in addition added that PVT1 might increase EZH2 protein stability. For the meantime, hPVT1 boosted EZH2 and MDM2 protein expression along with hindering P53 expression in HCC cells.
aHIF (lncRNA antisense to HIF1A) has been deregulated in numerous cancer types, including HCC [29]. aHIF is depressed in HCC and an original explanation was that HOTAIR might repress HIF1A expression by competitively sponging miR-130a-3p in HCC cells. Moreover, knockdown of HOTAIR could diminish HCC cell viability under hypoxia by controlling miR-130a-3p and HIF1A, signifying that the network of HOTAIR/miR-130a-3p/HIF1A could provoke HCC evolution [30].
Operative tools of lncRNAs in HCC comprise DNA binding, RNA interaction, protein connections, and creating small peptides. Initially, joining to DNA permits lncRNAs to alter chromatin structure and epigenetic variations, thus adjusting the target genes’ expression. Then, lncRNAs cooperate with mRNAs or miRNAs as a molecular sponge, thus moderating the mRNAs’ stability and translation. In addition, lncRNAs can efficiently connect with proteins to adjust their conformation, localization or stability. Also, a part of lncRNAs hold small open reading frames (sORFs) that code peptides with biological tasks [31].
We observed remarkable associations between aHIF and platelets, maximum tumor size in HCC on top of HCV and association of aHIF with platelets, total bilirubin, INR, Child score and maximum tumor size while hPVT1 was related to platelets, total bilirubin, and maximum tumor size in HCC on top of HBV.
Yu et al. [25] stated that a major association was noted between hPVT1 and tumor size, Barcelona-Clínic Liver Cancer Classification (BCLC) stage, and the serum bilirubin level. Furthermore, Wang et al. [26] conducted Kaplan-Meier analysis of 89 HCC patients and identified that elevated hPVT1 levels in HCC tissues were appreciably related to evidently lower recurrence free survival (RFS) and overall survival (OS) in HCC patients and that high hPVT1 levels were linked to larger tumor size, HBV infection, and tumor staging but not metastasis phenotype.
Our results indicate that circulating aHIF could be the greatest diagnostic biomarker for differentiating HCC on top of HCV from cirrhotic patients and furthermore aHIF and AFP combination enhances diagnosis accuracy whereas circulating hPVT1 could be the top diagnostic biomarker for discriminating HCC on top of HBV from cirrhotic patients due to having the highest sensitivity and specificity, and this might explain why lncRNAs behave differently in HCC depending on viral etiology.
Zhang et al. [23] supports this conclusion that aHIF was predominately downregulated in HCV-related HCC and that hPVT1 was notably increased only in HBV-related HCC, not in HCV- and HDV-related HCC.
Yu et al. [25] reported that PVT1 and uc002mbe.2 had a predictive ability superior to AFP with AUC 0.764, sensitivity 60.56% and specificity 90.62%. A preceding study also stated that hPVT1 was increased via the TGF-β route, which can be triggered by HBV infection in HBV-linked HCC tissues [32].
HIF-1 works as an antiapoptotic factor. In the study by Xia and coworkers, it was elucidated that Forkhead box M1 (FoxM1) performs as a proliferation-specific transcription factor in HCC cell progression and HIF-1 straightforwardly binds to the FoxM1 promoter induced by tumor necrosis factor α (TNF-α), which suggests that the TNF-α/HIF-1 prompted increase of FoxM1 levels that stimulated the spread of hepatoma cells and their resistance to apoptosis [33].
An ongoing study discovered that ANRIL expression was predominately elevated in HCC tissues competed with the healthy adjacent tissues and experimentally indicated that ANRIL overexpression provoked mitochondrial function in HCC cells, evident by the augmenting mitochondrial DNA copy numbers, ATP level, mitochondrial membrane potential, and the levels of mitochondrial markers, whereas ANRIL knockdown had opposite effects [34].
Recently, Jiang and his coworkers detected that lncRNA hPVT1 was upregulated and stimulated HBV liver cancer progression by disturbing histone methylation on the MYC promoter, proposing that hPVT1 may be a possible target for mounting diagnostic and curative plans of HBV liver cancer at the initial stages [35].
Conclusions
Molecular signatures using lncRNA expression have been displayed as a prospective predictive biomarker of HCC. In association with AFP (the currently classic HCC biomarker), the differential expression of lncRNAs (ANRIL, aHIF and hPVT1) can be used in advance to improve the accuracy of early diagnosis of HCC and could provide early therapeutic tools in HCC management and so better prognosis.
Consent to participate: Written informed consent was obtained from all participants.


