


Introduction
Obesity is defined as a high level of fat caused by an imbalance between energy intake and consumption to a level where it harms health [1]. Obesity is a problem of energy metabolism that is becoming more common in both developed and developing nations. Obesity has become one of the leading causes of disability and death, affecting not only adults but also children and adolescents worldwide [2]. The World Health Organization (WHO) study states that obesity is becoming more commonplace each year. According to the WHO data, it is reported that adult obesity has more than doubled worldwide since 1990, and obesity in adolescence has quadrupled. It is emphasized that in 2022, 43% of adults aged 18 and over will be overweight and 16% will live with obesity [3]. Like in other nations across the world, the prevalence of obesity is rising daily in our own country. According to the results of the Türkiye Health Survey (2022), when calculated according to body mass index, 20.2% of people aged 15 and over were obese and 35.6% were overweight. When examined by gender, it is seen that 23.6% of women were obese and 30.9% were overweight, while 16.8% of men were obese and 40.4% were overweight [4].
Obesity causes negative metabolic changes on blood pressure, triglyceride, cholesterol, and insulin resistance. Insulin resistance is linked to the obesity-diabetes relationship. The primary factors contributing to the development of type 2 diabetes mellitus (T2DM) are insulin resistance and hyperinsulinemia. Insulin resistance and severe hyperinsulinemia combine with central obesity. Specifically, research has shown that the height of Body Mass Index (BMI) closely correlates with an increased risk of diabetes [5-9]. In research conducted by Kılıç et al., fasting blood glucose and HbA1c levels of individuals aged 18 and older with different BMI were analyzed, and it was determined that the prevalence of diabetes increased with weight gain [4]. In the study conducted by Lee et al. [9] on 126 obese and overweight children in the 7-14 age range, it is recommended that obesity is linked to decreased glucose tolerance and that the HbA1c level should be checked in addition to the oral glucose tolerance test [9].
Obesity is a pathophysiologic component of T2DM and is frequently associated with insulin resistance [10]. Hyperglycemia, or elevated blood sugar, is a symptom of diabetes mellitus (DM), a multifaceted chronic condition caused by insufficient insulin production, action, or both [11]. Although the exact mechanism is unknown, obesity may contribute to long-term, low-grade systemic and local inflammation that develops into insulin resistance-associated DM [3,6]. Furthermore, hyperinsulinemia and insulin resistance may play a role in the development of obesity [1].
Aim of the work
Several researchers suggested the connection between obesity and T2DM. However, from what we have observed, little is known about the combined effects of HbA1c level and overweight/obesity on the increased risk of insulin resistance, especially in the young Turkish population. The appearance of obesity from an early age and the regular increase in insulin resistance may explain the earlier onset of impaired glucose tolerance in children and adolescents.
The purpose of this prospective case control research was to compare insulin resistance in obese and non-obese students with regard to HbA1c.
Material and methods
Study design
The study involves two stages.
1st stage of the study
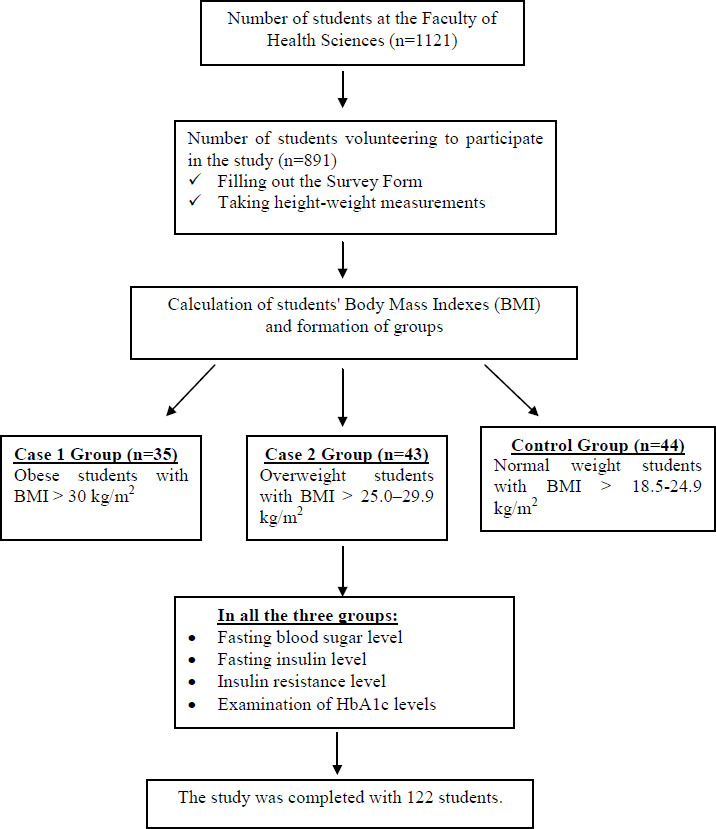
The population of the study comprised 1121 students enrolled in the Sakarya University, Faculty of Health Sciences for the 2016-2017 academic year, while the sample was made up of 891 students who willingly agreed to take part in the research.
2nd stage of the study
The G*Power (v3.1.7) tool was used for power analysis to calculate the sample size. The effect size was calculated using HbA1c mean (5.68 and 5.92) and standard deviation (0.26 and 0.42) values obtained from the publication entitled “HbA1c and glucose intolerance in obese children and adolescents” by Lee et al. [9]. In accordance with the calculation, it was shown that a minimum of 35 students needed to participate in each group. 35 obese students, 43 overweight students, and 44 normal weight students constituted the control group. All students who were obese and met the sampling criteria were included in the study. Overweight and normal weight students were selected by a simple random sampling method. The following individuals were excluded from the study: those who did not consent to participate, those with systemic infections or genetic and chronic disorders, as well as anyone taking medication (metformin, corticosteroid, etc.) that may alter the test findings.
Instruments
Height and weight measurements were performed with the DESIS M301 brand stadiometer. The device was installed and calibrated before using. Weight measurement was taken with a digital scale sensitive to 100 grams. Care was taken to ensure that the individual wore as little clothing as possible and no shoes. During the measurement, individuals could not receive any support and had to step on the scale evenly. BMI were calculated by Weight (kg) / Height2 (m) formula. According to BMI values, 18.5-24.9 was normal weight, 25.0-29.9 was pre-obesity, 30.0-39.9 was obesity and above 40 was considered morbid obesity [3].
Biochemical analyses
Blood samples were obtained by two researchers (ST and SYÇ) from the students in the case and control groups for HgA1c, fasting blood glucose and insulin levels. Peripheral venous blood samples were collected after a 12-hour fasting period. In the study, HgA1c and fasting blood glucose tests were measured with the Architect® ci4100 Analyzer (Abbott Diagnostics Ltd.). Serum insulin was measured with a Roche Cobas E601 Immunology Analyzer. Blood collection, anthropometric and biochemical measurements were documented with ISO 9001 and CE standards. Blood samples were transferred to the hospital where the samples were tested. Venous blood samples were collected in EDTA tubes and stored in the refrigerator (+4 °C) until sent to the laboratory. The insulin resistance was calculated (Fasting Glucose (mg/dl)/Fasting Insulin (MIU/ml) /405) using the Homeostasis Model Assessment-Insulin Resistance (HOMA-IR) index. If HOMA-IR value was above 3.16, it was evaluated as insulin resistance [7,8,12]. Those with HbA1c ≥ 6.5% were considered DM, and those with HbA1c values of between 5.7 and 6.4 were considered to have a prediabetes risk [13].
Statistical analysis
Statistical analyses were performed using the SPSS 25.0 software. Frequency (f) and percentage (%) of descriptive statistics were used as the statistical methods in the study. An independent group t-test and one- way ANOVA test was used for those with normal distribution, and Kruskal Wallis-H test was used because the distribution was non-standard. Bonferroni correction was used to adjust the significance level of multiple comparisons to control the type I error rate. A Chi square test was used to determine the difference between the expected frequencies. The Spearman correlation analysis was used to investigate the relationship between the values. In addition, p<0.05 was taken as the significance level.
Results
A total of 122 young adults consisting of 35 obese, 43 overweight and 44 normal weight individuals according to BMI values were included in the study (Figure 1). The mean BMI value was 33.08±2.57 in the obese group, 26.70±1.25 in the overweight group and 21.94±1.68 in the normal weight group. The ratios of normal weight, overweight and obese females were respectively 77.3%, 65.1%, and 91.4%.
Among the students who participated in the research, the average age of those with normal weight was 20.43±0.9. The mean age was 20.39±0.97 for the overweight group, and 20.05±1.05 for the obese, and there was no statistically significant difference between the groups (p=0.176). It was determined that 77.3% of the participants in the normal weight group were female, 84.1% were middle income, 36.4% lived with their friends, 75% did not smoke, and 77.3% preferred public transportation. It was determined that 65.1% of the overweight participants were women, 79.1% were middle income, 30.2% lived with friends, 86.0% did not smoke, and 67.4% preferred public transportation. Of those in the obese group, 91.4% were women, 88.6% were middle income, 31.4% lived with family members, 82.9% did not smoke, and 57.1% preferred public transportation. It was determined that they preferred public transportation. While there was no significant difference between the groups in terms of age, working status, place of residence, smoking/alcohol use, and regular exercise status, a significant difference was performed with the mode of transportation (p=0.028) (Table 1).
Table 1
Comparison of demographic characteristics of adolescents according to BMI
HOMA-IR value was higher in obese young adults (3.27±2.12) compared to normal weight (2.21±2.85) and overweight (3.10±3.84) young adults. In normal weight, overweight and obese students, HOMA-IR >3.16 was 11.4%, 27.9% and 34.3%, respectively (Table 2). Insulin resistance was higher in the obese group and there was a significant statistical difference between them (p<0.001). There was no statistically significant difference between glucose (p=0.355) and insulin (p=0.152) values of normal weight, overweight and obese students. HbA1c levels were below 5.7 in 72.7% of normal weight young adults; HbA1c levels were between 5.7 and 6.4 in 55.8% of overweight young adults, and HbA1c levels were between 5.7 and 6.4 in 65.7% of obese young adults, and there was a significant statistical difference between them (p=0.001). HbA1c was higher in the obese group (5.74±0.25) compared to the normal weight (5.47±0.33) and overweight groups (5.69±0.32), and there was a significant statistical difference between them (p<0.001) (Table 2).
Table 2
HOMA-IR, glucose, insulin and HbA1c values of normal weight, overweight and obese young adults
The glucose and insulin levels were significantly higher (p<0.001) in obese individuals with a HOMA-IR value of >3.16 compared to the obese group with a HOMA-IR value of <3.16. HbA1c and BMI did not show a statistically significant difference (p=0.558, 0.411 respectively). Also, HbA1c was significantly higher in normal weight individuals with a HOMA-IR value of >3.16 compared to the normal weight group with a HOMA-IR value of <3.16 (p=0.038). BMI, glucose and insulin values did not show a statistically significant difference (p=0.532, 0.463, 0.070 respectively) (Table 3).
Table 3
Comparison of glucose, insulin and HbA1c levels in the normal and obese weight groups according to HOMA-IR value
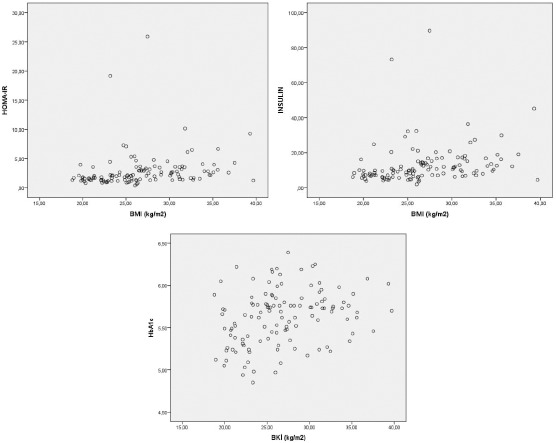
While a positive correlation was observed between BMI and insulin (r=0.429, p<0.001), HbA1c (r=0.299, p<0.001) and HOMA-IR (r=0.432, p<0.001), there was no significant relationship with glucose (r=0.107, p=0.204) (Figure 2, Table 4).
Discussion
In this study, which was carried out to compare insulin resistance in obese and non-obese students with regard to HbA1c, some sociodemographic characteristics of case and control groups (mean age, economic level, family type, place of residence etc.) were determined. There was no statistically significant difference between the groups and both groups showed a homogeneous distribution in terms of the mentioned characteristics. The fact that similar results were obtained in both groups is one of the strengths of the study. However, there was a significant difference between the groups according to gender and mode of transportation (Table 1).
According to estimates from the World Obesity Federation, 254 million children between the ages of 5-19 and 206 million in 2025 will be obese [14]. Although there is no study reflecting the country-wide in our country, the frequency of childhood obesity is between 1.6% and 7.8% in the studies [14-19]. Among 891 young adults included in the study, 4.83% of them were overweight and 3.93% of them were obese, which is consistent with the findings of the studies carried out in our country. One significant risk factor for the onset of obesity is gender. The likelihood of becoming overweight or obese is twice as high in females [14,15,18,19]. Comprehending the disparities between genders when it comes to obesity may significantly influence how the disease is treated, as well as how community and individual initiatives for the pandemic’s prevention and control are planned. In our study similar to the literature ratios of normal weight, overweight, and obese young females were higher compared to young males, and there was a statistically significant relationship between them. This significant difference may be due to the fact that there were more female students than males in the study. However, new literature is emerging on the importance of considering gender-related issues such as phases of the menstrual cycle, use of hormonal contraception, and the impact of menopause when evaluating a patient with obesity [20,21]. In future studies, it would be useful to investigate potential reasons behind this difference for the female gender, such as differences in social norms, cultural influences or biological factors. Another important difference is the relationship between students’ BMI value and mode of transportation. The number of students using public transportation is observably higher in the group with normal weight. The use of public transportation vehicles such as buses and trains actually requires students to be on the move during transportation (transfer between vehicles, walking distance, etc.). When the literature was examined, studies found that commuting to school by car was associated with obesity in students [22-24]. Wen et al. [22], in their study on the relationship between school travel patterns and obesity in children aged 10-13, reported that there was a positive relationship between driving to school every day and obesity [22]. Therefore, to prevent overweight/obesity, it may be recommended to encourage children to walk or cycle instead of traveling by car.
Chronic diseases such as DM, metabolic syndrome and hypertension caused by obesity and the prevalence of obesity are parallel. The key mechanism in the relationship between obesity and T2DM is insulin resistance. Insulin resistance causes hyperinsulinism, and when the beta cells start to secrete insulin at the expected level after a period of euglycemic state, hyperglycemia and then T2DM develop [1]. The BMI is known to have a considerable impact on the HOMA-IR score. It should be noted that as obesity becomes more common, HOMA-IR values might also vary. Obese people had higher HOMA-IR scores than teenagers who were overweight or of normal weight [25]. Teens who were normal weight, overweight, or obese had HOMA- IR rates of 11.4%, 27.9%, and 34.3%, respectively. Between these groups, there was a statistically difference, and HOMA-IR and BMI showed a positive link. According to a Japanese study, children who were overweight had significantly higher levels of fasting insulin and HOMA-IR, and there was no association found between their BMI, HbA1c, and fasting glucose [26]. The interaction between HOMA-IR and BMI before adolescence may predict the likelihood of experiencing metabolic syndrome during puberty [27]. Therefore, reducing insulin resistance in childhood may contribute to the prevention of metabolic syndrome in adolescence and adulthood. Additionally, it is predicted that both metabolic syndrome and T2DM in adulthood may result from the presence of pediatric metabolic syndrome [28]. Additionally, T2DM in adulthood can also be predicted using the HOMA-IR index for insulin resistance at early ages [27,28]. However, the variability of HOMA-IR threshold levels used to define insulin resistance greatly hinders the interpretation of the results [29].
HbA1c is associated with a 6-8-week average glucose level formed by the irreversible bond established by glucose with hemoglobin. HbA1c between the range of 5.7-6.4 is the diagnostic criterion of prediabetes risk, and HbA1c ≥ %6.5 is the diagnostic criterion of DM [13]. In this study, HbA1c was higher in the obese group compared to normal weight and overweight group. In the study carried out by Onal et al. [25] in the 3-15 age group, it was found that HbA1c in obese and normal weight children did not show a statistical significance. Upon reviewing the literature, no study has looked at the connection between HbA1c and BMI in youths older than 19.
Glucose and insulin levels were significantly higher in obese individuals with a HOMA-IR value of >3.16 compared to the obese group with a HOMA-IR value of <3.16. Glucose and insulin levels did not show any statistically significant difference in normal weight individuals with a HOMA-IR value of >3.16 compared to the normal weight group with a HOMA-IR value of <3.16. HOMA-IR, HbA1c. Insulin levels increased as the BMI increased, in other words, there was a positive correlation between them. Studies in overweight and obese –young people have found a statistically significant weak to moderate linear correlation between BMI and insulin, glucose, and HOMA-IR [19,30-32]. Research suggests that obesity is strongly linked to a higher risk of metabolic disorders such dyslipidemia, insulin resistance, and T2DM [33]. Insulin resistance is an integral feature of the metabolic syndrome and is an important determinant of the development of T2DM [34]. The main basis for obesity’s link to T2DMis its ability to trigger insulin resistance. An imbalance between energy expenditure and food intake results in an excessive build-up of adipose tissue, which is the cause of obesity. In addition to being the primary location for storing extra energy from food consumption, adipose tissue is now understood to be an endocrine organ [1]. In order to take precautions against the risk factors of metabolic syndrome, healthcare professionals should plan personalized interventions in different dimensions and according to need. Today, it is known that healthcare personnel who receive special training specific to the subject to be trained are effective in reducing the risks of diseases and reducing costs [35,36].
HbA1c levels were below 5.7 in 72.7% of normal weight students, between 5.7 and 6.4 in 55.8% of overweight students, and between 5.7 and 6.4 in 65.7% of obese students, and there was a statistically significant difference among these groups. In our study, there was no student with a HbA1c level of >6.5. However, as BMI increases, HbA1c also increases, meaning there was a positive correlation between them. These results indicate that obesity-associated insulin resistance has a major role in the development of DM. In our research, there was no statistically significant difference in HOMA-IR between those with HbA1c > 5.7-6.4 and those with HbA1c <5.7. A positive correlation was observed in the research carried out by Önal et al. [25]. We believe that the HOMA-IR cut-off point of 2.5 is connected to this outcome.
Study limitations
There are some limitations of our study that should be noted. Of the 891 students who participated in the study, 35 were obese, 43 were overweight and 813 were normal weight. In the normal weight group, 44 students were selected by simple random sampling method. The number of obese and overweight students in the group was low. HbA1c (cheap, simple and fasting is not required) can be used as a diagnostic criterion in the early diagnosis of insulin resistance. In the future, it may be recommended to conduct longitudinal studies with larger populations examining modifiable risk factors for obesity-related diseases, including interventions targeting the long-term effects of obesity on insulin resistance, and addressing its relationship with HbA1c.
Another limitation of the study is that although BMI remains a useful tool in many studies for assessing general trends in weight status and identifying individuals at high risk for certain obesity-related health conditions, other bioelectrical analytical measurements (skeletal muscle, body fat, etc.) are not used. The fact that the study was conducted in a cross-sectional design and the presence of potential confounding variables that were not taken into account also limits the study. There is a need for randomized controlled long-term studies on the subject.
Conclusions
In conclusion, increasing obesity in young people augers for metabolic syndrome in the future. Insulin resistance is one of the diagnostic criteria of metabolic syndrome. For T2DM to be diagnosed early, insulin resistance must be identified. This purpose, HbA1c can be used since it is cheap and simple (fasting is not required) to evaluate insulin resistance in obese young people. Therefore, more frequent monitoring of overweight and obese young people to protect their health will make significant contributions to public health.