
Introduction
Skin hyperpigmentation, which can be caused by ultraviolet (UV) irradiation, some medications, skin inflammation, or hormonal changes, is a significant concern, particularly for women with particular emphasis on facial involvement and therapeutic difficulty [1]. Among these factors, the impact of sun exposure as a triggering factor of tanning has been known for decades. After stimulating to UV irradiation, α-melanocyte-stimulating hormone (α-MSH) is secreted in both melanocytes and keratinocytes, which then binds melanocortin receptor 1 (MC1R) and activates the melanogenesis pathway to stimulate the generation of microphthalmia-associated transcription factor (MITF) [2, 3]. MITF has been identified as a master transcriptional regulator that orchestrates key developmental and differentiation programs in the melanocyte lineage. Activation of MITF will upregulate three primary pigmentation enzymes required for melanin synthesis: tyrosinase, tyrosinase-related protein (TRP)1, and TRP2 [3, 4]. The three primary pigmentation enzymes determine skin pigmentation, resulting in melanin production and skin pigmentation. Therefore, inhibition of α-MSH-MC1R pathway could prevent melanogenesis in the latter following UV exposure.
In the field of cosmetics, there are several common whitening agents, such as kojic acid and arbutin. But it has been reported that kojic acid can induce cancer and arbutin can promote melanin synthesis when its concentration is higher [5]. Many traditional medicines derived from natural products have been used to block melanin synthesis without any damage to human skin [6–8]. Therefore, it is feasible to search for new natural products that can suppress melanin synthesis and have enormous potential. Tea polyphenols (TPS) are polyphenolic compounds extracted from green tea. The main components of TPS are catechin compounds, which have already been studied for many characteristics, such as antioxidant and anti-inflammatory activity, and effects on proliferation, differentiation, and apoptosis [9]. Although TPS has been reported to reduce melanin production, the mechanisms mediating the effects of TPS have not yet been elucidated [10, 11].
Aim
The aim of this study is to investigate the mechanism by which TPS suppresses melanogenesis by down-regulating the expression of α-MSH-MC1R signalling, resulting in decreased melanin content.
Material and methods
Material
HaCaT cells and Human epidermal melanocytes (HEM) cells were obtained from the Type Culture Collection of the Chinese Academy of Sciences, Shanghai, China. The following material was purchased from the following manufacturers: tea polyphenols (98% purity), Chinese Academy of Agricultural Sciences, Tea Research Institute; 10% foetal bovine serum (FBS), DMEM and DMSO, Gibco/BRL (Grand Island, NY, USA); Bovine serum albumin (BSA), levodopa (L-DOPA) and nonapeptide-1 acetate salt (N-1A), MedChemExpress (Shanghai, China); and α-MSH ELISA Kit, CUSABIO (Wuhan, China). Antibodies for tyrosinase, MC1R, MITF, TRP1 and TRP2 were procured from Sangon Biotech (Shanghai, China).
Cell culture
HaCaT cells were cultured in RPMI1640 cell culture medium containing 10% FBS and incubated at 37°C in a 5% CO2 incubator. Logarithmic growth phase cells were exposed to trypsin so that the density of the cells reached 60–70% after overnight incubation. HEM cells were cultivated with the same method as HaCaT cells.
Cell viability analysis
Cells were counted using a Cell Counting Kit-8 (CCK8; Beyotime Biotechnology, Shanghai, China), according to the manufacturer’s instructions. Briefly, HaCaT cells and HEM cells were placed in 96-well plates at 2000 cells/well with various concentrations of TPS (0, 5, 10, 15, 20, 25, 30, 40, and 50 μg/ml) in 200 μl of culture medium, respectively. After 24 h, the CCK8 solution was added to each, and the plates were incubated for 1 h at 37°C. Absorbance at 450 nm was determined using a microplate reader (SIGMA, Shanghai, China).
UVA irradiation and TPS treatment
After 2 days of culture, both the HEM cells and HaCaT cells were randomly divided into the following 8 groups (total 16 groups): blank control, UVA-irradiated, 5 μg/ml TPS-treated, 10 μg/ml TPS-treated, 15 μg/ml TPS-treated, UVA-irradiated and 5 μg/ml TPS-treated, UVA-irradiated and 10 μg/ml TPS-treated, UVA-irradiated and 15 μg/ml TPS-treated. Four of 8 HEM or HaCaT cell groups were exposed to UVA irradiation (15 J/cm2) for three consecutive days using a UVA lamp (Philips, Holland) according to previous methods with slight modifications [12]. UV energy was monitored with a radiometer sensor (SIGMA, Shanghai, China). Except for the blank control group, the other 7 groups of HEM cells or HaCaT cells were also treated with different concentrations of TPS (5, 10, 15 μg/ml) for 3 days.
Nonapeptide-1 acetate salt treatment
HEM cells and HaCaT cells were randomly divided into the following 8 groups (total 16 groups): blank control, 10 μg/ml TPS-treated, 20 μm N-1A-treated, 10 μg/ml TPS and 20 μm N-1A-treated, UVA-irradiated, UVA-irradiated and 10 μg/ml TPS-treated, UVA-irradiated and 20 μm N-1A-treated, UVA-irradiated and both 10 μg/ml TPS and 20 μm N-1A-treated. UVA-treated groups were exposed to UVA irradiation (15 J/cm2) for 3 consecutive days using a UVA lamp (Philips, Holland) according to previous methods with slight modifications. UV energy was monitored with a radiometer sensor. All groups were cultured for 3 days.
Melanin content determination
After UVA irradiation exposure, TPS, and N-1A treatment, the melanin content was determined using a previously reported method, with modifications. The medium was removed, and the HEM cells were washed twice with phosphate-buffered saline (PBS) and harvested by trypsinization using 0.04% trypsin. The harvested cells were centrifuged (3000r/2 min), and the pellet was dissolved by adding 1 N NaOH : DMSO 9 : 1 solution, followed by incubation at 80°C for 2 h. The amount of melanin in the solution was determined by measuring the absorbance at 470 nm using the microplate reader (SIGMA, Shanghai, China). The total melanin content was estimated using the standard curve of synthetic melanin.
Tyrosinase activity assay
Tyrosinase enzyme activity was estimated spectrophotometrically as described earlier, using L-DOPA as the substrate. After HEM cells were irradiated with a UVA lamp and TPS, cells were solubilized with 1X PBS (137 mM NaCl, 2.7 mM KCl, 8 mM Na2HPO4, 1.5 mM KH2PO4, pH 7.4). The cells were then disrupted and centrifuged at 12,000 g for 10 min. After protein quantification and adjustment, 100 μl of cell lysate (each containing the same amount of protein) was incubated in duplicate with 100 μl of 0.1% L-DOPA at 37°C for 30 min. After the inactivation of the enzymes using an ice bath, the optical absorbance was then monitored at 492 nm.
Quantification of α-MSH in HaCaT cells and HEM cells by ELISA
After HEM cells and HaCaT cells were treated with UVA and TPS after 48 h, the supernatant was collected and α-MSH protein levels in HaCaT cells or HEM cells culture medium were measured by ELISA using an α-MSH Assay Kit respectively, according to manufacturers’ instructions. The optical density value (OD value) of each well was measured sequentially using a multi-function microplate reader at a wavelength of 450 nm.
Western blot analysis
After TPS treatment and UVA exposure, both floating and adherent cells of HaCaT cells and HEM cells were harvested to make western blot analysis respectively. Cells were washed with ice-cold PBS and solubilized with ice-cold lysis buffer (50 mM Tris–HCl, 150 nM NaCl, 1 mM EGTA, 1 mM EDTA, 20 mM NaF, 100 mM Na3VO4, 0.5% NP-40, 1% Triton X-100, 1 mM PMSF, 10 μg/ml aprotinin, 10 μg/ml leupeptin) at 4°C for 30 min and then centrifuged at 12,000 ×g for 10 min at 4°C to obtain total cell lysates and stored at –80°C till further use. Cytosolic extracts were prepared and protein concentration was estimated by BCA protein assay. For western blotting, proteins (50 μg) were resolved on 10–15% SDS-polyacrylamide gels followed by electro-transfer onto the immobile PVDF membrane. The blots were blocked overnight with 5% BSA. After blocking, the membrane was washed with TBST, then the antibodies were diluted with blocking solution (1 : 1000 for tyrosinase, 1 : 1000 for MC1R, 1 : 1000 for MITF, 1 : 1000 for TRP1, and 1 : 1000 for TRP2) and added to the protein-adhered side of the membrane, which was incubated overnight at 4°C. After washing the membrane with TBS solution, secondary antibodies were diluted to a concentration of 1 : 300, and then added to one side of the protein-coated membrane and incubated at 25°C for 2 h.
Statistical analysis
GraphPad Prism 5 software was used for all statistical analyses. Results are reported as means ± standard errors of means (SEMs). The statistical analysis of the results was performed with one-way ANOVA and Tukey’s test, for comparing all pairs of columns, p < 0.05 was accepted as statistically significant.
Results
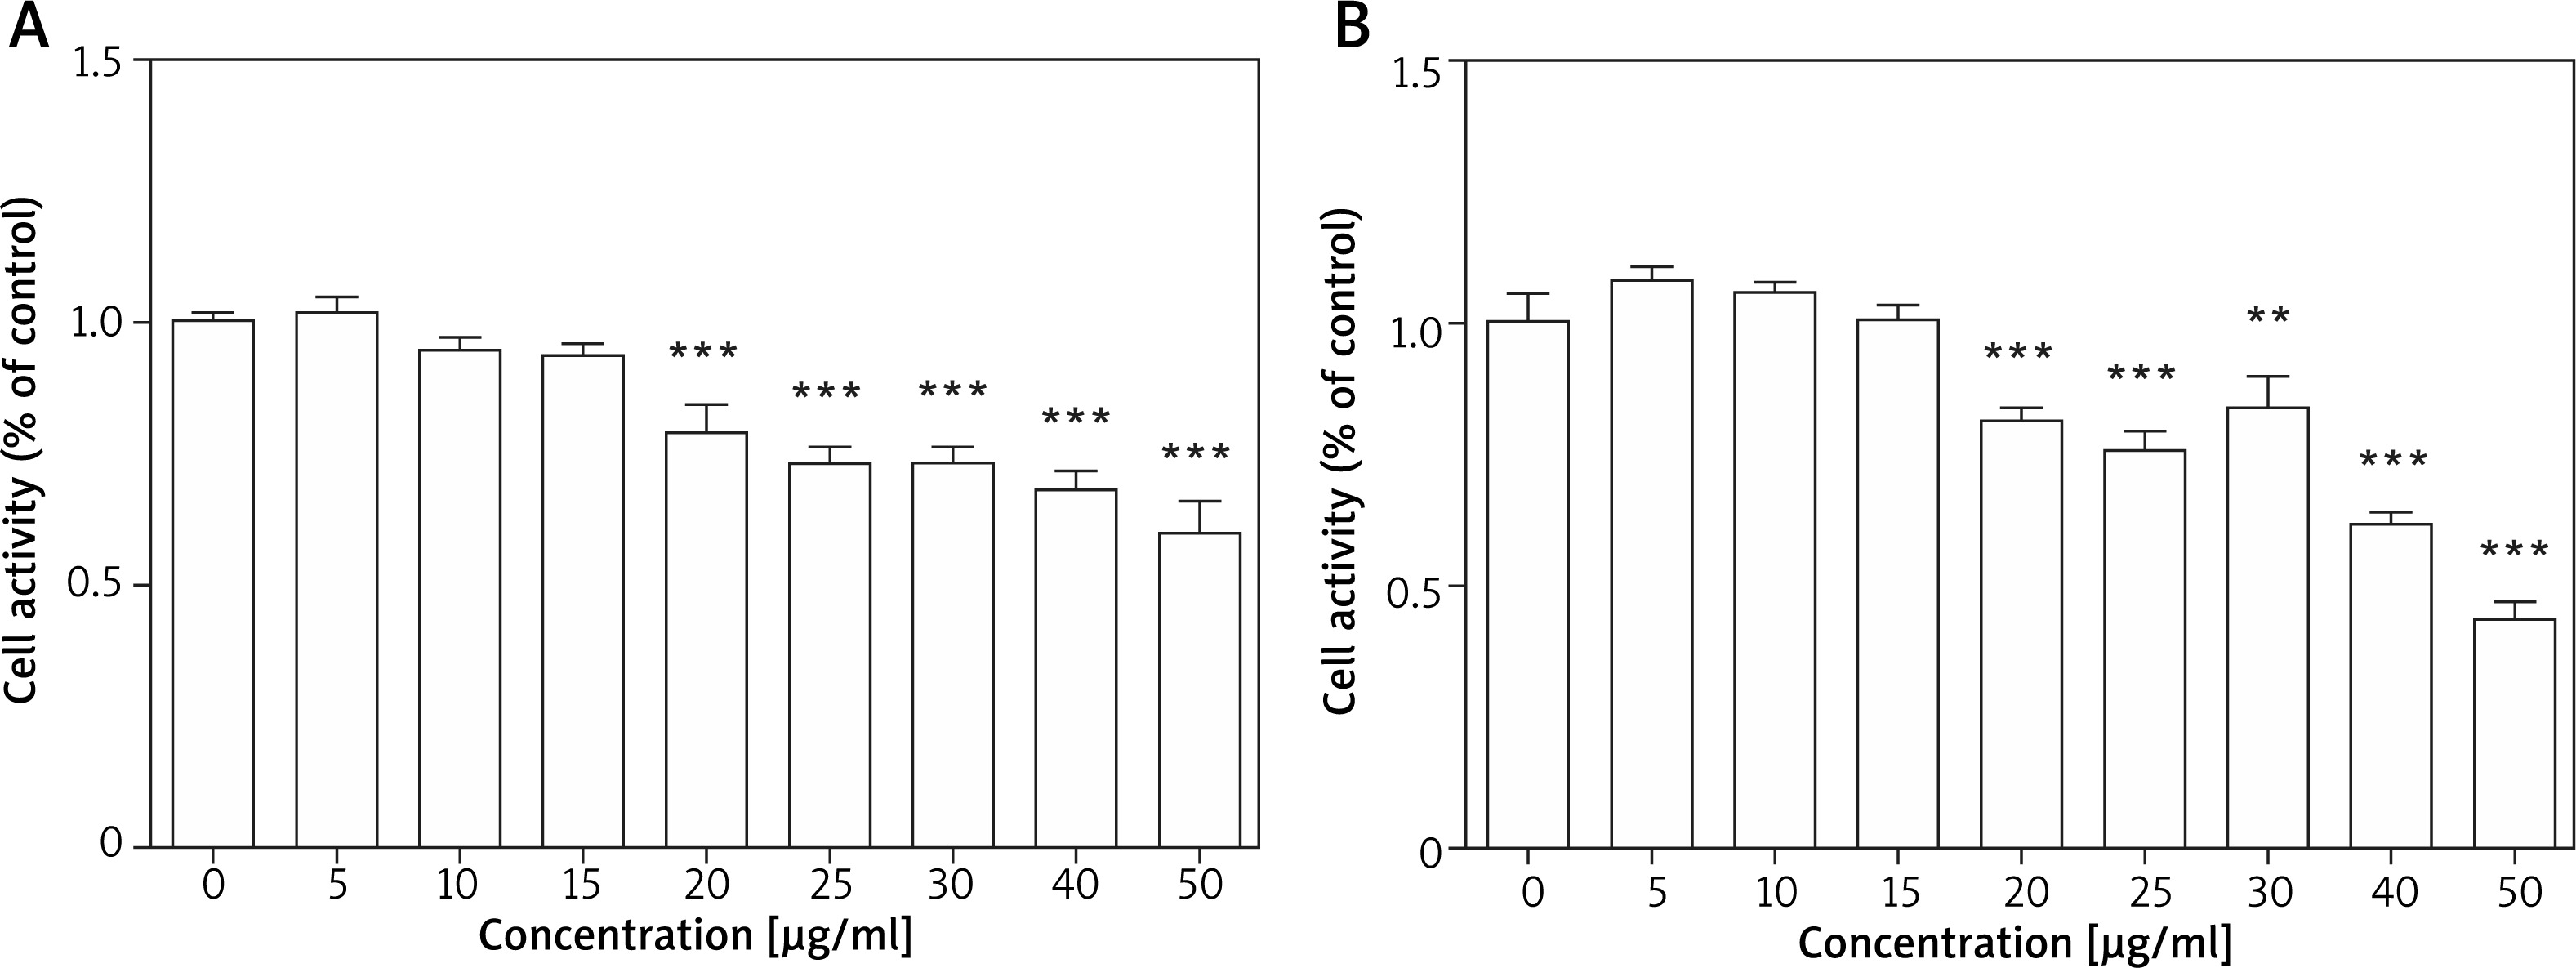
Cell proliferation activity after TPS treatment
As the first step towards determining the effects of TPS on melanogenesis, we measured the toxicity of TPS. Toxicity analysis conducted in HEM cells revealed no change in viability in TPS-treated (5, 10, and 15 μg/ml, p > 0.05) vs. untreated cells, however, cell activities were significantly inhibited at higher concentrations (20, 25, 30, 40, and 50 μg/ml, p < 0.05) (Figure 1 A). Furthermore, TPS could also inhibit the proliferation of HaCaT cells when the concentration reached 20 μg/ml even higher, while it (≤ 15 μg/ml) had no effects on the growth of HaCaT cells meaning not increasing or reducing the number of cells (Figure 1 B). Thus, the concentration of TPS less than 20 μg/ml was used in the following experiments in cells.
Figure 1
Cell proliferation activity after TPS treatment. A, B – HEM cells and HaCaT cells were treated with different concentrations of TPS (0, 5, 10, 15, 20, 25, 30, 40, and 50 μg/ml). Data from the blank control group was set to 1. Results are presented as means ± SEMs for the experiment. *P < 0.05, **p < 0.01, ***p < 0.001 versus non-treated cells
TPS inhibited melanin biosynthesis in HEM cells
To identify the anti-melanogenesis effects of the TPS, we measured the UVA-induced melanin contents after TPS treatment in HEM cells. Compared with normal cells, the UVA-irradiated HEM cells showed a 127.78 ±4.03% increase in the melanin content. Besides, melanin contents decreased significantly after treatment with different doses of TPS (5, 10, and 15 μg/ml), both in UVA exposed groups and non-treatment groups (non-UVA groups: 82.17 ±0.39%, 86.15 ±3.17% and 71.61 ±2.68%, p < 0.05, UVA groups: 67.74 ±2.27%, 87.92 ±3.09% and 104.66 ±5.08%, p < 0.05) (Figure 2 A). Also, we found that there was no clear dose-dependence of TPS on the ability to suppress melanin production, either in UVA or in non-UVA groups.
Figure 2
Inhibitory effects on melanogenesis (A) and tyrosinase activity (B) of the TPS on HEM cells. HEM cells were divided into two groups including UVA-treated (15 J/cm2) and untreated. Both groups were then incubated with the samples (0, 5, 10, and 15 μg/ml). TPS significantly reduced melanin pigments and tyrosinase activity. Data from the blank control group was set to 1. Results are presented as means ± SEMs for the experiment. *P < 0.05, **p < 0.01, ***p < 0.001 versus non-treated cells, # p < 0.05, ## p < 0.01, ### p < 0.001 versus UVA-treated cells
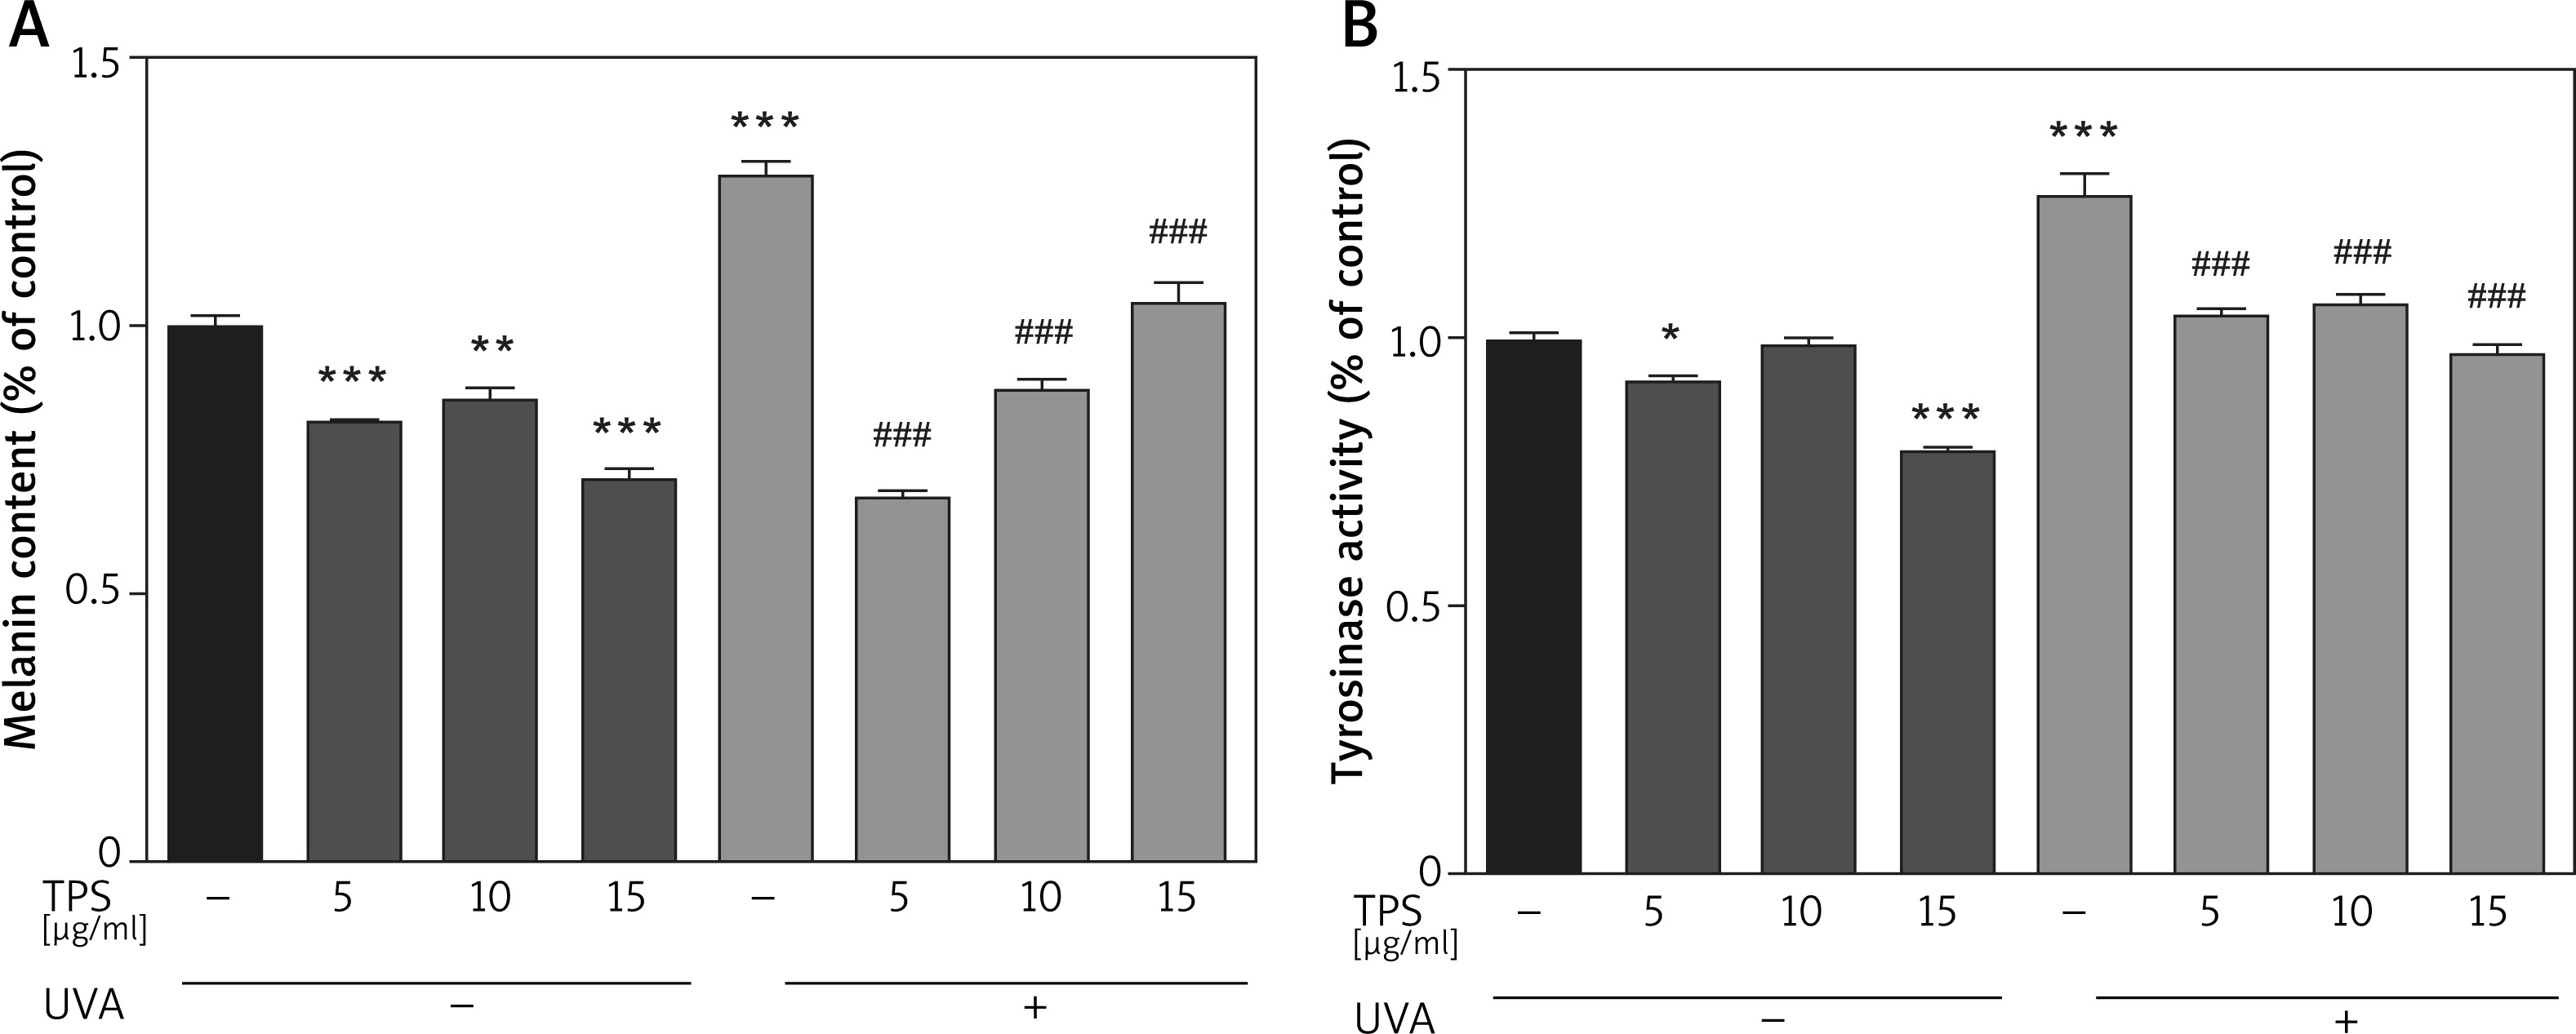
TPS inhibited tyrosinase activity in HEM cells
Compared with the blank control group, TPS treatment groups resulted in a significant decrease in the tyrosinase activities of HEM cells (Figure 2 B), which was 92.12 ±1.19%, 99.07 ±0.99%, and 78.91 ±1.17% for 5, 10, and 15 μg/ml, respectively. The levels of tyrosinase activity were 126.70 ±6.25% after UVA irradiation, and became 104.54 ±1.47%, 106.14 ±2.68% and 97.42 ±1.56% after treatment with 5, 10, and 15 μg/ml TPS, respectively. Therefore, it indicated that TPS is a potent tyrosinase inhibitor. However, the correlation between the concentration of TPS and tyrosine activity was unclear (data not shown).
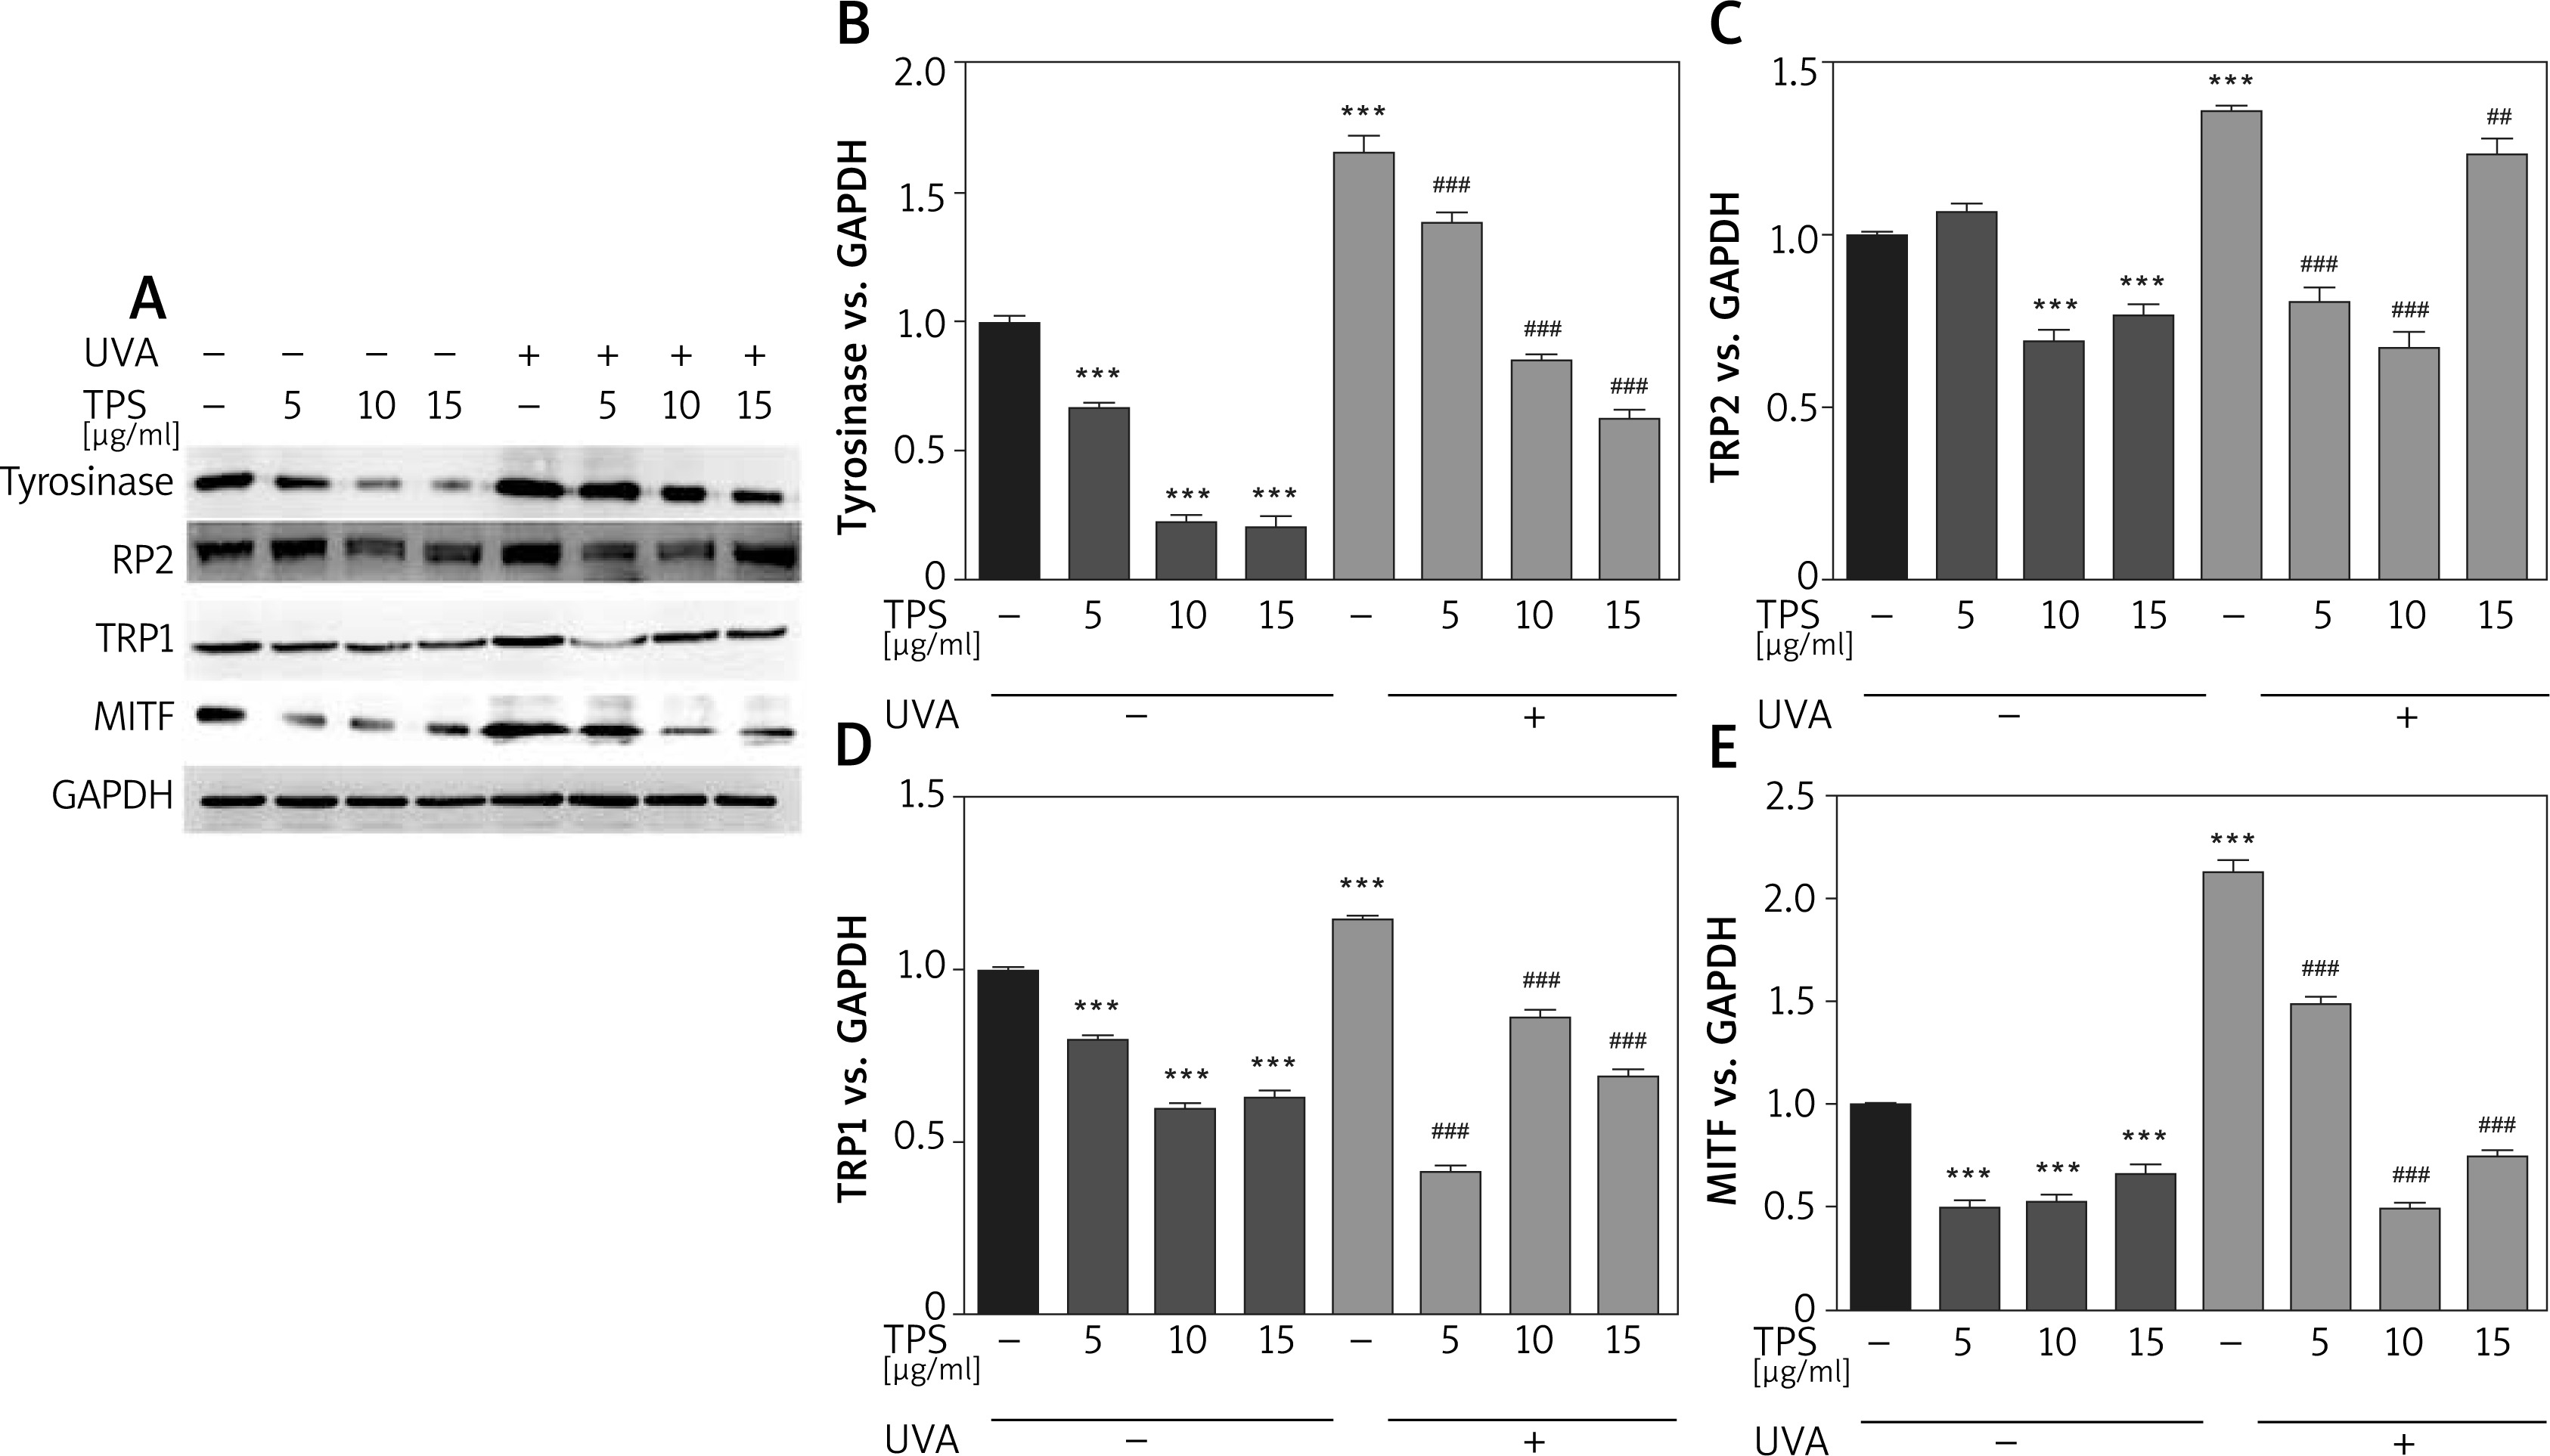
Effects of TPS on expression of melanogenesis-related proteins
To elucidate the mechanism of melanogenesis, including the expression of tyrosinase, TYRP-1, TYRP-2, and MITF, underlying the effect of TPS, HEM cells were treated with TPS (5, 10, and 15 μg/ml) for 3 days. Western blot analysis was conducted to analyse the resulting cell lysates. As indicated in Figure 3 A, compared with untreated control cells, TPS treatment at all concentrations significantly reduced tyrosinase, TYP-1, TYP-2, and MITF protein level without a dose-dependent manner. UVA irradiation induced melanogenesis-related proteins to levels greater than those seen in corresponding controls. As expected, irradiated HEM cells treated with TPS showed lower protein levels than the corresponding untreated controls (Figures 3 B–E), suggesting that the application of TPS significantly inhibited UVA-induced melanin-synthesis-related protein expression.
Figure 3
Effects of TPS on the expression of melanogenesis-related proteins. HEM cells were stimulated with 5, 10, and 15 μg/ml TPS with or without UVA treatment (15 J/cm2). A – The cell lysates were then subjected to western blot analysis with antibodies against tyrosinase, TRP2, TRP1, and MITF. Equal protein loading was confirmed using the GAPDH antibody. B–E – Mean intensity of tyrosinase, TRP2, TRP1, and MITF are shown in the graph on the right. Error bars show means ± SEMs. *P < 0.05, **p < 0.01, ***p < 0.001 versus non-treated cells, # p < 0.05, ## p < 0.01, ### p < 0.001 versus UVA-treated cells
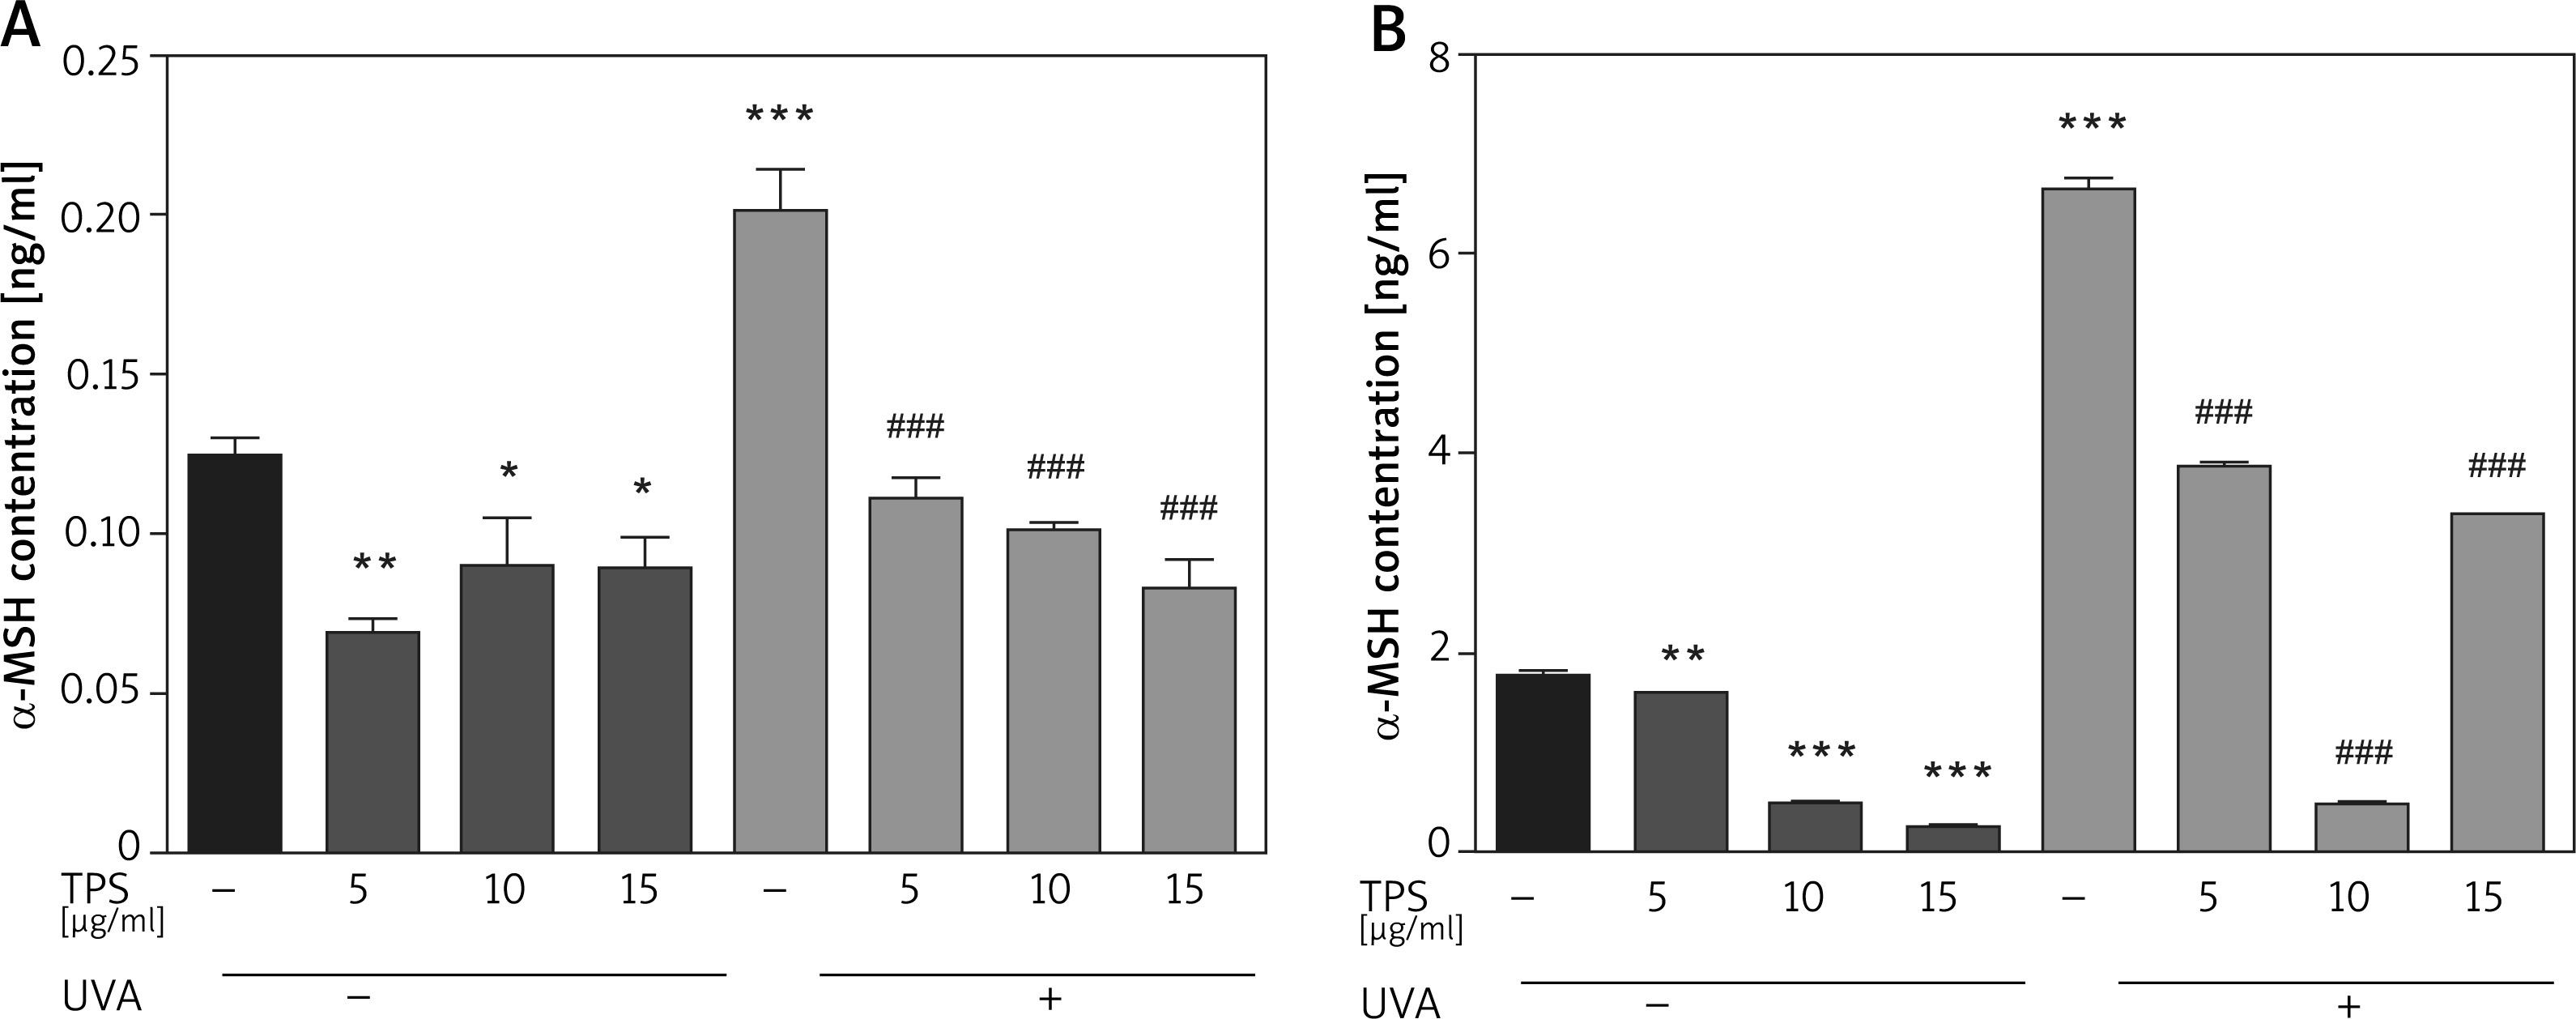
TPS treatment suppresses α-MSH expression in HaCaT cells and HEM cells
Following UVA irradiation, both HaCaT cells and HEM cells increase secretion of α-MSH, which in turn activates melanin production by melanocytes. Therefore, we also assessed the anti-melanogenic effects of the TPS on α-MSH in both HaCaT cells and HEM cells. Exposed to UVA increased α-MSH in HaCaT cells (0.12 ±0.007 ng/ml vs. 0.20 ±0.019 ng/ml, p < 0.05), based on ELISA and this effect was blocked by co-treatment with TPS (non-UVA groups: 0.07 ±0.005 ng/ml and 0.09 ±0.02 ng/ml, 0.08 ±0.013 ng/ml, p < 0.05, UVA groups: 0.11 ±0.009 ng/ml, 0.10 ±0.004 ng/ml and 0.08 ±0.011 ng/ml, p < 0.05) (Figure 4 A). As shown in Figure 4 B the expression level of α-MSH significantly increased in HEM cells after UVA radiation compared with untreated cells from 1.79 ±0.03 ng/ml to 6.66 ±0.14 ng/ml, p < 0.05. Treatment of HEM cells with different concentrations of TPS decreased α-MSH protein levels secreted in the media relative to untreated controls (non-UVA groups: 1.58 ng/ml, 0.50 ±0.02 ng/ml and 0.25 ±0.01 ng/ml, p < 0.05, UVA groups: 3.86 ±0.03 ng/ml, 0.50 ±0.03 ng/ml and 3.41 ng/ml, p < 0.05).
Figure 4
Effects of TPS on the expression of α-MSH. Representative chart trace of α-MSH inhibition by 5, 10, and 15 μg/ml of the TPS on HaCaT cells (A) and HEM cells (B) with UVA exposure (15 J/cm2) or not by ELISA. Error bars show means ± SEMs. *P < 0.05, **p < 0.01, ***p < 0.001 versus non-treated cells, # p < 0.05, ## p < 0.01, ### p < 0.001 versus UVA-treated cells
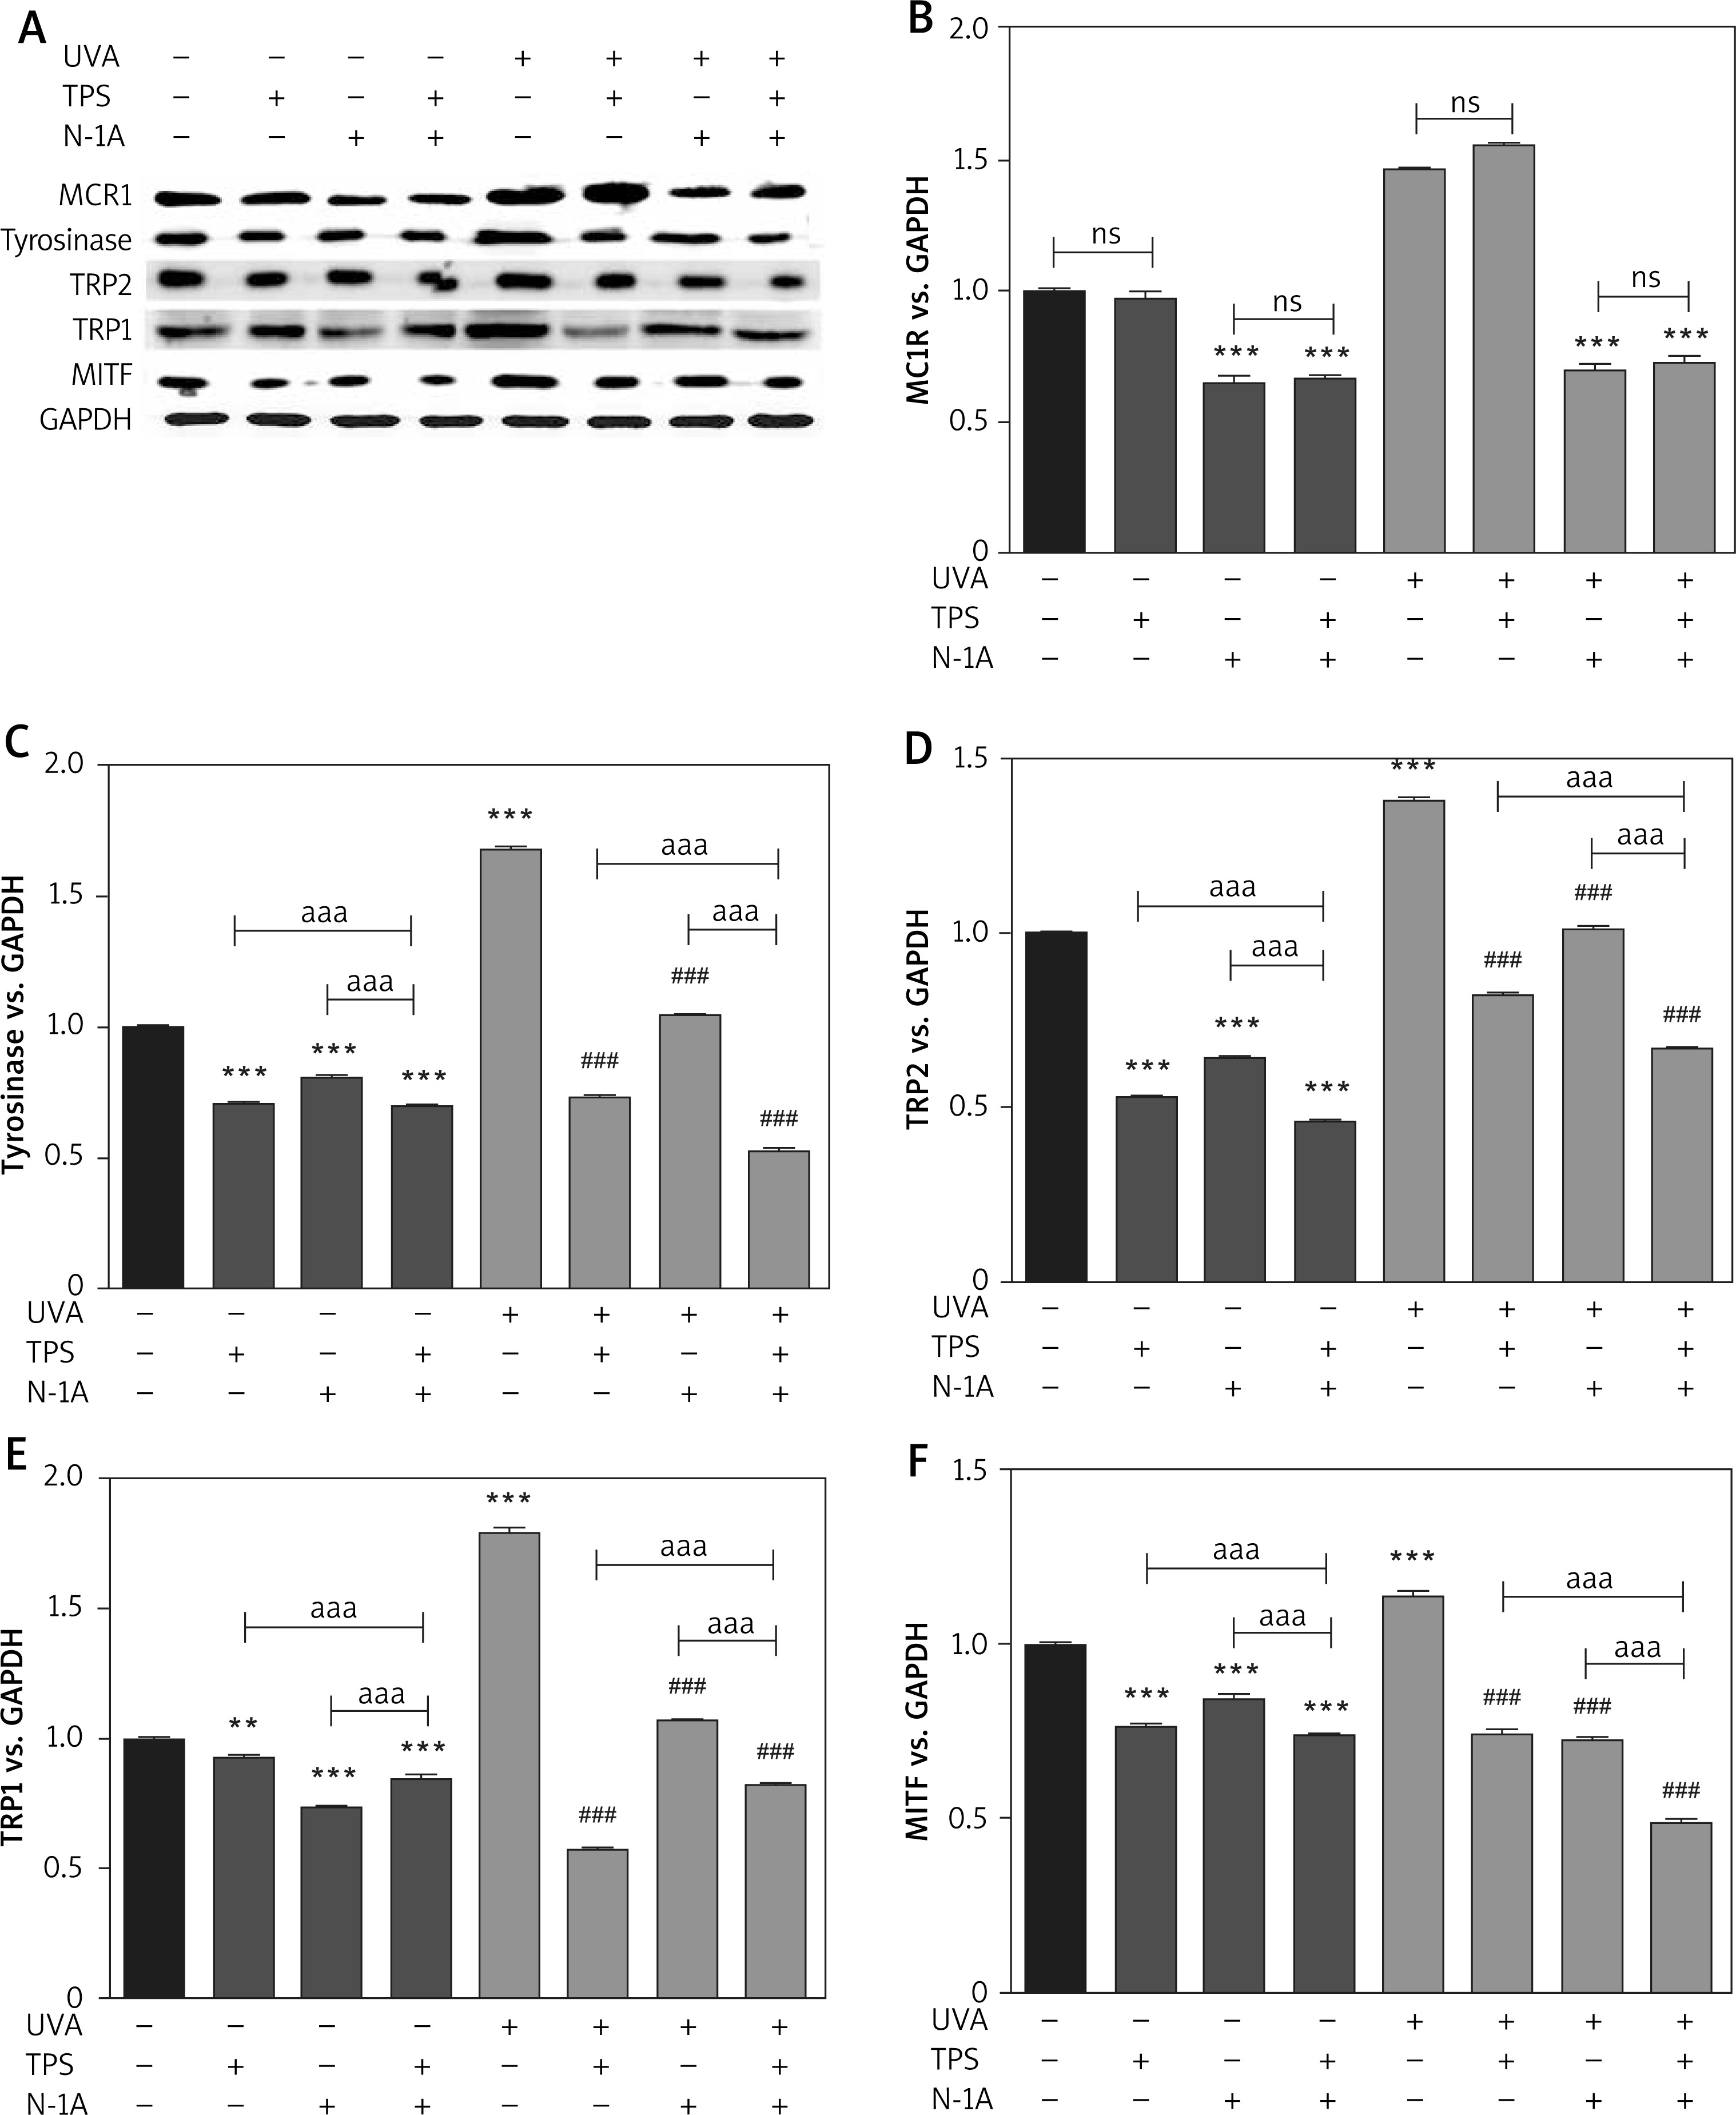
α-MSH-MC1R signalling pathway mediates the effect of TPS on melanogenesis
α-MSH and MC1R, located upstream of the melanin production pathway, activates the progress of melanogenesis. To unravel the mechanism by which TPS inhibited melanin synthesis, we measured the changes of α-MSH in HEM cells and HaCaT cells treated with TPS and N-1A (a novel peptide competes with α-MSH and binds to MC1R). In melanin content assay (Figure 5 A), treatment with both TPS and N-1A markedly inhibited the basal melanin synthesis and reversed UVA-induced melanin increase than using one of them alone. And, similar results were also obtained assaying tyrosinase activity (Figure 5 B). Moreover, we examined the tyrosinase, MC1R, TRP-1, TRP2, and MITF expression levels via Western blot analysis (Figure 6). As expected, the results revealed that TPS and N-1A could significantly decrease the expression of tyrosinase, TRP1, TRP2, and MITF with or without UVA radiation. Besides, treated cells with both TPS and N-1A significantly increases the ability to resist melanin production. Interestingly, N-1A downregulated MC1R expression, whereas no effect was observed in TPS treatment. Moreover, the expression of α-MSH was assayed in co-cultured HEM cells and HaCaT cells after TPS and N-1A treatment by ELISA. We found that irradiated HEM cells and HaCaT cells treated with N1-A showed α-MSH levels comparable to corresponding untreated controls (Figures 5 C, D), suggesting that N1-A inhibition of melanin production does not require changes in α-MSH expression. We then co-treated cells with TPS and N1-A and found that they decreased α-MSH to a level similar to that of single TPS groups without any significant difference. The results conclusively show that TPS suppresses melanin synthesis through directly downregulating the expression of α-MSH in α-MSH-MC1R signal and have not to affect MC1R expression.
Figure 5
TPS inhibited melanogenesis through suppressing the α-MSH-MC1R signalling pathway in HaCaT cells and HEM cells. A, B – HEM was pretreated or not with UVA exposure (15 J/cm2) before TPS (10 μg/ml) and N-1A (20 μm) were applied. Melanin contents and the expression of tyrosinase were measured as described in methods. C – HaCaT cells were treated with TPS (10 μg/ml) and/or N-1A (20 μm) in the presence or absence of UVA exposure (15 J/cm2). ELISA was then applied to detect the expression of α-MSH. D – HEM cells were treated with TPS (10 μg/ml) and N-1A (20 μm) in the presence or absence of UVA exposure (15 J/cm2). ELISA was then applied to detect the expression of α-MSH. *P < 0.05, **p < 0.01, ***p < 0.001 versus non-treated cells, # p < 0.05, ## p < 0.01, ### p < 0.001 versus UVA-treated cells, a p < 0.05, aa p < 0.01, aaa p < 0.001, ns p > 0.05
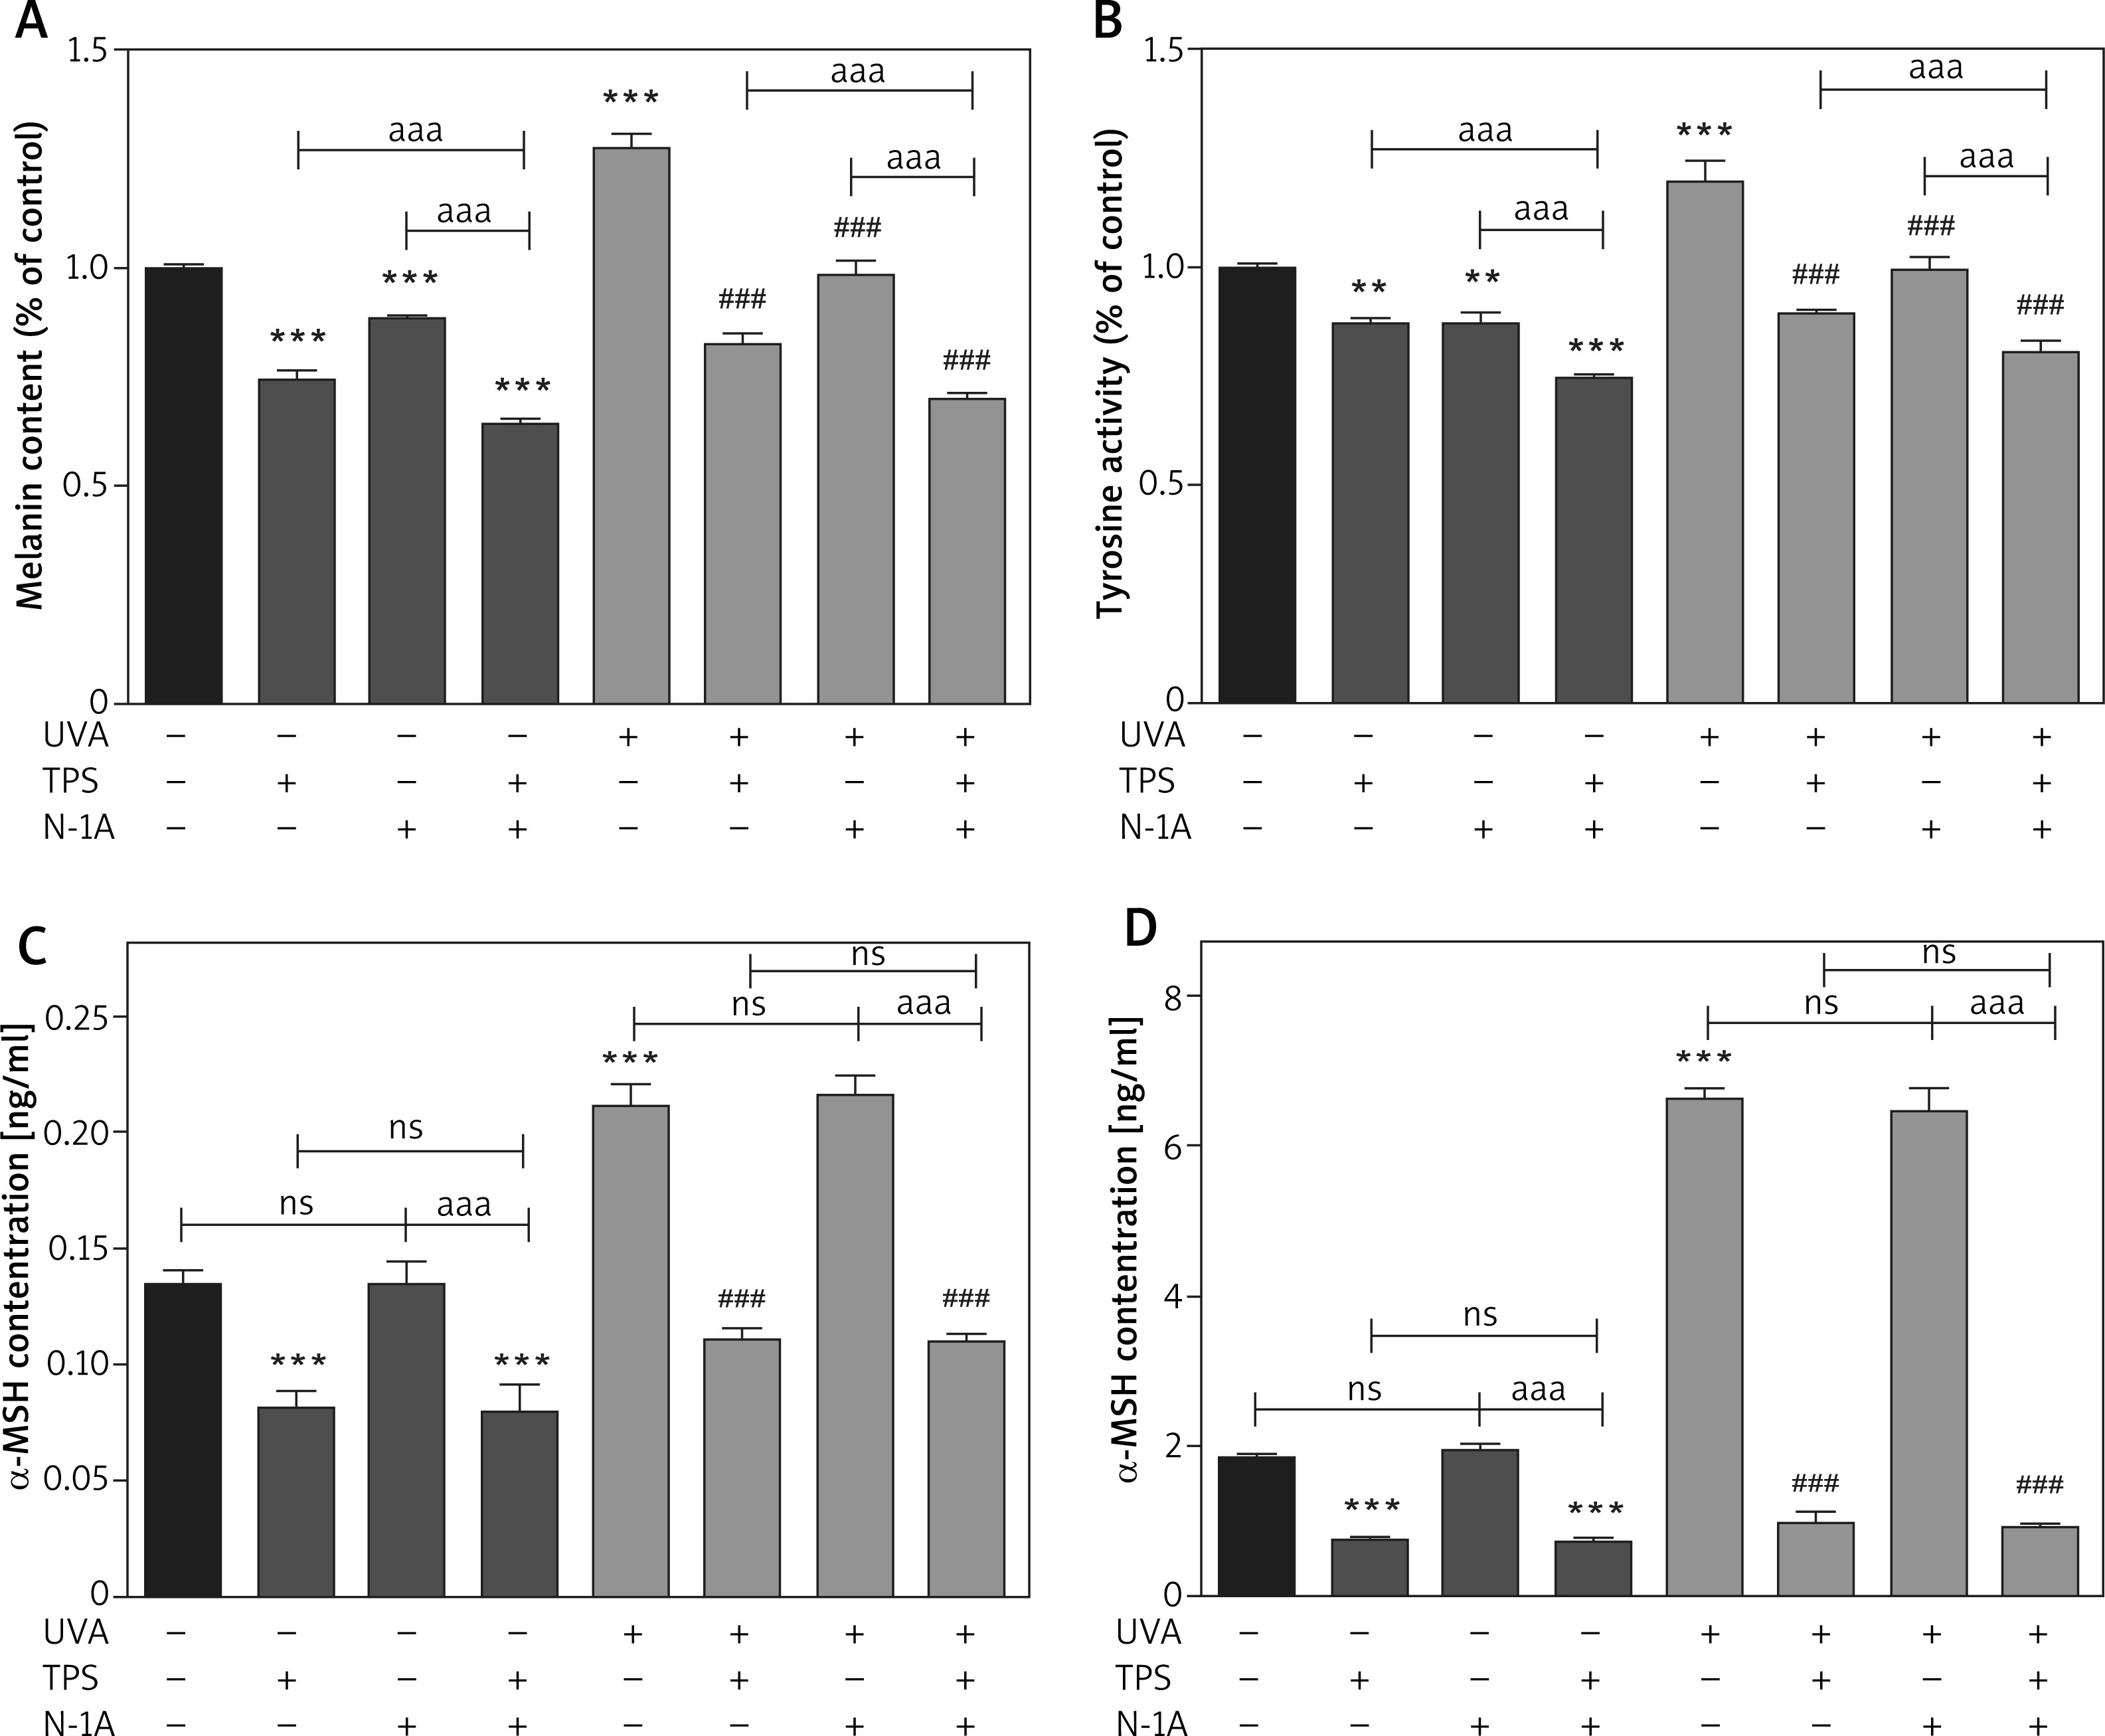
Figure 6
TPS inhibited the expression of melanogenesis-related proteins via suppressing the α-MSH-MC1R signalling pathway. HEM cells were treated with TPS (10 μg/ml) and/or N-A (20 μm) in the presence or absence of UVA exposure (15 J/cm2). A – Western blot was then applied to detect the related protein levels. Equal protein loading was confirmed using GAPDH antibody. B–F – Mean intensity of MC1R, tyrosinase, TRP2, TRP1 and MITF are shown in the graph on the right. Error bars show means ± SEMs. *P < 0.05, **p < 0.01, ***p < 0.001 versus non-treated cells, # p < 0.05, ## p < 0.01, ### p < 0.001 versus UVA-treated cells, a p < 0.05, aa p < 0.01, aaa p < 0.001, ns p > 0.05
Discussion
UV, from either sunlight or indoor tanning devices, is considered a predominant environmental risk factor for skin, and continuous UV exposure induces gradual skin damage and leads to other changes that are categorized as UV-induced photoaging, such as deep and coarse wrinkles and mottled hyperpigmentation [3]. Various skin-whitening agents are in use for the prevention and improvement of skin melanogenesis. However, many of these agents are from the chemical origin and are suffering from the limitations of causing various side effects including vitiligo, skin peeling, redness, and even cancer, thus limiting their application [13–15]. Due to these side effects, natural compounds with an inhibitory effect on melanin hyperpigmentation have been considered for the development of cosmetic agents in preventing hyperpigmentary disorders such as melasma, freckles, and age spots. Therefore, this study aimed to elucidate whether the TPS, a natural plant extract, inhibited α-MSH-MC1R signal pathway, which is activated in UV-induced melanogenesis.
Tyrosinase plays a pivotal role in the melanin biosynthesis pathway, which is also widely used as the target enzyme in screening potential inhibitors of melanogenesis [16, 17]. To investigate whether TPS has anti-melanogenic activity, the effects of TPS on tyrosinase enzyme activity were examined. The result was found to be in agreement with previous studies regarding the inhibition of tyrosinase activity in HEM cells by TPS [10, 18, 19]. To investigate the true inhibitory effect of TPS on melanogenesis, the melanin content assay was performed at different concentrations of TPS. As shown in Figure 2, TPS has a strong inhibitory effect on melanin production in HEM cells. Previous studies have also shown that EGCG has a benefit on the down-regulation of MITF production [10, 20]. MITF is one of the major transcriptional regulators of melanin-related proteins such as tyrosinase, TRP1, TRP2, and MITF. As expected, in the present study, TPS significantly mitigated the expression of MITF, and its downstream enzymes including tyrosinase, TYP1, and TYP2. Once the skin is exposed to UV radiation, melanocortin peptides, such as α-MSH, is secreted from keratinocytes and melanocytes, where α-MSH influences skin pigmentation in a paracrine and autocrine manner. Sato et al. [18] showed that epigallocatechin gallate EGCG) inhibited α-MSH-induced melanin production and tyrosinase activity in B16 melanoma cells with dose-dependent. But, whether TPS could directly repress tyrosinase activity or indirectly inhibit α-MSH related pathways remains unclear. In this study, we examined the effects of the TPS on the α-MSH induced by UVA in both HaCaT cells and HEM cells. We found that the secretion of α-MSH in both HaCaT cells and HEM cells was effectively inhibited by different doses of TPS (5, 10, and 15 μg/ml). However, specific dose-dependent? was not found. Kim et al. [10] reported that EGCG has a benefit on the down-regulation of MITF production and does not appear to activate the ERKs-MITF pathway. MITF also can be activated by other signalling pathways, such as the α-MSH-MC1R pathway. α-MSH binds to the MC1R, activating adenylate cyclase and cyclic AMP (cAMP). Activation of cAMP stimulates signalling pathways involving protein kinase A (PKA) and cAMP response element-binding protein and increases the expression of MITF. N-1A, a novel peptide competing with α-MSH, significantly downregulated the expression of MC1R, tyrosinase, TRP1, TRP2, and MITF via binding to MC1R. However, N-1A could not suppress the generation of α-MSH, which was opposite to the result of TPS. Then, western blot analysis suggested that TPS does not downregulate MC1R expression. Besides, the expression level of MC1R had no significant difference between the N-1A group and the co-treated group with TPS and N1-A. Thus, the inhibitory effects of TPS on the melanogenesis of HEM cells are attained through downregulating the generation of α-MSH rather than reducing the expression of MC1R.
Conclusions
Our results demonstrated that TPS exerted anti-melanogenic effects, as well as the mechanisms responsible for these effects. TPS-induced anti-melanogenic effects via suppressing a-MSH-MC1R signal pathway. Extracellular signal-regulated protein kinase inactivation caused MITF downregulation, subsequently suppressed the expression of tyrosinase, TRP1, TRP2, and finally inhibited melanin synthesis. In conclusion, TPS may be used in skin whitening products in the future.


