
Introduction
Cholangiocarcinoma (CCA) comprises a diverse group of malignancies that occur anywhere along the biliary tree. It is the 2nd most common cause of hepatic malignancy after hepatocellular carcinoma (HCC). Cholangiocarcinoma is the most common biliary malignancy [1]. It accounts for 10-25% of hepatobiliary malignancies [2].
According to anatomical location, two-thirds of CCAs affect the extrahepatic bile duct, while the remaining one-third involves the intrahepatic biliary tree [3]. It is a fatal neoplasm usually diagnosed at an advanced stage due to the unfavorable anatomic location. Therefore, early diagnosis and detection of at-risk cases are essential. Serum markers and molecular studies can help in this and aid in the development of novel systemic therapies for advanced disease [4].
The exact etiology of CCA is unknown but several risk factors for CCA are well described. These include cholestatic liver diseases such as primary sclerosing cholangitis, infections including hepatitis B or C virus, liver fluke, and genetic disorders [5]. Regardless of etiology, most risk factors produce chronic inflammation or cholestasis [6].
As for many other tumors, the development of CCA is a multistep process that begins with chronic inflammation and the activation of growth factors which promote cholangiocyte proliferation in the presence of molecular aberrations [7]. These include alterations in the regulatory genes with activation of oncogenes and inactivation or loss of tumor suppressor genes (TSGs) in addition to epigenetic modifications [8].
Mutations in tumor-suppressor genes and oncogenes have been found in CCA: TP53, KRAS, MLL3, and many others, which affect many intracellular pathways with loss of cell proliferation control. Epigenetic changes broadly include the deactivation of histone modifiers, the activation of G proteins, and the loss of genomic stability [9].
Epidermal growth factor (EGF) is one of the essential proteins that regulate survival of cells. EGF binds to its receptor on the cell surface with activation of downstream signaling pathways resulting in various biochemical reactions. These reactions increase expression of key regulatory genes in the cell involved in cellular proliferation, differentiation, survival and DNA synthesis [10]. These signaling pathways are beneficial for cancer cell proliferation, including their chronic initiation and the progression through the cell cycle [11].
Increased expression of EGF and its receptor has been detected in a variety of tumor tissues including glioblastoma, lung cancer, breast, colorectal, ovarian, prostate, and pancreatic cancers [11].
Epidermal growth factor plays a critical role in proliferation of cells, differentiation and tumorigenesis of epithelial tissues. Several studies have shown an association between HCC and EGF overexpression in the tumor microenvironment. Mounting evidence supports the role of EGF in the malignant transformation and progression of tumors [12].
Genetic variants in the EGF gene play critical roles in the carcinogenesis. Several case-control studies have described the association between single nucleotide polymorphism (SNP) in the EGF promoter region and susceptibility of cancer to distinct types of tumors such as gliomas, melanoma, HCC, gastric cancer and others [13]. EGF and EGFR expression levels are correlated with progressive tumor growth and metastasis by increasing tumor cell proliferation and migration [10].
The EGF 61A>G polymorphism (rs4444903) is a common functional SNP in the 5’untranslated region of the EGF gene that influences the amount of EGF produced. Individuals with EGF genotype G/G appear to produce higher amounts of EGF than those with A/A genotype and this affects susceptibility to different types of malignancy [14]. Many researchers have reported that EGF rs4444903 could result in increasing the risk of tumorigenesis in HCC [15].
The current study aimed at investigating the association between the EGF rs4444903 A>G polymorphism and development of cholangiocarcinoma in Egyptian patients.
Material and methods
Subjects
This is a case-control study including 100 subjects, 50 CCA patients (age 39-66 years), 32 male and 18 female, and 50 healthy individuals as controls (age 39-63 years), 26 male and 24 female. Patients were enrolled from the Hepatology and Gastroenterology Department, National Liver Institute at Menoufia University within a period of one year. Laboratory work was carried out in the clinical pathology department, National Liver Institute, Menoufia University. Written informed consent was obtained from all participants and this study was approved by the Ethical Scientific Committee of the National Liver Institute, Menoufia University. The study protocol obeys the ethical guidelines of the Declaration of Helsinki as reflected prior the approval by the institution’s human research committee.
All subjects were subjected to laboratory tests of liver functions (aspartate aminotransferase [AST], alkaline phosphatase (ALP), alanine aminotransferase [ALT], γ-glutamyl transpeptidase [GGT], total and direct bilirubin, total protein, albumin, prothrombin concentration and international normalized ratio [INR]), serum levels of carbohydrate antigen 19-9 (CA19-9) and α-fetoproteins (AFP). Hepatitis C virus (HCV) Ab and HBsAg was done for all subjects by 3rd generation ELISA and HCV RNA level was assessed for patients who were positive for HCV Ab by COBAS AmpliPrep/COBAS TaqMan (Roche Diagnostics Ltd., Germany) with a detection limit of 15 IU/ml. Body mass index (BMI) was calculated for all patients.
The diagnosis of CCA was made by clinical presentations, ultrasound (US) showing a bile stricture or a mass, computed tomography (CT) with diagnostic features for CCA and laboratory investigations. The diagnosis was confirmed by histopathological examination. Healthy individuals were recruited from a blood banking unit. They were selected according to physical examination and their normal laboratory tests and with no recent or earlier history of cancer or other major diseases.
Patients with hepatocellular carcinoma, primary CCA with secondary metastasis, patients with other malignancies, cholelithiasis, primary sclerosing cholangitis, and smokers were excluded from the study. Also, we excluded patients with chronic hepatitis B virus (HBV) infection and diabetes mellitus. Because obesity is well known as a possible risk factor for CCA patients, those with BMI above 25 kg/m2 were excluded from the study.
Genomic DNA extraction
Three ml of venous blood was collected from CCA patients and controls. The whole blood was immediately stored after collection at −80°C until use. The genomic DNA was extracted from whole blood samples using the Invitrogen DNA Blood Mini Kit (Carlsbad, CA 92008, USA) according to the manufacturer’s instructions. DNA was dissolved in TE buffer (10 mM Tris, 1 mM EDTA, pH = 7.8). DNA samples were stored at −20°C and used as templates in real-time polymerase chain reaction (PCR).
EGF (rs4444903) genotyping assay
The polymorphism for EGF (rs4444903) was genotyped by fluorescence detection by real-time PCR on the ABI 7500 Real Time PCR system (Applied Biosystems, USA). An ABI TaqMan allelic discrimination kit was used for the analysis. The total volume of each reaction was 20 µl, containing 10 µl of TaqMan Universal genotyping Master Mix (2X), 0.5 µl of TaqMan assay 20k, 5 µl of template DNA, and 4.5 µl of nuclease-free water. Real-time PCR conditions included an initial denaturation step for 10 min at 95°C, followed by forty amplification cycles for 15 s and 60°C for 1 min at 95°C.
Statistical analysis
Results were statistically analyzed using SPSS 22.0 (IBM). Qualitative data were represented as frequency and percentage. Clinical data are presented as means ±SD for normally distributed variables or median and interquartile range for non-normally distributed variables. Hardy-Weinberg equilibrium (HWE) was tested by the chi-square (χ2) test to compare observed genotype frequencies with expected frequencies in the control group. Continuous data between two groups were compared using the Mann-Whitney test for the non-parametric data and Student’s t-test for the parametric data. For comparison of data for more than 2 groups, ANOVA was used for continuous data with normal distribution and the Kruskal-Wallis test for non-normally distributed data. The χ2 test was used in comparison between ≥ 2 groups with respect to one qualitative variable, comparing the allele frequency and genotype distribution in addition to estimating risk by calculating the odds ratio (OR) for the underlying disease. The odds ratio (OR) and the 95% confidence interval (95% CI) were calculated to assess the associations between EGF genotypes and risk of CCA. P < 0.05 was considered to indicate a statistically significant result.
Results
Characteristics of studied groups
This study included 50 CCA patients, age range 39-66 years, who were mostly males (32 males and 18 females), and the control group included 50 healthy subjects, age range 39-63 years (26 male, and 24 females). The case and control groups were not signi ficantly different with respect to age or gender. We found significantly higher AST, ALT, ALP, bilirubin, GGT and INR in the CCA group than the control group. Albumin and total protein were significantly lower in the CCA group than in the control group. Hemoglobin and platelet count were significantly lower in CCA patients than in the control group while white blood cell (WBC) count in the control group was lower than in the CCA group (p = 0.002). Regarding tumor markers CA19-9 was significantly higher in the CCA group (p < 0.001) than the control group but there was no significant difference between the control group and the CCA group regarding AFP level (p > 0.05) (Table 1).
Table 1
Demographic data and laboratory investigations in the studied groups
[i] CCA – cholangiocarcinoma, AST – aspartate aminotransferase, ALT – alanine aminotransferase, ALP – alkaline phosphatase, GGT – γ-glutamyl transferase, AFP – α-fetoprotein, TB – total bilirubin, DB – direct bilirubin, INR – international normalized ratio, HB – hemoglobin, WBCs – white blood cells, IQR – interquartile range, SD – standard deviation, NS – non-significant at p-value > 0.05, HS – highly significant at p-value < 0.01; a Student t-test, b Pearson chi-square test, C Mann-Whitney U test
Genotype distribution among the studied groups and risk assessment
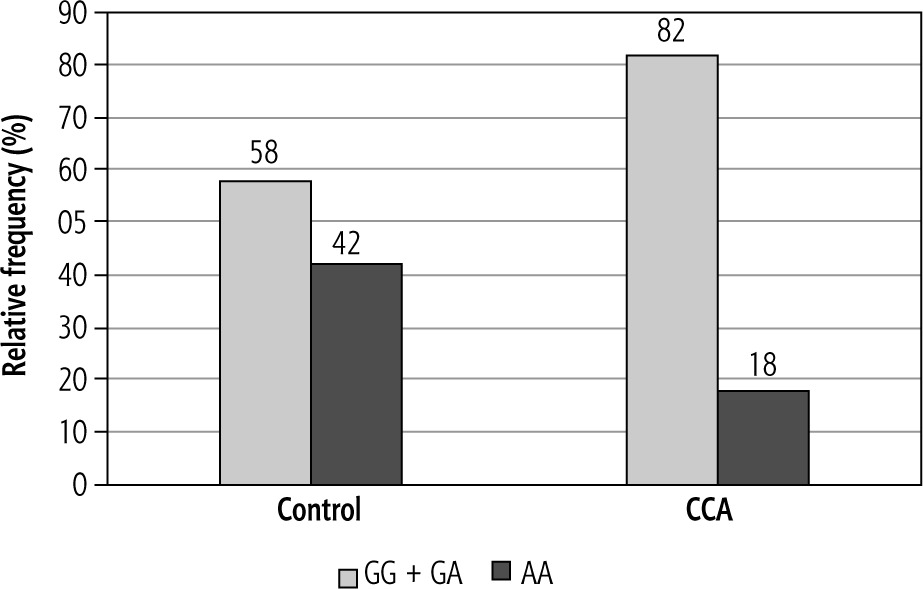
A significant difference was observed in the genotype frequencies of EGF (rs4444903) between the control group and patients with CCA. The G allele was the most frequent allele in the CCA group (59%) compared to the control group where the A allele was the most frequent allele (61%) (p = 0.005). The genotype distributions of EGF (rs4444903) were in accordance with the HWE in both the control group and CCA patients (p > 0.05).
The GG genotype was higher in cases of CCA than in the control group and was associated with an increased risk of CCA compared to the AA genotype (OR = 4.20, 95% CI: 1.40-12.60, and p = 0.009). The AG genotype was associated with significantly increased risk of CCA compared with the AA genotype (OR = 2.83, 95% CI: 1.05-7.60, and p = 0.037).
The variant G allele also showed a highly significant association with CCA risk in the dominant model (p = 0.009). However, in the recessive model the G allele showed a nonsignificant association with the risk of CCA (p = 0.075) (Table 2).
Table 2
Comparison of genotype distribution and allele frequencies of EGF polymorphism in CCA vs. control group
[i] EGF – epidermal growth factor, SNP – single nucleotide polymorphism, CCA – cholangiocarcinoma, *Pearson chi-square test, significant p-value < 0.05, non-significant at p-value > 0.05, OR – odds ratio; a dominant model (homozygous type + hybrid type) vs. wild type – b recessive model, homozygous vs. (hybrid type + wild type)
The effect of genotype distribution on laboratory results and clinical parameters in CCA patients
Statistical analysis of demographic data and laboratory tests according to EGF (rs4444903) genotypes in the CCA group indicates no significant differences between EGF rs4444903 genotypes regarding liver functions with the exception of bilirubin, whose comparisons revealed a significant difference (p < 0.05), and a further pairwise comparison revealed a significant difference between AA genotype and AG and GG genotypes.
There was no significant difference in the values of AFP between different genotypes (p > 0.05) while CA19-9 showed a significant difference in CA19-9 between different genotypes (p < 0.05). Further multiple pairwise comparison showed a significant difference in CA19-9 values between the GG genotype and AA genotype. There were no significant differences between the EGF rs4444903 genotypes in terms of the size of foci and presence of chronic HCV infection in the CCA group (p = 0.220, 0.645, respectively) (Table 3).
Table 3
Statistical analysis of biochemical and clinical parameters regarding genotypes of EGF polymorphism (61 A/G) in CCA patients
[i] CCA – cholangiocarcinoma, HCV – hepatitis C virus, IQR – interquartile range significant p-value < 0.05, non-significant at p-value > 0.05, a Kruskal-Wallis test, b Fisher’s exact test *Multiple pairwise comparisons adjusted by Bonferroni post hoc test, p1 – significant difference between genotype AA and AG, p2 – significant difference between genotype AA and GG, p3 – significant difference between genotype AG and GG
Discussion
Cholangiocarcinoma is a very aggressive malignancy characterized by a poor outcome even when diagnosed early [16]. For reduction of the global mortality from cholangiocarcinoma, efforts focus on early and accurate identification of the high-risk individuals and targeted molecular-based therapies for established cholangiocarcinoma [6]. As with most types of malignancy, CCA is the result of a complicated interaction between environmental and genetic factors [17].
The EGF/EGF receptor signaling pathway has important regulatory role in various cells, especially epithelial cells. Dysregulation of this signaling pathway is believed to be important in early carcinogenesis [18]. The EGFR system is a very important mediator in the microenvironment of the tumor through activation of tyrosine kinase that exerts effects on cell proliferation and differentiation resulting in increased tumor growth [19].
Epidermal growth factor rs4444903 polymorphism involves an A>G transition at position 61 of the 5’ untranslated region of the EGF gene, and is associated with several types of cancer [20]. The mechanism whereby GG genotype of EGF A61G increases production of EGF may involve many factors. First, G to A substitution might affect post-transcriptional modifications of messenger RNA with 2-fold longer half-life for messenger RNA; this change could enhance the production and secretion of EGF with increased serum levels of EGF. Second, this polymorphism is linked to functional polymorphism elsewhere in the gene [21].
We supposed that carriers of the G allele, especially those with the GG genotype, may have increased risk of developing CCA. So, we aimed in this work to study the association between EGF SNP (rs4444903) and the risk of CCA in Egyptian patients. Many studies have aimed to study the association between EGF (rs4444903) and HCC, but to our knowledge neither of them focused on EGF (rs4444903) gene polymorphism in Egyptian patients with CCA.
The mean age of the studied groups was above fifty with male predominance. We found that distribution of the genotypes and allele frequencies between patients with CCA and healthy volunteers was significant. AG genotype is the most frequent genotype in CCA patients while the most frequent genotype in healthy volunteers was the AA genotype. Regarding allele frequency, variant G allele is the most frequent allele in CCA patients, while the wild A allele is the most frequent allele in healthy volunteers.
Additionally, the study revealed a significantly larger increase in risk for CCA by 2.83 times in subjects with AG genotypes than those with AA genotype compared with the control group while subjects with GG genotype showed an approximately 4.2 times larger increase in risk for CCA than AA genotype when compared with the control group.
The variant G allele also showed a highly significant association with CCA risk in the dominant model. However, in the recessive model, the G allele showed a nonsignificant association with the risk for CCA, suggesting a potential risk effect of the variant G allele in CCA susceptibility.
Similarly, Vishnoi et al. [22] proved that subjects with the GG genotype at rs4444903 in the EGF gene are 2.2 times more likely to have CCA and gall bladder cancer than those with the AA genotype. On the other hand, Meng et al. [23] evaluated the frequency of the EGF rs4444903 alleles in biliary tract cancer (BTC) according to the two subtypes and three differentiation stages (low, middle or high) of CCA. They found no significant differences in the allele frequency of EGF rs4444903 in CCA or gallbladder cancer.
The association between GG genotype and malignancy was approved in many other hepatic malignancies such as HCC. Zhong et al. [24] in their metaanalysis study showed that the 61*G polymorphism in the EGF gene is a risk factor for hepatocarcinogenesis while the EGF 61*A allele is protective.
We did not find any relation between EGF rs4444903 genotypes and either age or gender in control and CCA groups. Furthermore, we did not find significant differences between the EGF rs4444903 genotypes with respect to laboratory results in the CCA group, except for bilirubin and CA19-9, whose comparisons revealed a significant difference. The levels of bilirubin and CA19-9 were seen to be significantly higher in both AG and GG genotypes compared to AA genotype.
Furthermore, there was no significant difference between EGF rs4444903 genotypes regarding foci size and presence of chronic HCV infection in the CCA group.
Recently, Lurje et al. [25] investigated the association between EGF (rs4444903) polymorphism and the survival of CCA patients and did not find an association between this polymorphism and the overall survival of CCA. Studying different machineries of the immune system could help to identify the high-risk groups for diagnosis of CCA early and also could help to find new therapies for cholangiocarcinoma in the future [26].
We finally concluded that EGF rs4444903 polymorphism may have a role in the pathogenesis of CCA and the minor G allele may predispose to CCA, but it has no effect on the severity of the disease. It may need more studies in larger populations and different ethnic groups with measurement of the serum level of EGF and evaluating the association between it and the polymorphism. Also, gene-gene interaction and presence of other predisposing factors need further study.


