
Introduction
Allergen-specific immunotherapy (AIT) is the core treatment in allergic rhinitis and asthma. AIT has been shown to influence numerous immunological reactions, including early desensitization, T-cell and B-cell tolerance and switch of antibody class from IgE to IgG. However, the mechanisms behind a successful AIT are not fully understood [1].
Early desensitization is a relatively fast process leading to the decrease in reactivity of mast cells and basophils, despite persisting presence of allergen specific IgE. This effect is specifically exposed in ultra-rush protocols when tolerance is usually developed in a few hours. Such prompt reaction results from expression of a histamine receptor H2 (H2R) increase, leading to low FcεR1 reactivity [2]. Further, H2R may stimulate Th1 response and modulate dendritic cells (DCs) reactions [3].
The effect on T cells during AIT is described as a switch from Th2 to Th1 pathway. Its most possible mechanism includes the induction of T regulatory cells (Treg), which correlates with the clinical response in AIT. The transcription factor – FOXP3 may be helpful in Treg activation assessment [4–6]. Further, the levels of Treg products, such as interleukin-10 (IL-10) and transforming growth factor-β (TGF-β), change during AIT [1, 7, 8]. The role of IL-10 is complex. It promotes Th2 response but also suppresses inflammation and nuclear factor-κB (NF-κB) activation [9, 10]. Although Tregs seem to play a crucial role in the development of allergen tolerance, their induction is highly regulated by DCs. These cells are responsible for cytokine environment in which naïve T cells maturate. High stimulation of T cells through toll-like receptors (TLR) and DCs with proinflammatory cytokines (IL-6, TLR4, TLR8) breaks T cell allergen tolerance. This may suggest DC being the central point in AIT effect [1, 11, 12].
The initial theory on AIT mechanisms focused on antibody class switch from sIgE to sIgG4 [13]. With no ability to activate FcεRI on mast cells, sIgG was suspected to play a protective role by binding the allergen. B regulatory cells (Breg) producing IL-10 are partially responsible for this mechanism. Although sIgE levels do not correlate with clinical efficiency of AIT, still sIgE/sIgG4 ratio is used to monitor the immune system response to AIT [1, 14–17].
Until now no dominant mechanism or marker of AIT efficiency has been confirmed. Genetic studies seem to be a promising method to determine relations between gene expression levels and treatment outcome. The determination of the gene expression level using quantitative mRNA measurement with reverse transcription polymerase chain reaction is a preferred method to identify marginal changes in mRNA levels which correspond with cytokine levels or transcription factors. This method enables the analysis of cytokines which are usually expressed in low levels [18, 19].
Aim
The aim of this study was to analyse the expression of selected genes during the initial phase of AIT at two time points together with comparison to the control group. Relating the results to patients, symptoms severity would lead to the potential marker of treatment efficacy. By this analysis, we hope to be able to predict the outcome of AIT already at the early stage of the treatment. A whole genome study conducted by Niedoszytko et al. on patients starting AIT with wasp venom revealed 18 transcripts that change their expression with a correlation with clinical efficacy. Out of those genes, AFAP1L1, CLDN1, COMMD8, PCDHB10, PRLR, and TWIST2 were selected by the authors as those with the highest expression changes during treatment [20]. The clinical manifestation of wasp venom allergy is different, though the mechanism of tolerance development may be similar to AIT in allergic rhinitis. Following Pevec et al. results, FOXP3, GATA3, INPP5, TBX21, SYK and PIK3CD were selected as those changing the expression during AIT with house dust mite allergens [21]. Although FCER1A expression difference was not significant in this study (p = 0.07) Celesnik et al. showed otherwise [22]. Additionally, IFNG was chosen according to an early study by Varney et al. on patients receiving grass pollen AIT [23]. Finally TGFB was chosen due to its newly discovered impact on AIT well described by Akdis and Akdis [13]. The initial choice was strengthened by additional studies by Bonvalet et al. and Zheng et al. [22, 24, 25]. This search for a clinically useful biomarker addresses the needs implied by two main allergy societies: the American Academy of Allergy, Asthma & Immunology and the European Academy of Allergy and Clinical Immunology. It is important to establish how a patient responds to the therapy as early as possible to avoid 3-year treatment in no responders and strengthen the compliance in responders. The golden standard, i.e. inhaled provocation is both troublesome and costly, thus it is not the best choice for clinical use. The biomarkers suggested to date, for instance specific IgE level, IgE/IgG4 ratio, basophil activation test, serum IgE inhibitory activity, Th1, Th2, Treg although promising have failed so far to give consistent results or still await proper validation in replicated trials [26].
Material and methods
The study patient group included 22 consecutive patients allergic to grass pollen (6 women and 16 men) with diagnosis of seasonal allergic rhinitis. The severity was assessed according to the Allergic Rhinitis and its Impact on Asthma guidelines (Table 1) [27]. All patients were recruited at the start of 3-year grass pollen subcutaneous AIT following the conventional protocol. The mean age of participants was 31 years (range: 18–41). All patients were diagnosed with allergic rhinitis and 15 (68%) were additionally asthmatic (with a level of treatment according to Global Initiative for Asthma guidelines – Table 1) [28]. The most prevalent comorbidities were hypertension (3 patients) and smoking addiction (3 patients). Written, informed consent was obtained on enrolment. Blood samples were collected (using Tempus™ blood RNA tube; Applied Biosystems®) at two different time points: before starting the AIT and after reaching the maintenance dose (sample A and B, respectively). Blood collection before AIT was performed between August and May of the following year, which is outside the grass pollen season in northern Poland. The mean time between sample A and B collection was 138 days. Samples C were obtained at the same time as samples A from 25 healthy donors with a negative allergy history and negative grass pollen specific IgE. All patients were evaluated for clinical treatment efficacy using the Allergy Control Score (ACS) based on non-commercial agreement with Allergo-Pharma. To assess symptoms during two consecutive pollen seasons the patients underwent ACS scoring before AIT and after 1 year of treatment [29]. The patient characteristics are presented in Table 1.
Table 1
Patient characteristics. Severity assessed according to ARIA guidelines
All blood samples were stored at –80°C before processing. Isolated mRNA was used to perform reverse transcription with Tempus™ Spin RNA Isolation Kit (Applied Biosystems®). Isolated total mRNA was transferred to perform reverse transcription with High Capacity cDNA Reverse Transcription Kit (Applied Biosystems®) in Thermal Cycler 9700 (Applied Biosystems®). 450 ng Universal Human Reference RNA (Agilent Technologies) was used as a control. The cDNA product was then transferred to TaqMan Array Micro Fluidic Cards (Applied Biosystems®) for PCR in 7900HT Real Time Fast PCR System (Applied Biosystems®). The microfluidic cards had 16 probes placed by the manufacturer for detection of the following genes: AFAP1L1, CLDN1, COMMD8, FCER1A, FOXP3, GATA3, IFNG, INPP5D, PCDHB10, PIK3CD, PRLR, SYK, TBX21, TGFB, TWIST2, and 18S. 18S ribosomal rRNA was used as a housekeeping gene for normalization. All above-mentioned laboratory procedures were performed according to the manufacturer’s instructions.
The result of PCR was expressed as a number of cycles until cDNA concentration crossed set threshold. The number was then normalized with 18S and referred to calibrator 450 ng Universal Human Reference RNA (Agilent Technologies). Primary endpoint was Relative Quantification (RQ) calculated according to MIQE guidelines [30].
The study was approved by the appropriate Ethics Commission at the Medical University of Gdansk.
Statistical analysis
Statistical analysis was performed with Statistica 12 software (StatSoft Tulsa, USA) on non-commercial licence of the Medical University of Gdansk. The descriptive statistics as: mean, median, standard deviation, lower and upper quartile and their 95% confidence intervals (95% CI) were calculated for each variable within each group. The Lilliefors test was applied to verify the hypothesis on normality of gene expression distribution within each subpopulation while F test was used to check on the variance homogeneity. Depending on these results, the parametric (paired t test) or nonparametric test (Mann-Whitney U test) was performed to verify the statement on mean/median value equality between subpopulations. In case of the paired data, the test used was one sample t test or Wilcoxon rank test. The statistical testing was accompanied by the estimation of the effect size done by Cohen’s d statistics. Finally, the linear regression model for prediction of AIT clinical success was built with the support of the forward feature selection procedure and Bayesian Information Criterion (BIC) for model selection.
Results
A significant change in expression between samples A and B was found in the IFNG gene (paired t test, p = 0.0243, medium effect, Cohen’s d = 0.5174) and additionally a change nearing significance for TBX21 (Wilcoxon tests p = 0.0883; medium effect, Cohen’s d = 0.5266). The mean expression changes in IFNG during AIT (samples A vs. B vs. C) are demonstrated in Figure 1. Mann Whitney test analysis was performed for 22 patients and 25 healthy controls and revealed a significant difference between sample A and C in AFAP1L1, and PIK3CD (Table 2). A significant difference was observed in COMMD8 and TWIST2 using the parametric test. The highest significance was observed for COMMD8 (t test, p = 0.0014, large effect, Cohen’s d = 0.9950).
Figure 1
Expression of IFNG shown by Relative Quantification (RQ). Comparison of samples A (before treatment) vs. B (during treatment) and C (healthy controls)
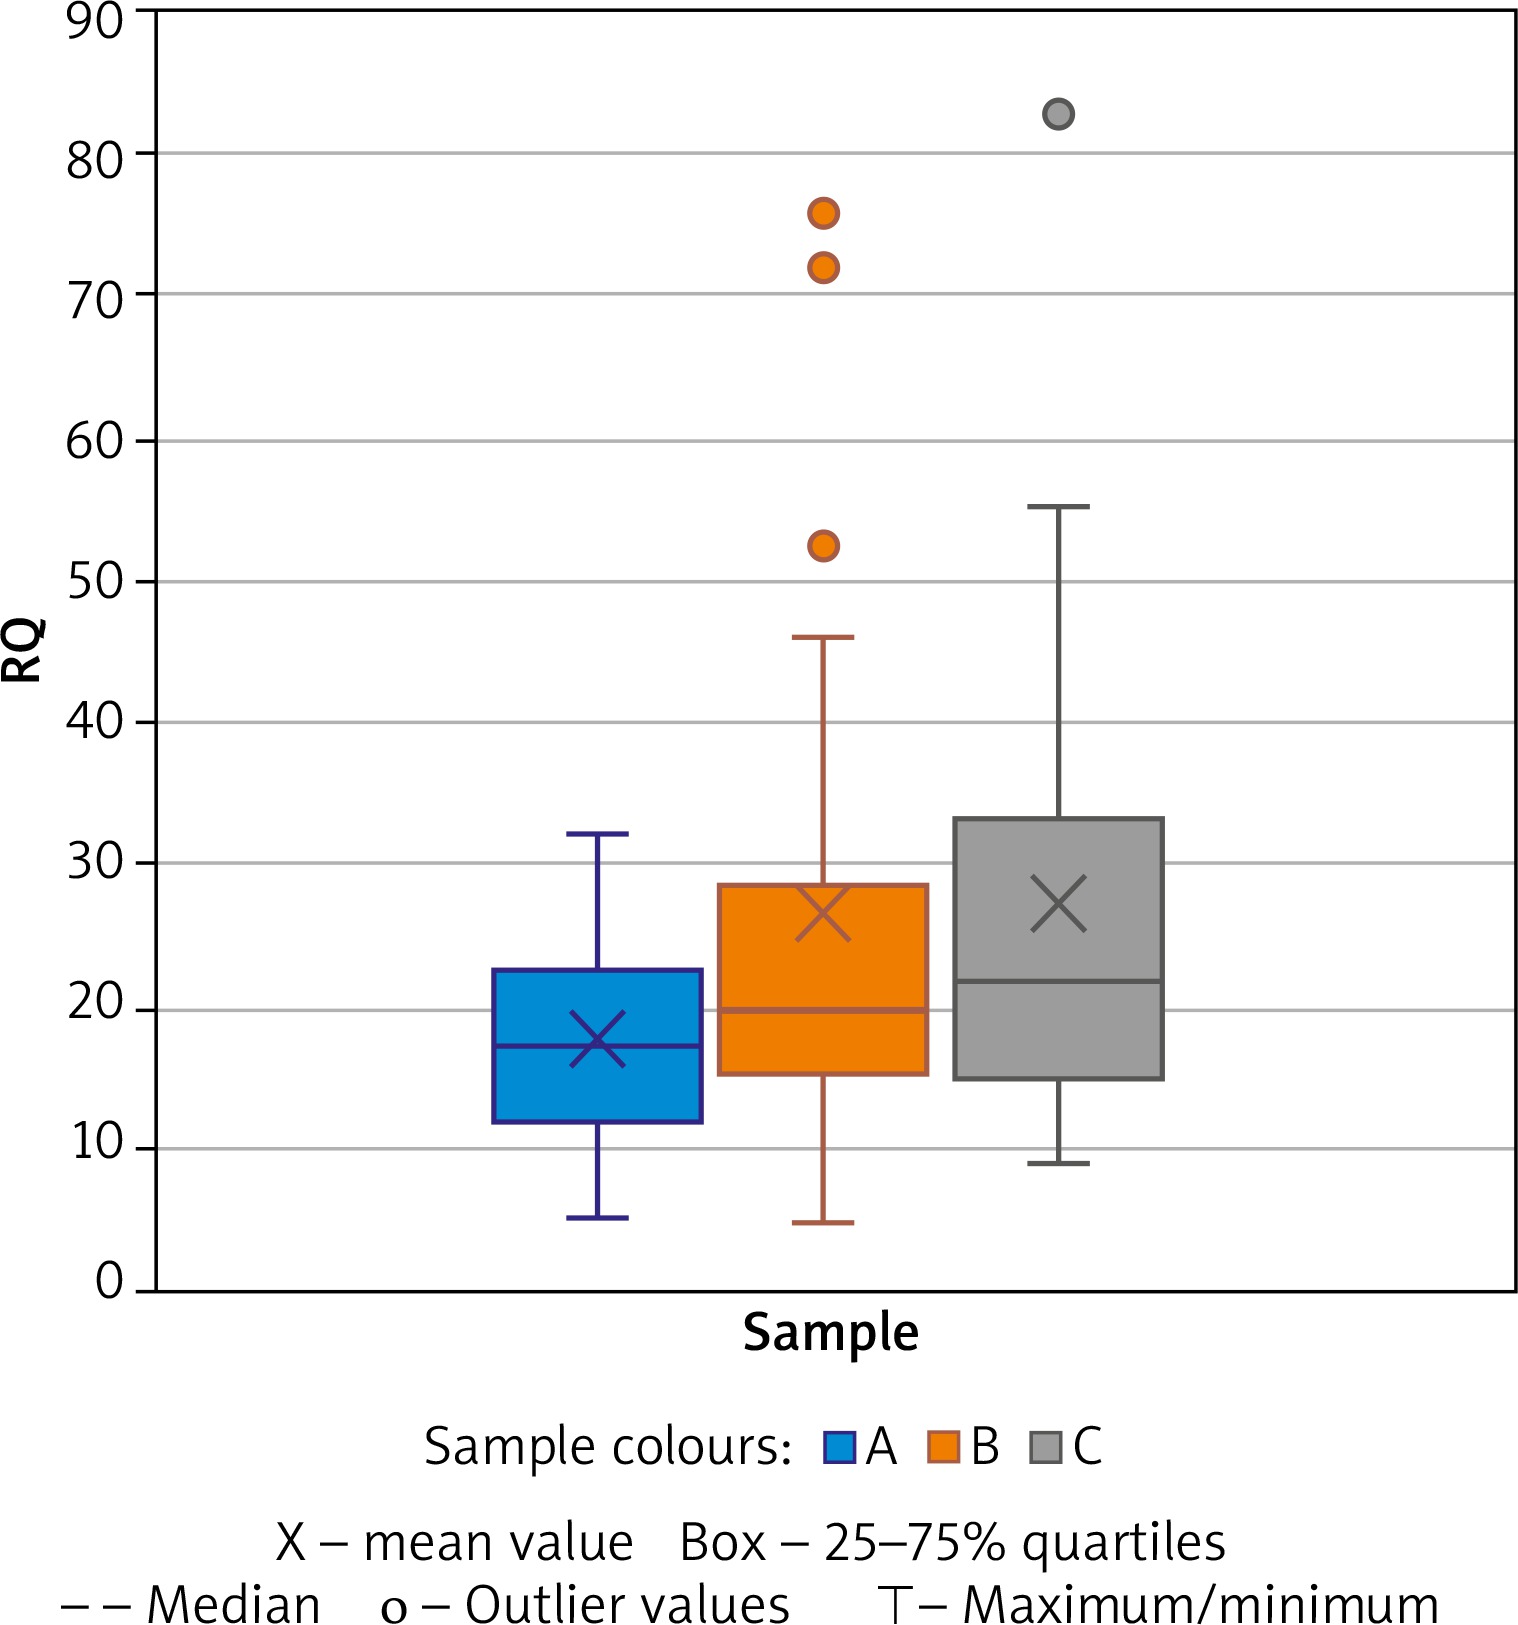
Table 2
Comparison results of gene expression for samples A vs. B and A vs. C
| Gene | Sample A-B, n | P-value | Cohen’s d | Sample A, n | Sample C, n | P-value | Cohen’s d |
|---|---|---|---|---|---|---|---|
| AFAP1L1 | 22 | 0.86961 | 0.0354 | 22 | 25 | 0.01022 | 0.5078 |
| CLDN1 | 22 | 0.78262 | 0.1103 | 22 | 25 | 0.11222 | 0.4613 |
| COMMD8 | 22 | 0.23611 | 0.2600 | 22 | 25 | 0.00141 | 0.9950 |
| FCER1A | 22 | 0.54812 | 0.1374 | 22 | 25 | 0.12222 | 0.3873 |
| FOXP3 | 22 | 0.93532 | 0.1490 | 22 | 25 | 0.38792 | 0.0590 |
| GATA3 | 22 | 0.55971 | 0.1264 | 22 | 25 | 0.25402 | 0.0192 |
| IFNG | 22 | 0.02431 | 0.5174 | 22 | 25 | 0.11712 | 0.6484 |
| INPP5D | 22 | 0.63782 | 0.1265 | 22 | 25 | 0.83952 | 0.1384 |
| PCDHB10 | 22 | 0.98702 | 0.0645 | 22 | 25 | 0.28162 | 0.3038 |
| PIK3CD | 22 | 0.90952 | 0.1424 | 22 | 25 | 0.03762 | 0.5606 |
| PRLR | 22 | 0.29132 | 0.2644 | 22 | 25 | 0.29132 | 0.0943 |
| SYK | 22 | 0.73761 | 0.0724 | 22 | 25 | 0.32152 | 0.0567 |
| TBX21 | 22 | 0.08832 | 0.5266 | 22 | 25 | 0.36011 | 0.2703 |
| TGFB | 22 | 0.76331 | 0.0650 | 22 | 25 | 0.32152 | 0.0349 |
| TWIST2 | 22 | 0.63892 | 0.1726 | 22 | 25 | 0.00021 | 0.7461 |
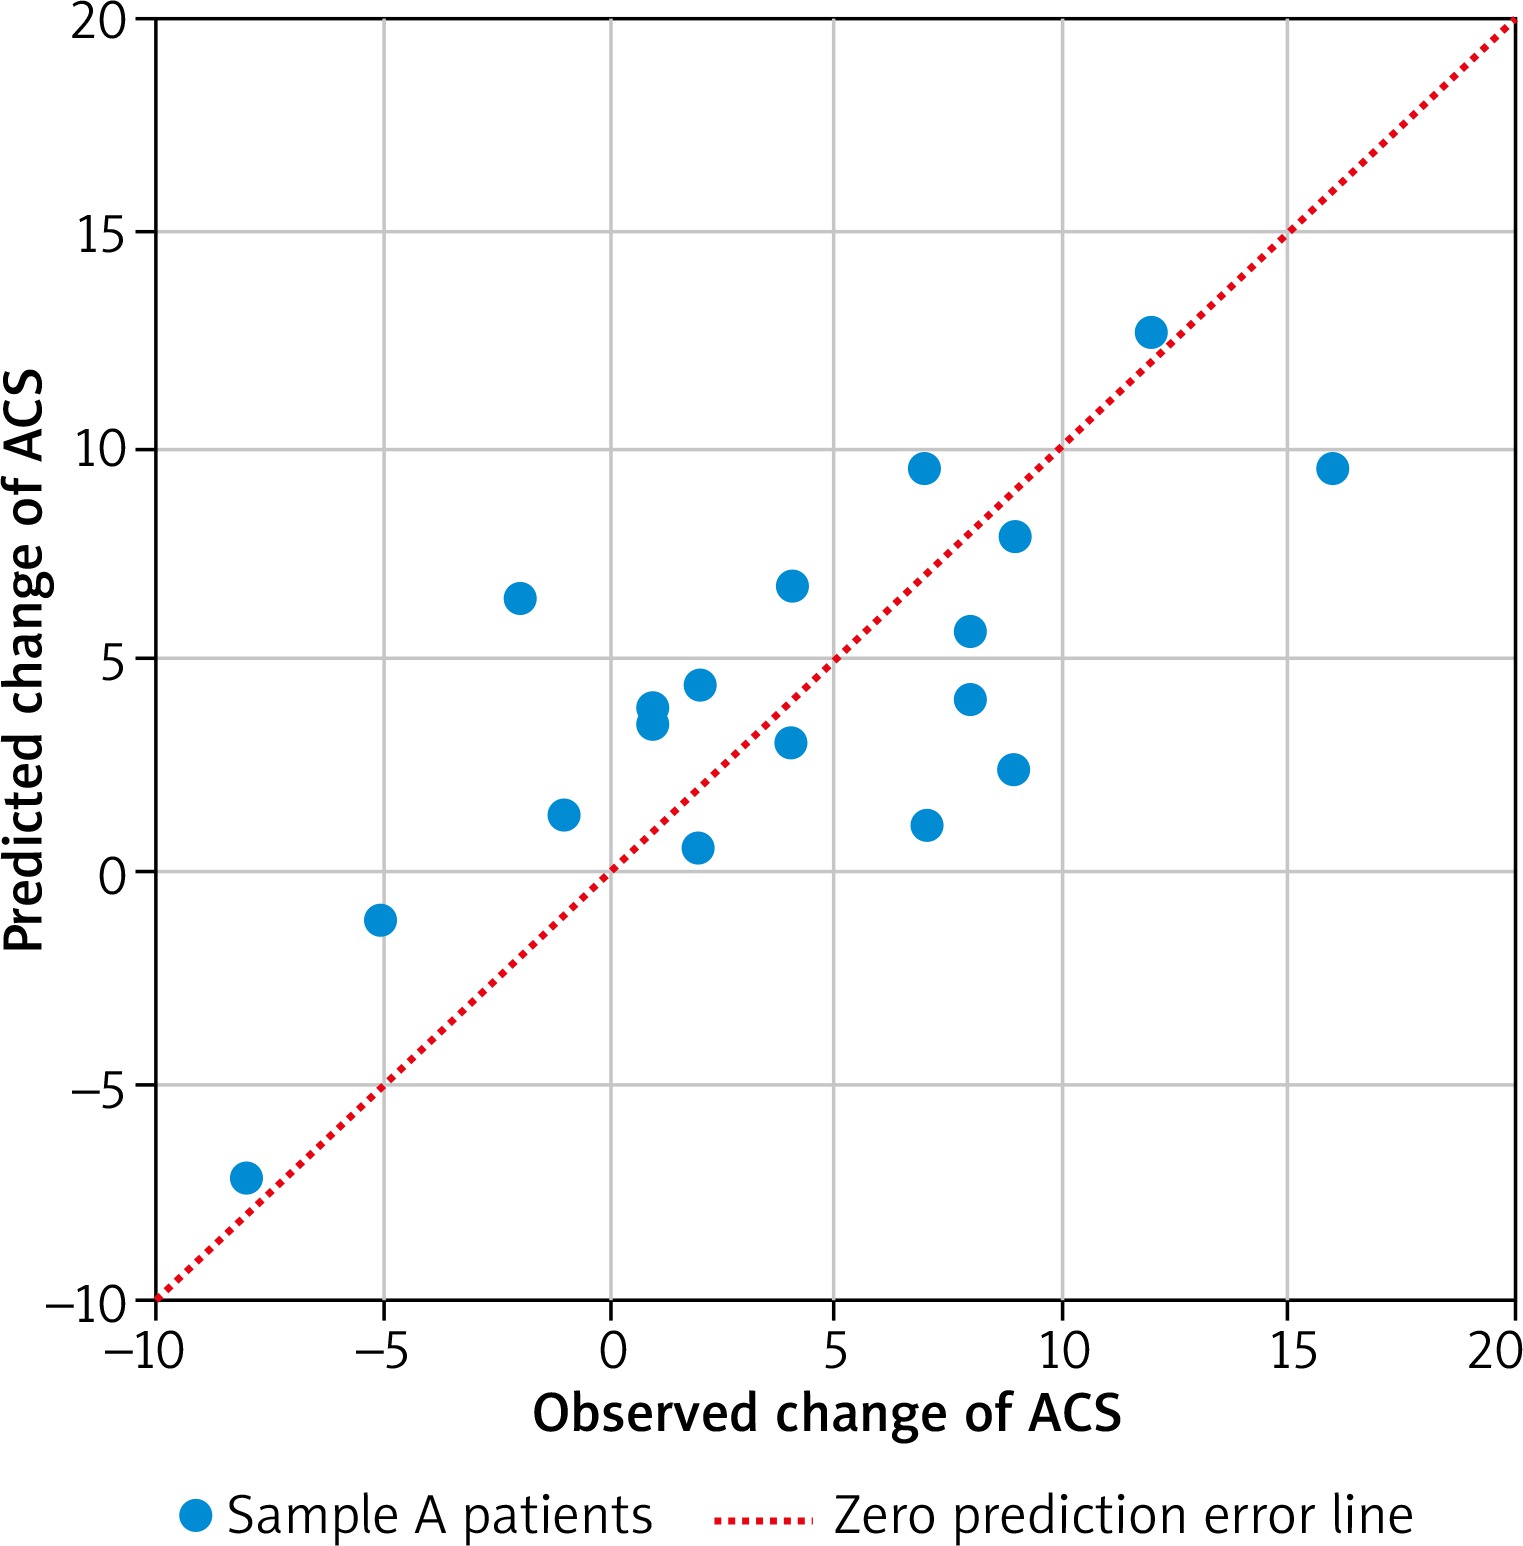
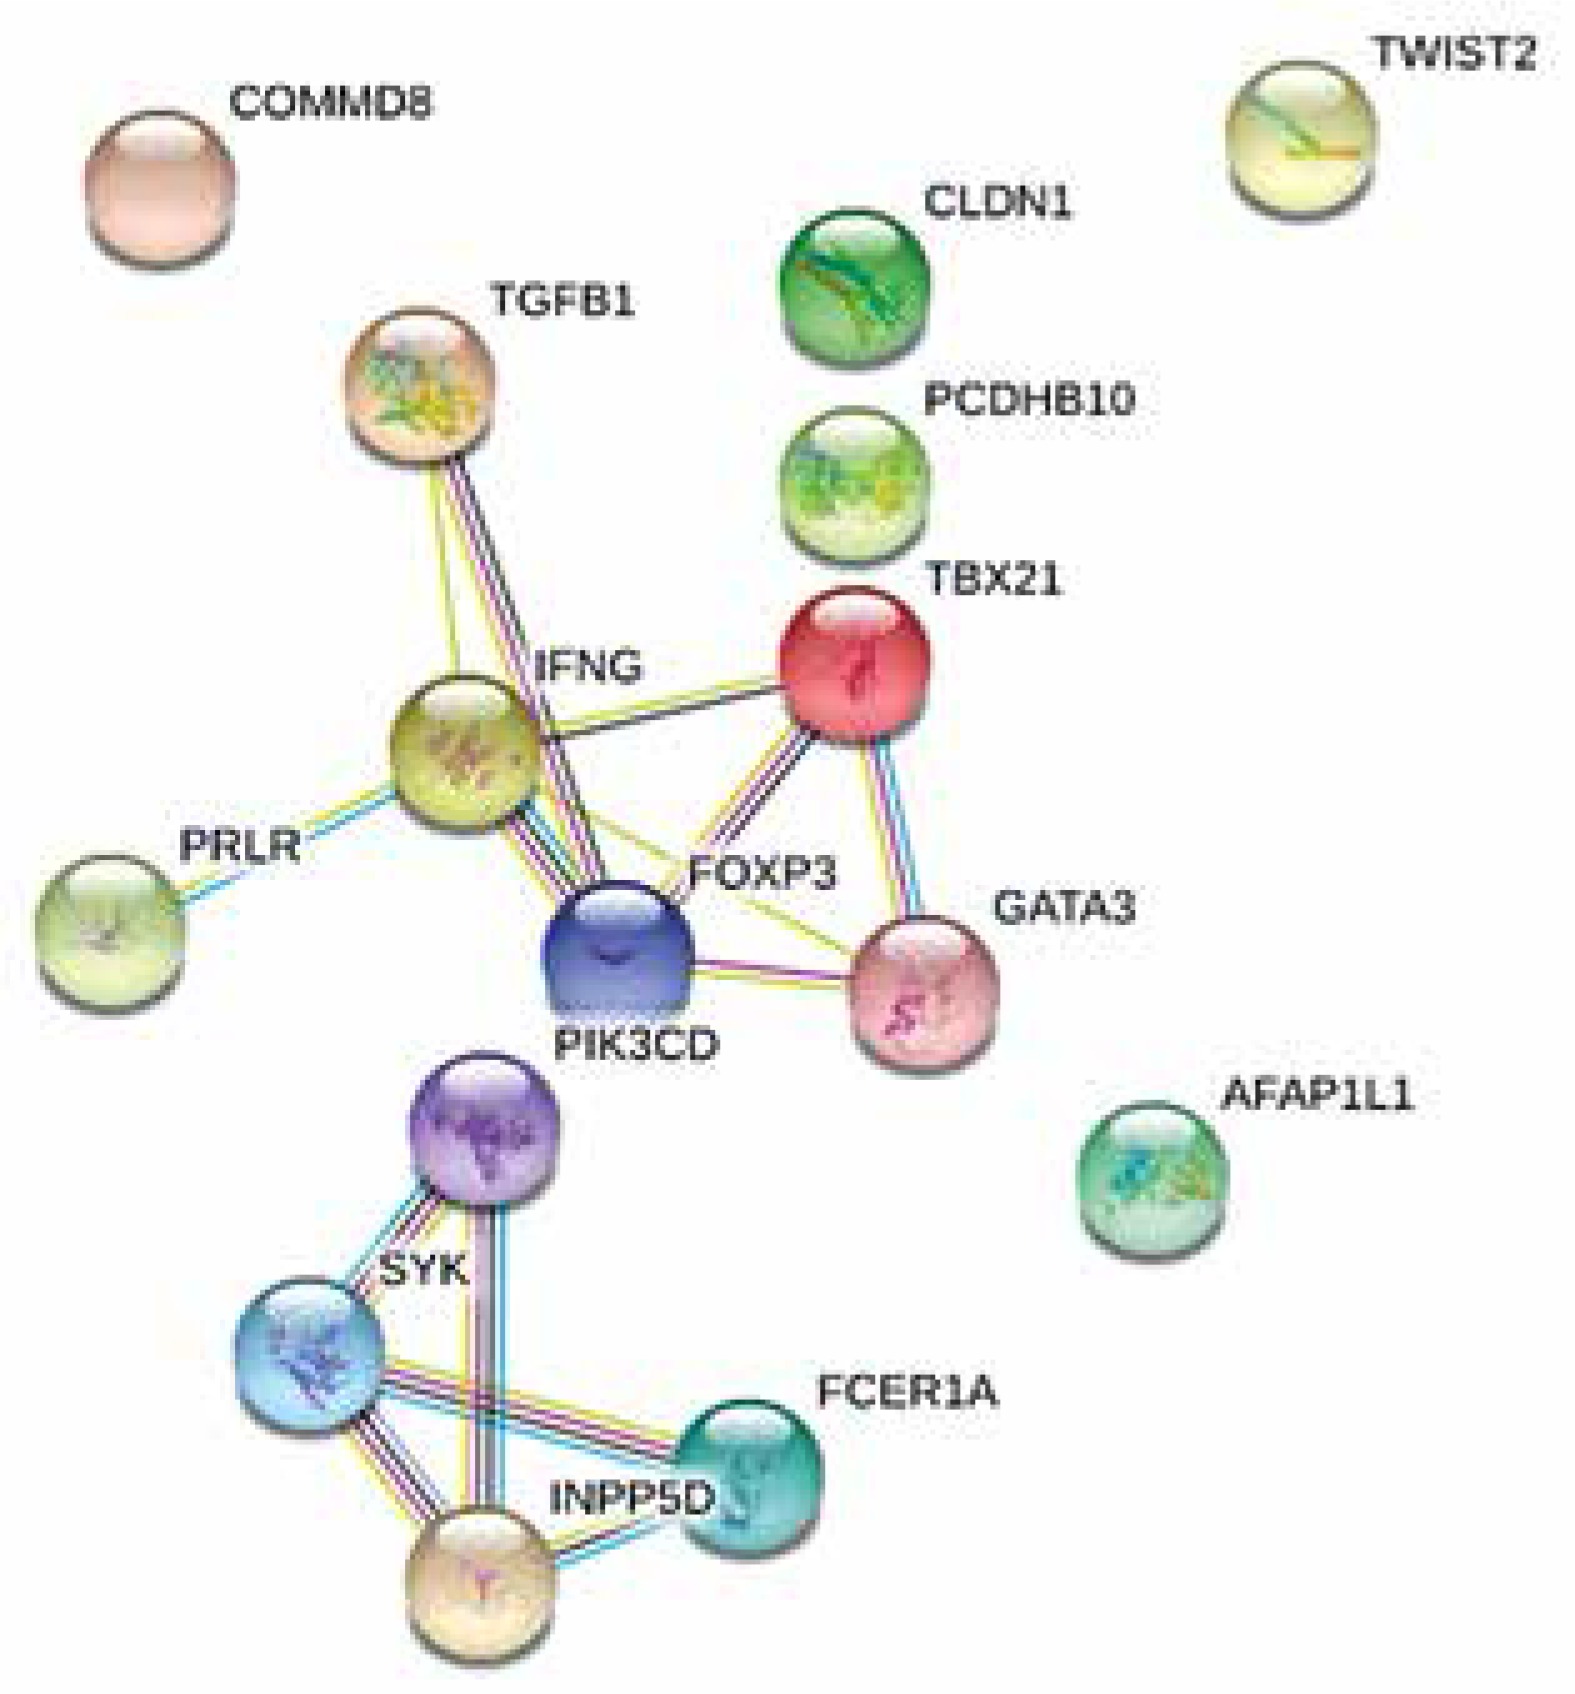
In total 18 patients had completed the two ACS assessments (4 were lost during follow-up). ACS decreased significantly during the first year of treatment from average 21.17 to 17.06 points (paired t test p = 0.0102). The final linear model predicts the 1 year change of ACS based on the expression of three genes: IFNG, FCER1A, PCDHB10 (p = 0.00785, Table 3). The algorithm properly predicted the outcome of AIT (lowering or increasing of ACS) in 16 out of 18 cases based on gene expression in sample A (89%). The comparison of observed and predicted ACS change is presented in Figure 2. Regression analysis revealed correlation between predicted and observed ACS change (Pearson’s r = 0.7484, p = 0.0004). The interaction network presented in Figure 3 (obtained from “STRING: Functional protein association networks” [31]) demonstrates our predictors, chosen as the most representative and the most informative to the problem. Note that they belong to the separate gene clusters.
Table 3
Parameters of the final linear predictive model for 1 year ACS changes: dACS = f(FCER1A, IFNG, PCDHB10) obtained for 18 observations; 14 error degrees of freedom F-statistic vs. constant model: 5.94, p-value = 0.00785
| Gene | Coefficient estimate | Standard error | tstat | P-value |
|---|---|---|---|---|
| (Intercept) | –0.5027 | 3.2511 | –0.1546 | 0.8793 |
| FCER1A | –0.2225 | 0.1209 | –1.8404 | 0.0870 |
| IFNG | 0.4460 | 0.1724 | 2.5873 | 0.0215 |
| PCDHB10 | –4.5377 | 1.1831 | –3.8355 | 0.0018 |
Discussion
The present study comprising patients receiving grass pollen AIT included expression analysis of selected 15 genes. Presented results are partially convergent with those published to date. The population of patients allergic to grass pollen was only assessed by one major study so far (with a similar method). It was conducted in 1993, included 40 patients allergic to grass pollen and showed an increase in IFNG and IL-2 expression during treatment [23]. In a similar study including 39 patients administered house dust mite AIT showed a treatment-induced increase in expression of FOXP3, SHIP and TBX21, and a decrease of GATA3, SYK and PIK3CD [21]. Other study demonstrated that several weeks of insect venom AIT resulted in a significant decrease of mastocyte receptor FCER1 [22]. A FOXP3 expression increase was also observed in a study in 18 patients receiving house dust mite AIT [25].
The above results are not fully consistent with other analyses. For example, in the double blind placebo controlled study on 89 patients administered Sublingual Immunotherapy (SLIT) there was no expression change of FOXP3, GATA3, IFNG, IL-17, IL-10, and IL-4 and there was only a transient expression increase in TBX21 and TGFB [24].
In our study, the change in IFNG was the only gene transcript showing a significant increase during treatment. TBX21 showed a medium level of effect size similar to IFNG, but p-value (0.08) close to the statistical significance.
Interferon g binding receptors, IFNGR1 and IFNGR2, activate JAK and STAT kinase pathways. This contributes to differentiation and proliferation of B cells, suppression of IgE production and switch to Th1 instead of Th2 in response to immunotherapy. This mechanism has also an impact on dendritic cell maturation [32–39]. Therefore, IFNG has a multilevel influence on the immune system. However, due to its connection with lymphocytes, its impact on desensitization may be limited.
TBX21 is a transcription factor responsible for maturation of naïve T cells towards Th1. It also enhances IFNG expression creating a synergistic loop [40, 41]. A polymorphism of TBX21 resulting in its lower expression stimulates Th2 cytokine production and aggravates asthma symptoms [42]. GATA3 is a transcription factor with an important role in Th2 cell maturation and an opposite function to TBX21. Its high expression may contribute to development of allergy [43, 44]. However in our study, the expression of GATA3 and TBX21 did not change significantly during treatment [21, 24].
In our study the comparison between patients allergic to grass pollen prior to treatment and healthy controls revealed a significantly different expression of PIK3CD, COMMD8, TWIST2 and AFAP1L1. This observation suggests resemblance of mechanisms in insect venom and grass pollen sensitization [45].
The PIK3CD gene codes delta subunit of phosphoinositide 3-kinase. These enzymes phosphorylate inositol lipids and are involved in the immune response. Their expression is usually increased in leukocytes and resembles signalling through B cell receptors. They are also postulated to play an important role in mastocyte activation [46, 47]. PIK3CD expression influences asthma and allergic rhinitis. Idelalisib, an inhibitor of p110δ subunit, is currently investigated in a clinical trial on patients with allergic rhinitis [48].
Some data indicate that COMMD8 induces release of NF-κB and enables its transcription factor function in nucleus [43–45]. NF-κB was shown to play an important role in asthma, chronic inflammation by stimulating (among others) DCs to cytokine production and modulating the IFNG influence on Th2 to Th1 T cell switch [49]. Finally, NF-κB increases Treg population and maturation – an effect demonstrated in the clinical trial including 20 children administered immunotherapy [50].
The function of TWIST2, a transcription factor, remains unknown. Its lack increases a proinflammatory response of NF-κB and decreases the function of IFNG. TWIST2 has probably also an anti-inflammatory activity and its low expression in patients may be due to allergic inflammation. Similarly to other transcription factors, its expression is low and probably susceptible to many stimuli [51, 52].
AFAP1L1, in turn, is a gene associated with intracellular transport. AFAP1 proteins are responsible for actin binding and podosome, as well as invadopodia forming, which enables cell migration and interactions with environment. AFAP1L1 expression changes may be induced by immunotherapy due to non-specific changes in the immune system activation [53, 54].
Primary hypothesis highlighted importance of T regulatory cells (Treg) in AIT, even though FOXP3, a marker of T-cell proliferation and activation did not change significantly during treatment and was not different in healthy controls. Such discrepancies have been reported earlier by other authors. However, the change of IFNG expression also contributes to Treg suppressive activity as presence of IFNG is required for their function. Still, it is unknown why a change in FOXP3 expression is inconsistent [20, 24, 55].
The assumption for the linear prediction regression algorithm was that gene expression from samples A may predict AIT outcome. With the help of the Bayesian Information Criterion, chosen genes (IFNG, FCER1A, PCDHB10) may be used in the future to predict AIT efficacy in certain patients and support decision towards continuing such long and difficult therapy as AIT. Although FCER1A, PCDHB10 by themselves did not reveal statistical significance in initial comparisons; together with IFNG managed to build an algorithm. Eighty-nine percent of successful prediction followed by confirmed correlation based on initial sample A may be promising. The authors are aware that further prospective, multi-centre validation is required for this model to enter clinical application. In specific immunotherapy similar models were introduced for patients allergic to insect venom. Niedoszytko et al. built a Naïve Bayes model with 18 genes differentiating, with 82% accuracy, patients tolerant to insect venom after treatment and those prone to anaphylaxis despite treatment. Of note, this model also included among others PCDHB10 and IFNG [45].
Unfortunately, in efficacy assessment four out of 22 patients did not complete the second ACS survey. Although their characteristics did not differ significantly from the others, still, the denial of three of them may be due to the lack of compliance or other logistic reasons. The final patient interrupting AIT prematurely shows how difficult AIT is in terms of maintenance. These dropouts support the need for early stage biomarkers that would enhance the patients’ motivation.
Conclusions
The AFAP1L1, COMMD8, PIK3CD and TWIST2 genes have a different expression in patients allergic to grass pollen compared to healthy controls. IFNG changes its expression during specific immunotherapy. A generalized linear regression algorithm based on IFNG, FCER1A, PCDHB10 expression may predict the outcome of AIT which requires prospective validation in double blind placebo controlled trials.


