
Introduction
The skin consists of 3 layers, with the outermost being the epidermis, followed by the dermis and finally subcutaneous tissue [1]. The epidermis is built up by cells, called keratinocytes, undergoing a continuous process of proliferation and differentiation [2–4]. The mesenchymal cells of the dermis proper, as well as elements of the immune system supplied with blood to the various layers of the epidermis, are responsible for regulating the aforementioned processes [2–5]. Other signals regulating the process of proliferation and differentiation of keratinocytes are antigens of microorganisms and mechanical factors causing damage to the outer layers of the skin [2–4]. In addition, induced epidermal cells secrete growth factors and numerous cytokines, as well as adhesion molecules and antibodies [2–4].
In psoriasis, we observe an excessive, approximately 8-fold accelerated proliferation of keratinocytes [6]. The pathomorphological picture of a section of psoriasis-affected skin is characterized by thickening of the epidermis, elongation of epidermal icicles, parakeratosis of the stratum corneum, atrophy of the stratum granulosum, hypertrophy of the stratum spinosum, dilatation of dermal papillary capillaries, and focal accumulation of neutrophil granulocytes (Munro’s microabscesses) [7, 8].
Psoriasis is classified as an autoimmune disease in which there is an abnormal functioning of the immune system and abnormal secretion of cytokines, chemokines, and growth factors, which translates into disturbances in molecular signalling pathways [9, 10]. Activation of the IL-12/Th1/IFN-g axis and Th17/IL-23 plays a key role [11]. In the group of cytokines, proteins called interleukins should be distinguished. They are signalling molecules in hematopoietic reactions and immune system responses. Currently, cytokines are divided into 7 groups. Class I is divided sequentially according to the receptor subunit. Thus, the second group of class I cytokines is the IL-12 family, which includes IL-12, IL-23, IL-27, IL-35, and IL-39, which form soluble heterodimers composed of an α subunit and a b subunit linked by a disulfide bond. Human interleukin 12 is formed by IL-12p35 and IL-12p40, while interleukin 23 is formed by IL-23p19 and IL-12p40. The function of IL-12 is to stimulate NK cells, monocytes, and macrophages, as well as to stimulate interferon production, while the function of IL-23 is to regulate the cellular response mechanisms that determine the inflammatory response [12, 13].
In in vitro models, bacterial lipopolysaccharide (LPS) [14], a building block of the outer cell membrane of the bacterial envelope, is used to induce inflammation. It is found in cyanobacteria and Gram-negative bacteria, constituting an essential element of their life processes, which determines their pathogenicity. Thanks to the recognition of LPS by macrophages, an inflammatory reaction is induced in the infected organism. This is mediated by the cell membrane protein CD14 and the TLR4 receptor, which, when activated by lipopolysaccharide, activates signalling pathways responsible for the production of, among other things, pro-inflammatory cytokines [15, 16].
Patients with confirmed moderate-to-severe plaque psoriasis (PASI > 10, BSA > 10, DLQI > 10) who are characterized by poor tolerance or ineffectiveness of previously used systemic treatment at the maximum recommended doses, for the maximum recommended time, are eligible for biologic therapy [17, 18]. A biologic drug used successfully in the treatment of inflammatory and autoimmune diseases is adalimumab [17, 18]. It is a recombinant human monoclonal antibody that, by blocking the p55 and p75 receptors for tumor necrosis factor (TNF-a) on the cell surface, inhibits its activity. In addition, it affects leukocyte migration [19, 20].
Aim
Therefore, the current study aimed to determine the expression pattern of mRNAs and miRNAs related to the IL-12/23 signalling pathways in human keratinocyte culture exposed to liposaccharide A (LPS) and then adalimumab in comparison with the untreated cells.
Material and methods
HaCaT cell culture
Human, adult, low-Calcium, high-Temperature keratinocytes (HaCaT; CLS; Cell Lines Service, Eppelheim, Germany) were cultured in Dulbecco’s modified Eagle’s medium (Sigma-Aldrich, St. Louis, MO, USA), which was supplemented with 4500 mg/l glucose (Sigma-Aldrich), 10% foetal bovine serum (Sigma-Aldrich), 100 U/ml penicillin (Sigma-Aldrich), 100 mg/ml streptomycin (Sigma-Aldrich), and 2 mM glutamine (Sigma-Aldrich) at 37°C and 5% CO2. Keratinocytes were first exposed to 1 µg/ml LPS for 8 h and then to 8 µg/ml adalimumab for 2 (H_2), 8 (H_8), or 24 h (H_24). We selected the concentration of LPS based on our previous work [21, 22], and the concentration of adalimumab correlates with the average serum concentration of this drug in patients with psoriasis treated with it [21, 22]. The number of cells and their viability were determined via counting them in a Bürker chamber after staining them with 0.2% trypan blue (Biological Industries, Beit HaEmek, Israel). Evaluation of the cytotoxicity of the compounds we used is presented in previous work [21, 22].
RNA extraction
Total ribonucleic acid (RNA) was extracted using the modified Chomczynski-Sacchi method and TRIzol reagent (Invitrogen Life Technologies, Carlsbad, CA, USA), according to the manufacturer’s recommendation, and then purified using a RNeasy mini kit (QIAGEN, Hilden, Germany) and DNase I (Fermentas International Inc., Burlington, Canada). RNA extracts were both qualitatively and quantitatively evaluated before being qualified for molecular analysis.
Microarray profile of IL-12/23 signalling path–related genes
An HG-U 133_A2 microarray (Affymetrix, Santa Clara, CA, USA) and a GeneChip™ 3 IVT PLUS reagent kit (Affymetrix, Santa Clara, CA, USA) were used to determine changes in the expression patterns of genes associated with IL-12- and IL-23-dependent signalling pathways in HaCaT cultures exposed to LPS and anti-TNF-a drug compared to control cultures, according to the manufacturer’s recommendation and our previous experience [21, 23]. Of the 22,277 mRNA probes present on the microarray plate, 149 were associated with IL-12/23 signalling pathways. The names of probes associated with the cascades analysed were selected in the Affymetrix NetAffx Analysis Center database after typing the query “IL-12/23 signalling pathways” (http://www.affymetrix.com/analysis/index.affx; accessed 27/10/2022). Fluorescence intensity was examined using an Affymetrix Gene Array Scanner 3000 7 G and Gene Chip® Command Console® software (Affymetrix).
Microarray profiles of IL-12/23 signalling path-related gene miRNAs and their potential influence on the expression of analysed genes
MiRNAs associated with the IL-12/23 pathways were selected using the commercially available GeneChip miRNA 2.0 Array (Affymetrix) according to the manufacturer’s instructions. In turn, predictive assessments of the effect of the selected miRNAs on the indicated mRNAs were determined using the miRDB bioinformatics tool (http://mirdb.org/; accessed on 10 October 2022). The publisher of the miRDB database states: “This is an online database for miRNA target prediction and functional annotations. All the targets in miRDB were predicted by a bioinformatics tool, MirTarget, which was developed by analysing thousands of miRNA-target interactions from high-throughput sequencing experiments. Common features associated with miRNA binding and target downregulation have been identified and used to predict miRNA targets with machine learning methods” [24].
Quantitative reverse transcription polymerase chain reaction (qRT-PCR) analysis
Next, quantitative real-time reverse transcription-precursor polymerase chain reaction (RTqPCR) was performed for selected mRNAs differentiating LPS-exposed and drug-exposed cultures from controls. For this purpose, a SensiFast SYBR No-ROX One-Step Kit (Bioline, London, UK) was used, according to the manufacturer’s protocol. Changes in the gene expression profile were presented using the 2-∆∆Ct method. The thermal profile of the reaction was as follows: reverse transcription (45°C for 10 min); polymerase activation (95°C for 2 min); 40 cycles including denaturation (95°C for 5 s); annealing (60°C for 10 s); elongation (72°C for 5 s). The primer sequence of selected mRNAs was examined by RTqPCR and is shown in Table 1. b-Actin (ACTB) was used as an endogenous reaction control.
Table 1
Nucleotide sequence of primers used in RTqPCR reaction
[i] STAT1 – signal transducer and activator of transcription 1, STAT3 – signal transducer and activator of transcription 3, STAT5 – signal transducer and activator of transcription 5, IL-6 – interleukin 6, IL-6R – interleukin 6 receptor, SOCS3 – suppressor of cytokine signalling 3, JAK3 – Janus kinase 3
Enzyme-linked reaction
Next, the expression of JAK3, SOCS3, and STAT5 at the protein level was comparatively analysed between drug-treated and control HaCaT cells using enzyme-linked immunosorbent assay (ELISA) according to the manufacturer’s protocol.
The following ELISA kits were used in this study: JAK3 Elisa kit: Human Tyrosine-protein kinase JAK3 ELISA Kit (MyBioSource, Inc., San Diego, CA, USA); Suppressors Of Cytokine Signaling 3 (SOCS3; MyBioSource) ELISA Kit; signal transducer and activator of transcription 5 (STAT5) ELISA Kit (MyBioSource).
Statistical analysis
Statistical analyses were performed using the licensed versions of Statistica 13.0 PL (StatSoft, Cracow, Poland) and the Transcriptome Analysis Console (Affymetrix) programs. The normality of the data distribution was examined using the Shapiro-Wilk test (p < 0.05). The means between groups were analysed using analysis of variance (ANOVA), followed by Tukey’s post-hoc test (p < 0.05).
Results
Microarray profile of IL-12/23-related genes in LPS-stimulated HaCaT cells treated with adalimumab
Among the 22,283 mRNAs present on HGU-133A_2 microarrays, we selected 149 mRNAs associated with IL-12/23 signalling pathways. As a first step, we performed an ANOVA with Benjamini-Hochberg correction. Based on this test, we observed that of the 149 mRNAs, 23 mRNAs differentiated LPS-exposed cultures compared to control cultures, and 65 mRNAs were differentially expressed in HaCaT cultures treated with LPS and adalimumab compared to controls. In the next step, a Tukey post-hoc assay was performed. We observed that as the incubation time of keratinocytes on LPS and drug increased, the number of differentiating mRNAs decreased (H_2 vs. C = 49 mRNAs; H_8 vs. C = 21 mRNAs; H_24 vs. C = 14 mRNAs). In contrast, genes STAT1, STAT3, STAT5, IL-6, IL-6R, SOCS3, and JAK3 differentiated the HaCaT culture with the drug from the control regardless of the time the cells were exposed to the drug (Figure 1). Table 2 shows the differential gene expression changes of keratinocyte cultures incubated with and/or without LPS and/or adalimumab regardless of drug exposure time compared to the control culture.
Figure 1
Venn diagram
STAT1 – signal transducer and activator of transcription 1, STAT3 – signal transducer and activator of transcription 3, STAT5 – signal transducer and activator of transcription 5, IL-6 – interleukin 6, IL-6R – interleukin 6 receptor, SOCS3 – suppressor of cytokine signalling 3, JAK3 – Janus kinase 3.
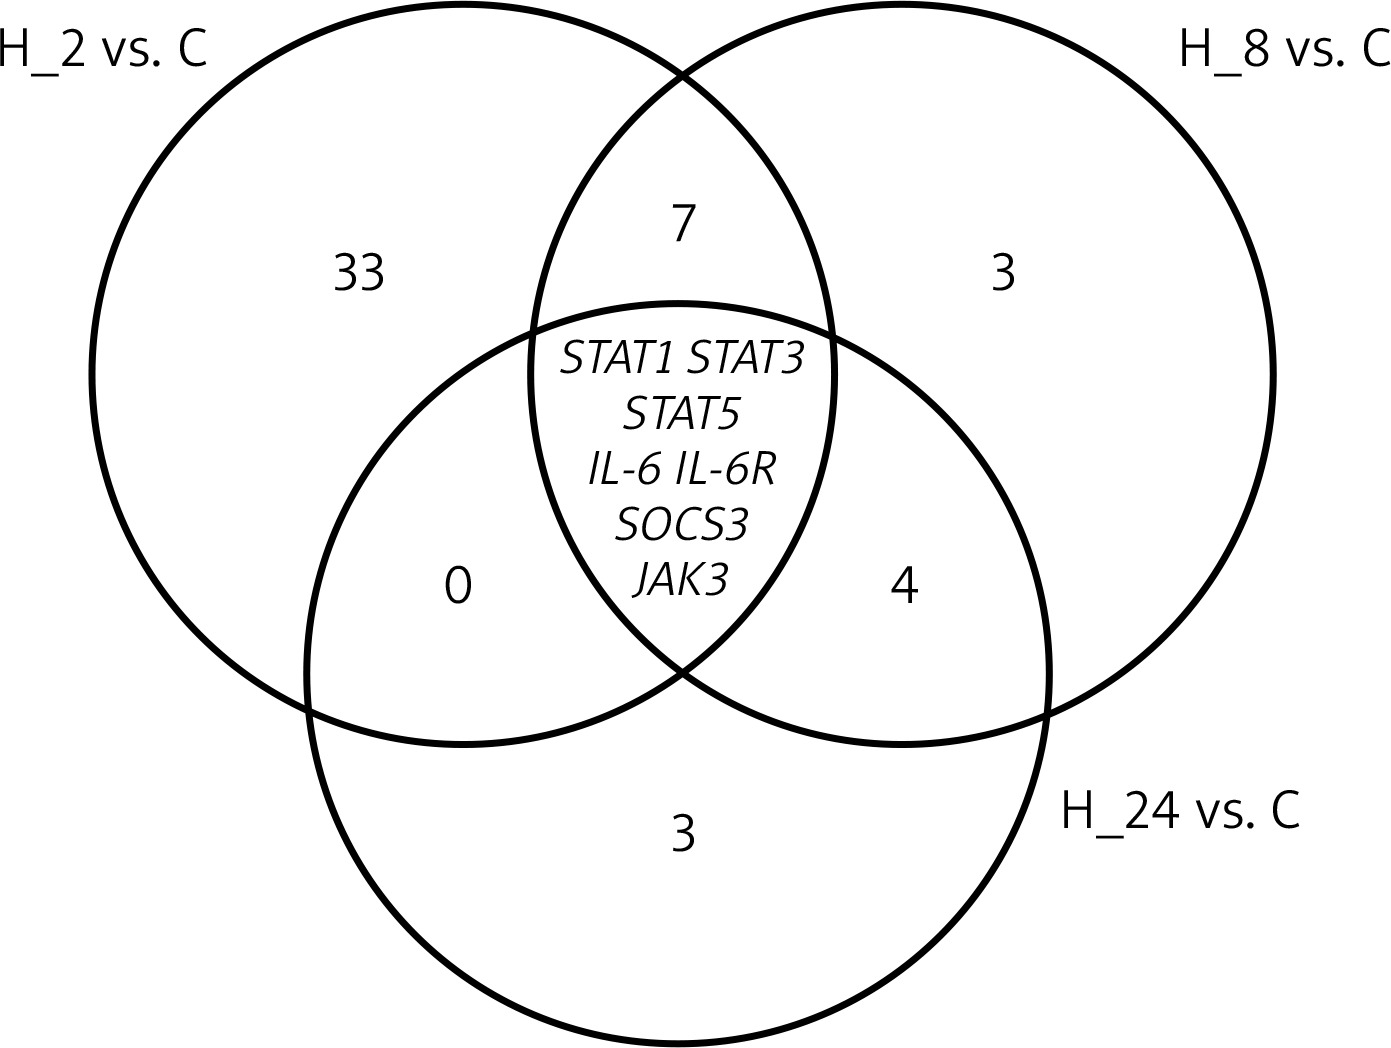
Table 2
Changes in the expression profiles of genes differentiating keratinocyte cultures exposed to LPS and adalimumab compared to controls (p < 0.05)
[i] (+) – overexpression in comparison to the control, (–) – downregulated in comparison to the control, STAT1 – signal transducer and activator of transcription 1, STAT3 – signal transducer and activator of transcription 3, STAT5 – signal transducer and activator of transcription 5, IL-6 – interleukin 6, IL-6R – interleukin 6 receptor, SOCS3 – suppressor of cytokine signalling 3, JAK3 – Janus kinase 3, H_2, H_8, H_24 – time of exposure of keratinocytes to LPS or adalimumab.
RTqPCR analysis of IL-12/23-related genes in LPS-stimulated HaCaT cells treated with adalimumab
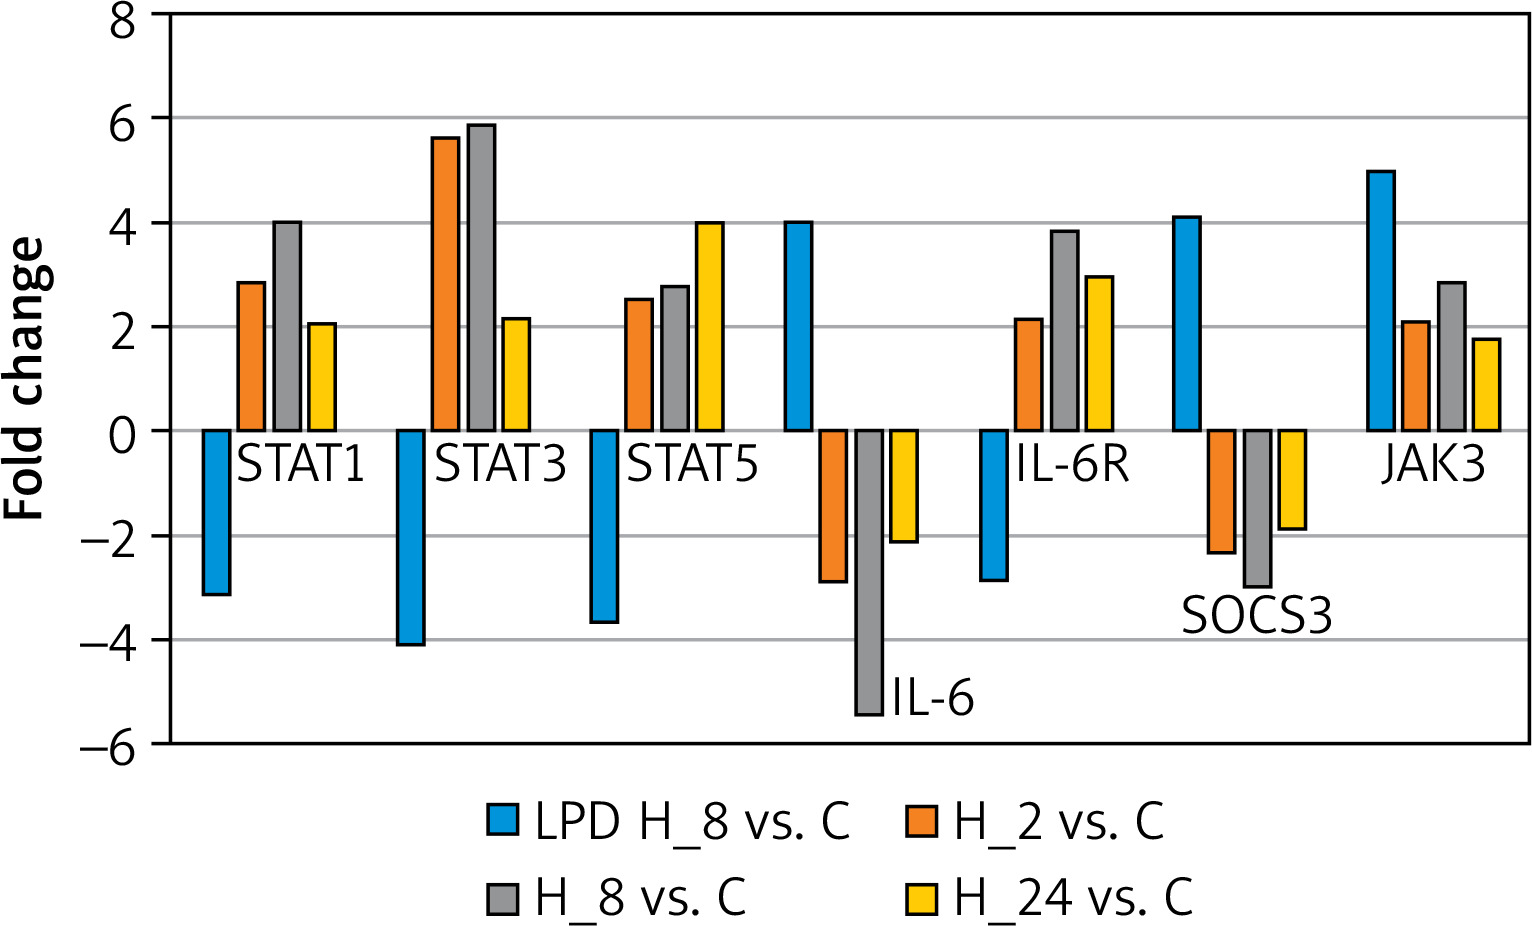
In the next step, we conducted a validation of the microarray experiment. Based on the results of changes in the expression patterns of selected genes determined by RTqPCR, the same direction of expression changes as in the microarray experiment was noted. Exposure of keratinocytes to LPS resulted in decreases in the transcriptional activity of STAT1, STAT3, STAT5, and IL-6R and increases in the expression of IL-6, SOCS3, and JAK3 compared to controls. In contrast, the addition of adalimumab to a culture previously exposed to LPS resulted in the silencing of SOCS3 and IL-6 expression compared to the control, while for the other transcripts they were found to be overexpressed compared to the control culture (Figure 2).
Figure 2
Expression profiles of genes differentiating keratinocyte cultures with LPS and adalimumab independently of the time of exposure of cells to the drug determined by the RTqPCR technique
STAT1 – signal transducer and activator of transcription 1, STAT3 – signal transducer and activator of transcription 3, STAT5 – signal transducer and activator of transcription 5, IL-6 – interleukin 6, IL-6R – interleukin 6 receptor, SOCS3 – suppressor of cytokine signalling 3, JAK3 – Janus kinase 3.
Expression profiles of miRNAs that regulate the expression of differentially expressed genes of LPS-stimulated/drug-treated cells versus control cells
We indicated miRNAs that could be engaged in the regulation of STAT1, STAT3, STAT5, IL-6, IL-6R, SOCS3, and JAK3, assuming that the value of the predicted target had a prediction score > 80, as recommended [24]. The assessment indicated the strongest connections between JAK3 and hsa-miR-373-5p (target score 96); SOCS3, STAT5, and hsa-miR-1827 (target score 96). Table 3 shows the changes in the expression profiles of hsa-miR-373-5p and hsa-miR-1827.
Table 3
Changes in expression profiles of hsa-miR-373-5p and hsa-miR-1827 in keratinocyte cultures exposed to LPS and adalimumab compared to controls (p < 0.05)
Effect of adalimumab on the expression levels of JAK3, STAT5, and SOCS3 in LPS-stimulated HaCaT cells
As a final step, we evaluated the changes in the levels of JAK3, STAT5, and SOCS3 in HaCaT cultures exposed to LPS and adalimumab compared to controls. The addition of LPS and adalimumab resulted in a decrease in the concentrations of the evaluated proteins compared to the control (Table 4; p < 0.05).
Table 4
Concentrations of JAK3, STAT5, and SOCS3 in HaCaT cell culture exposed to LPS and adalimumab
Discussion
The rationale for the study presented in this paper was the loss of adequate response to molecularly targeted therapy, including adalimumab, prompting the search for new complementary molecular markers of early drug resistance [25, 26]. The inclusion of molecular systems in diagnostics is important because molecular changes precede phenotypic changes [25, 26]. In our previous paper, we noted that adalimumab significantly altered the gene expression profiles of IL-12/23 signalling pathways in skin fibroblasts and whole blood obtained from psoriasis patients treated with the drug [27].
The determined microarray expression profile of genes related to IL-12/23 signalling pathways indicated that induction of inflammation and addition of adalimumab to HaCaT cultures significantly altered the expression of genes related to the JAK/STAT cascade, as well as IL-6. We noted that mRNA STAT1, STAT3, STAT5, JAK3, and IL-6R were overexpressed in the cell culture with the drug, and the expression levels of IL-6 and SOCS3 were reduced when adalimumab was added to the culture.
IL-6 is categorized as a pro-inflammatory cytokine that, through interaction with the receptor complex, which consists of the non-signalling α subunit of IL-6R and the b subunit of gp130, causes activation of JAK1/JAK2 and TYK2, and through this exerts a modulating effect on the JAK/STAT and MAPK cascades [28]. Ongoing observations confirm the involvement of IL-6 in the pathogenesis of psoriasis, with elevated IL-6 levels in the serum of patients with psoriasis indicating the severity of the disease, as well as its being a sensitive marker of response to treatment with TNF-a inhibitors [29]. IL-6 inhibitors are a promising group of biologic drugs used in the treatment of psoriatic arthritis [30]. Mease et al. evaluated the efficacy of clazakizumab (a monoclonal antibody against IL-6) in a group of 165 patients with psoriasis vulgaris, noting a modest relief of joint symptoms, with a concomitant lack of effect or exacerbation of skin symptoms [31]. According to Fritz et al., this unfavourable aspect of anti-IL-6 therapy for psoriasis vulgaris is the result of excessive, uncontrolled synthesis of other pro-inflammatory cytokines in response to the inhibition of transmission along the IL-6 pathway [32]. This may partly explain the overexpression of genes STAT1, STAT3, STAT5, and JAK3 in the cell culture under adalimumab exposure [32] and confirms the “vicious circle” hypothesis of self-perpetuating inflammation [33], although at the protein level, STAT5 and JAK3 levels were significantly lower in the drug-exposed culture compared to the control culture. This appears to be due to the regulatory effect of miRNAs on the expression profile of the aforementioned genes [27].
Nevertheless, Biesemann et al. demonstrated in an in vitro model of rheumatoid arthritis that IL-6 and TNF-a have synergistic effects, and that the simultaneous use of anti-IL-6 and anti-TNF-a inhibitors results in a longer quieting of the inflammatory process than when these inhibitors are used separately [34]. Concurrent silencing of IL-6 expression is accompanied by overexpression of IL-6R. Simondurairaj et al. reported an increase in IL-6R expression in gastric cancer, indicating that IL-6R may be both a therapeutic target and a prognostic marker of gastric cancer [35]. Overexpression of both IL-6 and IL-6R has been observed in patients with psoriasis [36, 37]. It is therefore possible that blocking the action of TNF-a by adalimumab affects only the expression of IL-6, not its receptor IL-6R.
Walker et al. determined changes in the expression profiles of JAK3, STAT1, and STAT4 in synoviocytes from patients with rheumatoid arthritis, inflammatory spondyloarthropathy, and arthrosis, noting overexpression of all 3 of these proteins compared to synoviocytes from healthy volunteers (control) [38]. Ivashkiv et al. emphasized that genes encoding proteins of the IL-12/23-dependent JAK/STAT signalling pathway play an anti- or pro-inflammatory role depending on the biological context, cell type, and microenvironment [39]. Thus, the overexpression of STAT1, STAT3, STAT5, and JAK3 that we observed may be due to the choice of the study model as well as to the decrease in IL-6 expression [32]. Also, Aerts et al. found overexpression of STAT4 and STAT6 in adalimumab-treated patients during 12 weeks of follow-up. They suggested that the noted expression pattern is due to the response of immune cells to anti-TNF-a immunosuppressive therapy [40]. Therefore, the overexpression of selected STAT family proteins we observed in cultured keratinocytes with induced inflammation after the addition of adalimumab to the culture indicates that the IL-12/23-dependent JAK/STAT signalling pathway is also stimulated in keratinocytes and activates adaptive mechanisms in response to the drug.
In the next stage of our study, we made a predictive assessment of the effect of miRNA molecules on the expression of the selected mRNA transcripts based on the target score value. The analysis showed that 2 miRNA molecules, i.e. hsa-miR-373-5p and hsa-miR-1827, were most likely to affect the expression profiles of JAK3, SOCS3, and STAT5. Tan et al. in their study confirmed the involvement of hsa-miR-373-5p as an important modulator of the expression of the gene encoding beta-lactamase-like (LACTB) [41], whose changes in expression pattern may be a complementary molecular marker in predicting hepatocellular carcinoma progression [42]. Further, Jing et al. showed that reduced transcriptional activity of hsa-miR-373-5p in glioma patients was an unfavourable prognostic marker of metastasis [43].
Interestingly, overexpression of hsa-miR-373-5p has been noted in tongue and esophageal squamous cell carcinoma, and the biological effect of the mentioned miRNA molecule was to promote the growth of tumour cells [44, 45]. This indicates that the duality of action of the hsa-miR-373-5p molecule depends on the biological context [43–46]. In contrast, in our study, we noted an increase in hsa-miR-373-5p expression under conditions of induced inflammation, as well as after adalimumab was added to keratinocyte cultures, with hsa-miR-373-5p expression higher in the drug-exposed than in the LPS-exposed culture. Thus, the pattern of hsa-miR-373-5p expression found may be due to the immunosuppressive effect of the TNF-a inhibitor and indicates a higher risk of cancerous lesions in patients during adalimumab therapy [21, 47–49]. Also, the evaluation of the expression pattern of the second miRNA, i.e. hsa-miR-1827, differentiating drug-exposed cultures from control cultures is widely discussed in the context of the tumorigenesis process [50, 51].
The final step of our study was to determine changes in the profiles of JAK3, SOCS3, and STAT5 protein concentrations in HaCaT cultures exposed to LPS, and adalimumab, and in control cultures. We observed reductions in JAK3, SOCS3, and STAT5 protein levels both under induced inflammatory conditions and after the cells were exposed to the anti-TNF-a drug. Thus, the opposing pattern of JAK3, SOCS3, and STAT5 expression at the mRNA and protein levels may be the result of post-transcriptional regulation of gene expression by miRNAs molecules. It should be kept in mind that there is no full complementarity between the selected mRNAs and miRNAs, resulting in decreased expression at the protein level, rather than complete degradation of the mRNA transcript, which would prevent the formation of a protein product.
Conclusions
Thus, our study indicates that adalimumab exerts the strongest modulating effect on mRNA and miRNA expression of JAK/STAT and IL-6-dependent IL-12/23 pathways. Under the influence of adalimumab, we noted overexpression of STAT1, STAT3, STAT5, JAK3, and IL-6 at the mRNA level, with a concomitant decrease in SOCS3 and IL-6R expression levels. The assessment indicated the strongest connections between JAK3 and hsa-miR-373-5p (target score 96); SOCS3, STAT5, and hsa-miR-1827 (target score 96).


