
Introduction
Psoriasis is a chronic, inflammatory skin disease associated with many cardiometabolic comorbidities, which are components of a metabolic syndrome (MetS). Its prevalence is 2–3% of the population worldwide [1, 2]. Psoriasis is closely related to components of metabolic syndrome, such as obesity, dyslipidaemia, type 2 diabetes, and arterial hypertension [3]. For this reason, psoriatic patients are characterized by increased mortality due to cardiovascular complications compared to healthy people. It is believed that chronic, low-grade inflammatory status with increased production of pro-inflammatory cytokines is the background responsible for metabolic dysregulation and higher cardiovascular disease (CVD) risk in this skin disorder [3–5].
Nonalcoholic fatty liver disease (NAFLD) is the most common cause of chronic liver disease in Western countries, and its comorbidity is closely associated with obesity. Recently NAFLD has been predominantly regarded as a hepatic manifestation of metabolic syndrome, which can lead to many severe liver complications, such as fibrosis, cirrhosis, and even hepatic cellular carcinoma [6–8].
Many recent studies have confirmed the association between psoriasis and NAFLD. Both disorders are closely related to metabolic syndrome, and their background is associated with chronic inflammatory status [9, 10]. Although the pathogenesis of both NAFLD and psoriasis seems to be multifactorial, the exact connection between these 2 diseases has not been fully explained. Recent studies have shown a higher prevalence of NAFLD among psoriatic patients than in the overall population, and its morbidity may affect as much as 50% of all psoriatic cases [11, 12]. Furthermore, psoriatic patients more often develop advanced forms of NAFLD than healthy people [13, 14]. In the case of psoriatic arthritis development the risk may be even higher [15]. Patients with confirmed NAFLD have more severe course of skin lesions in comparison with psoriatic patients without comorbidities [9]. In addition, it has been demonstrated that psoriatic patients with diagnosed NAFLD are more likely to have MetS than those with psoriasis alone. This group also tended to have higher frequency of abnormal liver function test (LFT) results and higher levels of serum lipids (cholesterol, TAG, and LDL) [15].
Histological features of NAFLD consist of a wide spectrum of liver conditions ranging from mild steatosis, through nonalcoholic steatohepatosis, to advanced fibrosis and cirrhosis. Lipid accumulation in the liver, in particular free fatty acids (FFA), leads to lipotoxicity and consequently to mitochondrial dysfunction, oxidative stress, and activation of inflammatory pathways, which represent further liver damage [9, 11, 16]. Circulating ceramides in serum, the level of which is decreased in psoriasis, also take part in the development of metabolic syndrome. They interact with several pathways involved in oxidative stress, inflammation, apoptosis, and insulin resistance, which are closely linked to NAFLD [17, 18].
We have observed in our recent studies numerous abnormalities of circulating fatty acids and sphingolipids in psoriatic patients [19, 20]. These parameters might be a link between psoriasis and possible development of NAFLD in psoriatic patients, or at least they might act as an indicators of liver damage assessed by elevating liver enzymes.
Aim
The aim of our study was to assess the concentration of the circulating fatty acids and ceramides in correlation with the alanine aminotransferase (ALT) blood level in psoriatic patients. In addition, we have examined the relationship between ALT concentration and the severity of the disease and inflammation markers.
Material and methods
Eighty-five individuals with plaque-type psoriasis and 32 sex- and age-matched healthy controls participated in the study; 28 of them were women and 57 were men. The median age of patients was 53 (from 19 to 79 years). The severity of psoriasis was estimated using the Psoriasis Area and Severity Index (PASI).
Body mass index (BMI) was evaluated as weight/height2 (kg/m2). Overweight was defined as BMI ≥ 25 kg/m2 and obesity as BMI ≥ 30 kg/m2. None of the patients and controls had any dietary restrictions. Alcohol addiction was an exclusion criterion. All patients enrolled in the study were treated with topical ointment (dithranol, vaselin with salicylic acid).
The history of comorbidities (such as type 2 diabetes, arterial hypertension, weight abnormalities) as well as the results of the laboratory tests were collected from hospital records of the patients hospitalized at the Dermatology and Venereology Department of the Medical University. All biochemical analyses, including morphology, C-reactive protein (CRP), serum fasting blood glucose (FBG), total cholesterol, triacylglycerols (TAG), and ALT, were carried out in the Central Laboratory of the University Hospital Centre. According to the laboratory, the correct level of ALT concentration is in the range 0–41 IU/l. All patients and controls gave their written informed consent before the enrolment. The study was approved by the local bioethical committee (R-I-002/457/2016).
Peripheral blood samples were taken before starting the treatment from patients and from the control group. After centrifugation, the serum was stored at –80ºC until analyses.
Total serum fatty acid content and composition was measured according to the method of Glaser et al. [21]. Briefly, 100 µl of serum was incubated at 85°C for 45 min in 1.5 ml of 3 N methanolic HCl containing 2 g/l BHT (2,6-di-tert-butyl-p-cresol, antioxidant). Prior to incubation, 100 µl of internal standard mixture (heptadecanoic acid/cholesteryl-heptadecanoate/triheptadecanoate/diheptadecanoate/diheptadecanoyl-phosphatidylcholine; 0.2/2/1.5/0.2/2 per weight, 10 µg of C17 : 0 total, in chloroform/methanol solution; 2 : 1, by vol) was added to account for methylation and extraction losses. After cooling to room temperature, fatty acids methyl esters were extracted with 0.5 ml hexane, followed by 30 s of vortexing and centrifugation (5 min/3000 g). The volume of the upper organic phase was transferred into new glass vials then dried under nitrogen flow, and lipids were dissolved in 50 µl of hexane. Thereafter, samples were analysed by gas-liquid chromatography using a Hewlett-Packard 5890 Series II gas chromatograph, an Agilent J&W CP-Sil 88 capillary column (50 m × 0.25 mm ID), and a flame-ionization detector. The oven temperature was programmed from 130°C to 220°C at 5°C/min and held at 220°C for 32 min. Argon was used as a carrier gas. The following fatty acid species were identified and quantified according to the respective retention times of synthetic standards: myristic (14:0), almitic (16:0), palmitoleic (16:1n-7), stearic (18:0), oleic (18:1n-9), linoleic (18:2n-6), α-linolenic (18:3n-3), arachidic (20:0), arachidonic (20:4n-6), eicosapentaenoic (20:5n-3), behenic (22:0), docosahexaenoic (22:6n-3), lignoceric (24:0), and nervonic (24:1n-9) acids. The FA were additionally grouped according to their biologic properties. The percentage of saturated FA-SFA (myristic acid, palmitic acid, stearic acid, arachidic acid, behenic acid, lignoceric acid) was measured and calculated. Unsaturated fatty acids (UFA) were divided into monounsaturated FA-MUFA (palmitoleic acid, oleic acid, nervonic acid) and polyunsaturated FA-PUFA (n-3 PUFA: α-linolenic acid, eicosapentaenoic acid (EPA), docosahexaenoic acid (DHA), and n-6 PUFA: linoleic acid, arachidonic acid).
To measure sphingosine-1-phosphate (S1P), the serum samples were mixed with a solution composed of 25 mM HCl and 1M NaCl and acidified with methanol. Internal standards of C17-sphingosine and C17-sphingosine 1-phosphate were added. Lipids were extracted by means of chloroform, 1 M NaCl and 3 N NaOH. The aqueous phase containing S1P was transferred to a fresh tube and the compound was dephosphorylated with the use of alkaline phosphatase (bovine intestinal mucosa). Free sphingosine was converted to its O-phthalaldehyde derivatives and analysed by means of a high-performance liquid chromatography (HPLC) system equipped with a fluorescence detector and C18 reversed-phase column (Varian Inc., OmniSpher 5, 4.6 × 150 mm).
To quantify ceramides (Cer), a small volume of the chloroform phase containing lipids was transferred to a tube containing N-palmitoyl-D-erythro-sphingosine (C17 base) as an internal standard. The lipid fractions were separated by thin-layer chromatography silica plates (Kieselgel 60, 0.22 mm, Merck, Darmstadt, Germany) with a heptane/isopropyl ether/acetic acid (60 : 40 : 3, by vol) resolving solution. Lipid bands were visualized by spraying with a 0.2% solution of 3’7’-dichlorofluorescin in methanol and identified under ultraviolet light using standards on the plates. The gel bands were scraped off the plate, transferred into screw tubes, and transmethylated with BF3/methanol. The fatty acid methyl esters were dissolved in hexane and analysed by gas-liquid chromatography. A Hewlett-Packard 5890 Series II gas chromatograph with Varian CP-SIL capillary column (50 m × 0.25 mm ID) and flame-ionization detector (Agilent Technologies, Santa Clara, CA) was used. Injector and detector temperatures were set at 250°C. The oven temperature was increased linearly from 160°C to 225°C at a rate of 5°C/min. According to the retention times of standards, the individual long-chain fatty acids were quantified. Total content of Cer was estimated as the sum of the particular fatty acid species of the assessed fraction, and it was expressed in nanomoles per millilitre of the serum.
Statistical analysis
The data analyses were carried out using Statistica 12.0 software. We examined the distribution of each continuous variable using the Shapiro-Wilk test. We did not find a normal distribution of the analysed variables. Data are presented as median and quartiles (first and third quartile) and percentage when appropriate. The statistical analyses were performed using the Kruskal-Wallis and Mann-Whitney tests. We calculated the Spearman rank correlation coefficients to measure the relationships. Results on the level p < 0.05 were regarded as significant.
Results
Eighty-five patients (27 females and 57 males) with exacerbated plaque-type psoriasis and 32 healthy controls were enrolled in the study. The age of patients ranged from 19 to 79 years (mean: 49.7 ±14.4 years). The mean duration of the disease was 18.5 ±14.4 months (from 1 to 58 months). In the examined group 58.8% of patients (n = 50) had mild psoriasis, 25.8% of them (n = 22) had moderate psoriasis, and 15.3% (n = 13) of all studied patients were diagnosed as having a severe form of the disease. Among studied groups we observed lipid abnormalities: 16 (18.8%) patients had hypercholesterolaemia (> 200 mg/dl) and 15 (17.6%) had hypertriglyceridaemia (> 160 mg/dl). Selected demographic, clinical, and laboratory patient data are presented in Table 1.
Table 1
Clinical and laboratory characteristics of the psoriatic patients with ALT serum concentration within normal range and with ALT above the limit. Data are shown as median and quartiles (Q1 first quartile; Q3 third quartile). Significant differences between the groups are shown as: *p < 0.05
Patients were divided into 2 groups according to the blood levels of ALT. The median value of ALT in the examined group of patients was 22 (minimum value was 7.0; maximum value was 94.0). In 73 cases the serum level of ALT was within the normal range, while in 12 of them ALT was above the reference limit.
We observed higher PASI score (p = 0.01) and higher CRP (p = 0.02) concentration in the group of patients with ALT above the normal range, compared to patients with ALT within the normal range (Figure 1). We observed that the level of ALT was higher in psoriatic patients with obesity (BMI ≥ 30 kg/m2) (n = 27, 31.7%) in comparison to patients with normal body weight (p = 0.02). Additionally, the serum ALT level positively correlated with body weight and BMI in all psoriatic individuals (p = 0.004, r = 0.31 and p = 0.027, r = 0.24, respectively). We did not observe significant correlations between ALT and PASI, blood glucose, and inflammatory markers (CRP, white blood cell count), nor cholesterol and triglyceride concentration. The correlations of ALT with FA and Cer are shown in Table 2.
Figure 1
Severity of the disease (PASI) in psoriatic patients with ALT serum concentration within normal range and with ALT above the limit. Data shown as median (Q1, Q 3). Significant difference between the groups p = 0.011*
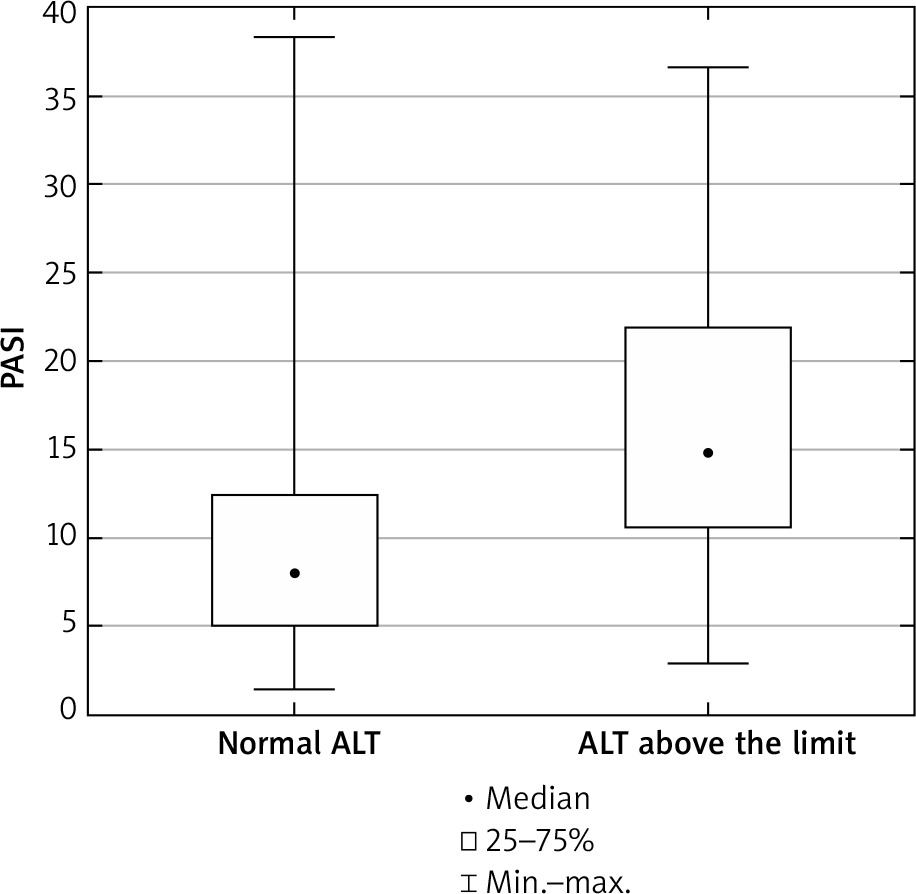
Table 2
Correlation between serum ALT and FA and Cer in psoriatic patients (n = 85). Significant correlations are marked as: *p < 0.05
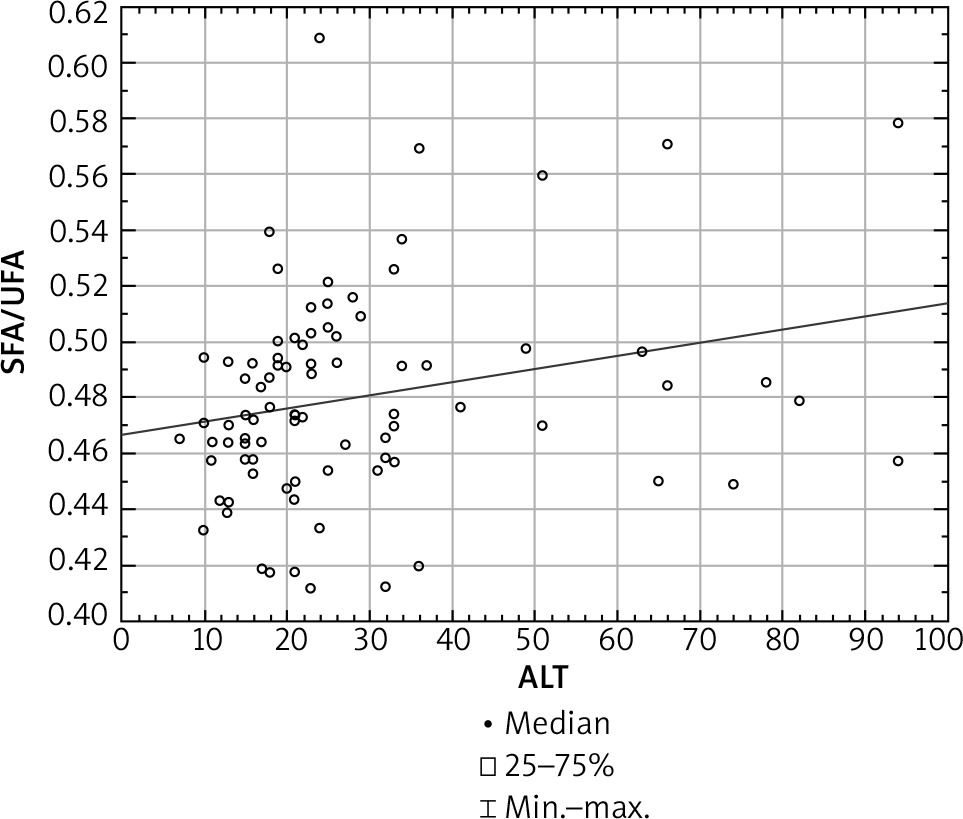
The mean total FA serum concentration in all psoriatic patients was 3642.2 ±859.3 mg/l, and in the control group 3700.4 ±671.3 mg/l. Both psoriatic groups of patients had abnormal serum profile of FA compared to the healthy controls. We did not find any significant differences in particular FAs between the 2 psoriatic subgroups with elevated and normal ALT (Table 3). In all examined psoriatic patients the serum concentration of SFA correlated positively with the ALT level in serum (p = 0.01, r = 0.27), while we observed negative correlation between concentration of UFA and ALT level (p = 0.008, r = –0.28). Furthermore, we found a positive correlation between the SFA/UFA ratio and the ALT level (p = 0.01, r = 0.26) (Figure 2).
Table 3
Differences between serum FA concentrations [mg/l] in psoriatic patients with ALT serum concentration within normal range and with ALT above the limit, and the control group. Data are shown as median and quartiles (Q1 first quartile, Q3 third quartile). Significant differences between the psoriatic patients and the control group are shown as: *p < 0.05; **p < 0.01; ***p < 0.001
The total serum Cer concentration in psoriatic patients was 28.49 ±6.84 nmol/l, which did not correlate with the ALT level in serum. In the healthy control group the total serum concentration of Cer was 31.1 ±5.8 nmol/l. The serum concentrations of myristic ceramide (C14:0) and sphingosine-1-phosphate were higher (p = 0.024 and p = 0.025, respectively) in patients with high serum ALT than in healthy controls. All differences between serum Cer concentrations in the 2 groups of patients and controls are shown in Table 4. In the whole examined psoriatic group the serum concentration of lignoceric ceramide (C24:0) correlated positively with the ALT level (r = 0.22; p = 0.045).
Table 4
Differences between serum Cer concentrations [nmol/ml] and sphingosine-1 phosphate [pmol/ml] in psoriatic patients with ALT serum concentration within normal range and with ALT above the limit and control group. Data are shown as median and quartiles (Q1 first quartile, Q3 third quartile). Significant differences between the psoriatic patients and the control group are shown as: *p < 0.05; **p < 0.01; ***p < 0.001
Discussion
To our knowledge, the association of circulating FA and Cer with liver dysfunction in psoriatic patients had not yet been studied. In our study we observed higher PASI score and CRP concentration in patients with ALT above the normal range. This confirms previous study results indicating the important role of the severity of the disease in the development of liver dysfunction [9, 13]. The serum ALT level correlated positively with body weight and BMI, which seems to confirm that NAFLD may be the hepatic manifestation of obesity and MetS also in psoriatic patients [8].
In our study we did not show statistically significant differences between the overall concentrations of serum FA in psoriatic patients with different levels of ALT. After the division of FA according to their biological properties, we found highly abnormal profiles of FA in both psoriatic groups in comparison to the healthy subjects. We also observed a positive correlation of saturated FA with serum ALT level in our examined group.
In psoriasis SFA plays a key role in exacerbation of skin lesions. Herbert et al. demonstrated in their study a crucial role of dietary delivered saturated fatty acids as an obesity-associated parameter which intensifies the severity of the disease. They proved that increasing the SFA concentration in healthy mice induces exacerbation of psoriasiform inflammation. According to the authors, SFA increased the inflammatory response by sensitizing myeloid cells in answer to proinflammatory stimuli, which in turn can cause activation of keratinocytes. They suggested that reduction of SFA in the diet diminished the psoriatic phenotype in obese mice [22].
Increased serum FFA levels are accompanied by insulin resistance leading to metabolic disorders such as obesity, dyslipidaemia, and cardiovascular diseases [23, 24]. According to the Feng et al., FFAs are the major risk factors in the development of NAFLD and its complications. The authors proved, in the group of 240 patients with NAFLD, significantly higher profiles of 12 subtypes of FFA and total FFA than in healthy controls. What is more, these patients with coexisting obesity presented significantly higher SFA (14:0, 16:0), monounsaturated FA (16:1, 18:1), and total FFA profiles than healthy controls [25]. Moreover, the authors point out that myristic acid (14:0), which belongs to the group of SFA and palmitoleic acid (16:1), is a promising indicator of liver dysfunction. In our study, palmitoleic acid was significantly higher in both psoriatic subgroups than in the controls, which might be a sensitive predictive factor for liver disease in psoriasis. Also, the higher serum SFA in psoriatic patients confirmed in our study may predispose patients to the development of liver disease. Another study showed an adverse effect of an SFA-rich diet on the liver. According to the authors, patients with nonalcoholic steatohepatitis consumed more SFA that patients with simple steatosis or healthy subjects. Furthermore, increasing dietary SFA intake in isocaloric substitution of carbohydrates or PUFA increases hepatic and visceral fat accumulation in healthy individuals [26]. Taking into account the above dependents, we may speculate that elevated serum concentration of SFA is associated with worse course of psoriasis and could be a prerogative feature of liver damage in this group of patients.
In our examined group we also demonstrated the negative correlation between UFA and ALT level. From the literature, we know that n-6 PUFA, marine-derived n-3 PUFA, and MUFA are believed to be protective factors for the risk of development of MetS [27, 28]. Kristensen et al. in their study showed a decrease in Disease Activity Score (DAS28-CRP) and PASI score after 24-week supplementation of n-3 PUFA. They also demonstrated a significant reduction of intake of non-steroidal anti-inflammatory drugs and paracetamol among patients with psoriatic arthritis compared with healthy controls [29]. Supplementation of n-3 PUFA also reduces pro-inflammatory cytokine levels (such as TNF-α and IL-6), improves glycaemia, and has hypolipidaemic effects [30]. Moreover, the Mediterranean diet, rich in monounsaturated fatty acids, reduces liver steatosis and improves insulin sensitivity in an insulin-resistant population with NAFLD [30, 31]. Therefore, the lower serum UFA concentration in our group of psoriatic patients on the one hand may exacerbate skin lesions and on the other hand may also lead to liver dysfunction and other systemic metabolic disturbances. Generally, we observed many FA profile disturbances (Table 3) in comparison to the healthy control group, which create a pro-inflammatory environment and may predispose psoriatic patients to NAFLD.
For the first time we have shown a positive correlation between the SFA/UFA ratio and the ALT level in psoriatic patients. In our previous study we demonstrated a positive correlation between the SFA/UFA ratio and the duration of the disease. What is more, we also observed a higher SFA/UFA ratio in psoriatic patients with obesity and hypertension [19]. The above findings together may indicate the increasing risk of liver dysfunction development and metabolic disorders with the duration of psoriasis.
In our study the total serum ceramide concentration did not correlate with the ALT level in psoriatic patients. However, we demonstrated a positive correlation between lignoceric ceramide (C24:0) and the serum ALT level. The serum concentration of myristic ceramide (C14:0) was higher in patients with high serum ALT than in healthy controls.
According to recent studies, both C14:0 and C24:0 ceramides can be involved in the pathogenesis of liver disease. Maldonado and Hernandes, in their study concerning the association of Cer with hepatic steatosis, showed that level of all ceramides correlated directly with ALT concentration. The authors highlight that the strongest correlation was observed with the myristic ceramide (C14:0). The authors even suggest that C14:0 could be a novel biomarker of hepatosteatosis independently of obesity [32]. In this context, the high concentration of C14:0 observed in our psoriatic patients may be related to the liver dysfunction, and probably it could serve as a prognostic indicator of liver disease. Further studies on larger groups of patients are needed to confirm this dependence. In this retrospective study it is impossible to decide which of the findings is the primary: the increase of ALT or C14:0.
There are many potential links between Cer profile and metabolic disturbances. Some serum Cer species are associated with insulin resistance development – the major risk factor for liver steatosis. Haus et al., in their study on obese, diabetic patients, found a negative correlation of insulin sensitivity with total Cer concentration and with C18:0, C20:0, C24:1, and C24:0 [33]. Gastric bypass resulted in reduced plasma levels of C14:0, C16:0, C20:0, and C24:0 in patients. Moreover the decrease in C24:0 correlated with the amount of weight loss and the improvement in insulin sensitivity [34]. Hanamatsu et al., in their study on young obese adults, observed a positive correlation between C24:0 and γ-glutamyl transpeptidase [35]. Brozinick et al. demonstrated that the total Cer level and the levels of C14:0, C16:0, C22:0, and C24:0 were high in prediabetic and diabetic nonhuman primates, and that the levels of these Cer correlate with the homeostasis model assessment of insulin resistance (HOMA-R) [36]. All these findings suggest that C24:0 and C14:0 may have a great impact on creating metabolic disturbances, also among psoriatic patients.
We observed higher serum concentration of S1P in psoriatic patients with high serum ALT than in healthy controls. S1P is a bioactive signalling molecule, and it plays a role as a key mediator of many physiological and pathophysiological responses, such as cell growth and survival, differentiation, migration, vascular integrity, lymphocyte trafficking, and immune response. The role of S1P is to inhibit keratinocyte proliferation and induce differentiation and migration of the above cells. Its higher level was described in many metabolic disturbances and was indicated as a marker of obesity and insulin resistance [37, 38]. Recently it was also found to play an important role in liver pathology, such as acute liver failure, liver fibrosis, and fatty liver disease [39]. Our results indicate that S1P may be involved in the development of liver disease also in psoriatic patients.
There are some limitations of our study. Due to the fact that this is a retrospective study, in the hospital documentation we had only alanine transaminase serum concentration. We did not perform ultrasonography or biopsy of the liver. Taking into account the fact that we excluded patients with other potential, secondary causes of liver damage, it can be considered with high probability that the above disturbances occurred in the course of psoriasis. Our results need confirmation in further studies.
Conclusions
Patients with severe psoriasis are predisposed to the development of liver dysfunction. We demonstrated disturbances of serum fatty acids and sphingolipid profile in psoriatic patients, which may trigger liver disease. An abnormal FA profile might provide some additional predictive value for liver dysfunction and may convey higher risk of NAFLD development in this group of patients.


