
Introduction
Lipoedema is a chronic, progressive, but poorly recognized disease featured by abnormal bilateral and symmetrical fat distribution resulting in disproportionate, painful lower body and/or upper extremities. It has a female predominance and is usually mistaken for obesity or lymphedema. According to literature data, polygenic susceptibility, hormonal, microvascular, and lymphatic causes may be partly responsible for its development. Medical compression stockings (MCS) are accepted tools in the treatment in lipoedema [1].
Several newer echocardiographic modalities, including three-dimensional speckle-tracking echocardiography (3DSTE), have emerged in the last decades allowing deeper insights into the disease pathophysiology, including myocardial deformation [2–4]. 3DSTE has the ability to simultaneously assess volumetric and functional alterations of heart chambers including atria [2–5]. It has already been validated for left atrial (LA) quantifications [6–8].
Aim
The objective of the present study was to assess LA volumetric and functional properties by 3DSTE in patients with lipoedema and to compare their results to age- and gender-matched healthy controls. It was also examined whether one-hour use of MCS has any effect on LA volumes and functional properties.
Material and methods
Patient population
The study comprised 25 female patients with lipoedema (mean age: 42.5 ±12.2 years, body mass index: 34.3 ±6.6 kg/m2). Lipoedema was diagnosed and characterized on the basis of its typical clinical features including the presence of non-pitting oedema, cuffing sign, stove pipe legs, easy bruising and spontaneous or minor trauma induced pain perception. Patients had stage 2 lipoedema, which means that the skin surface is uneven with indentations in the fat tissue and fat structure proves to be coarsely knotted with larger mounds of lipomas able to be seen and felt [9, 10]. Their results were compared to those of the control group consisting of 54 age- and gender-matched healthy female subjects (mean age: 42.7 ±10.6 years, body mass index: 23.1 ±4.5 kg/m2). None of the lipoedema patients and controls had diabetes mellitus, hypertension or hypercholesterolemia. Healthy subjects had no ECG or echocardiographic abnormalities. The present study is a part of MAGYAR-Path Study (Motion Analysis of the heart and Great vessels bY three-dimensionAl speckle-tRacking echocardiography in Pathological cases), which was organized to analyse the diagnostic and prognostic value of 3DSTE-derived parameters in different pathological disorders (Magyar means ‘Hungarian’ in Hungarian language). The Institutional human research committee approved the study, which complied with the Declaration of Helsinki. Informed consent was given by all lipoedema patients and control subjects. All lipoedema patients were informed about the study protocol.
Two-dimensional Doppler echocardiography
Routine two-dimensional (2D) Doppler echocardiography was performed using Toshiba ArtidaTM echocardiography equipment (Toshiba Medical Systems, Tokyo, Japan) with a PST-30SBP (1–5 MHz) phased-array transducer. Complete 2D Doppler echo studies included assessment of LA dimensions, left ventricular (LV) dimensions, volumes and ejection fraction (EF), measurement of transmitral flow E and A and their ratio [11].
Three-dimensional speckle-tracking echocardiography
3DSTE-capable PST-25SX matrix-array transducer (Toshiba Medical Systems, Tokyo, Japan) was used during data acquisition using the same Toshiba ArtidaTM echocardiographic tool (Toshiba Medical Systems, Tokyo, Japan). During data acquisition from the apical window, 6 R-wave triggered wedge-shaped subvolumes were acquired in a step-by-step fashion in each cardiac cycle during a single breath-hold creating a full-volume 3D dataset. Offline analysis was performed with a 3D Wall Motion Tracking software version 2.7 (Toshiba Medical Systems, Tokyo, Japan). By using this software, apical four-chamber (AP4CH) and apical two-chamber (AP2CH) views and 3 short-axis views were automatically selected at end-diastole. Following image optimization, the endocardial border was detected by setting several markers from the edge of the septum-mitral annulus (MA) towards the edge of the lateral wall-MA (Figure 1). Then automatic reconstruction of the LA endocardial surface was performed allowing volumetric and strain analyses [2–5]. According to our practice and technical opportunities, the frame rate changed/varied between 26/s and 31/s, while volume rates were 27–30 vps during 3DSTE assessments.
Figure 1
Three-dimensional (3D) speckle-tracking echocardiography-derived left atrial (LA) assessment in a lipoedema patient. Apical four-chamber view (A), apical two-chamber view (B), short-axis view at basal (C3), midatrial (C5) and superior left atrial level (C7) are presented with a 3D LA cast (D) and calculated LA volumetric data (E). LA time – global volume (dashed line) and LA circumferential time – segmental strain curves (coloured lines) are also demonstrated (F). A white arrow represents peak LA strains while a dashed arrow represents LA strains at atrial contraction. LA – left atrium, LV – left ventricle, RA – right atrium, RV – right ventricle, EDV – end-diastolic volume, ESV – end-systolic volume, EF – ejection fraction, Vmax – maximum LA volume, VpreA – LA volume before atrial contraction, Vmin – monimum LA volume
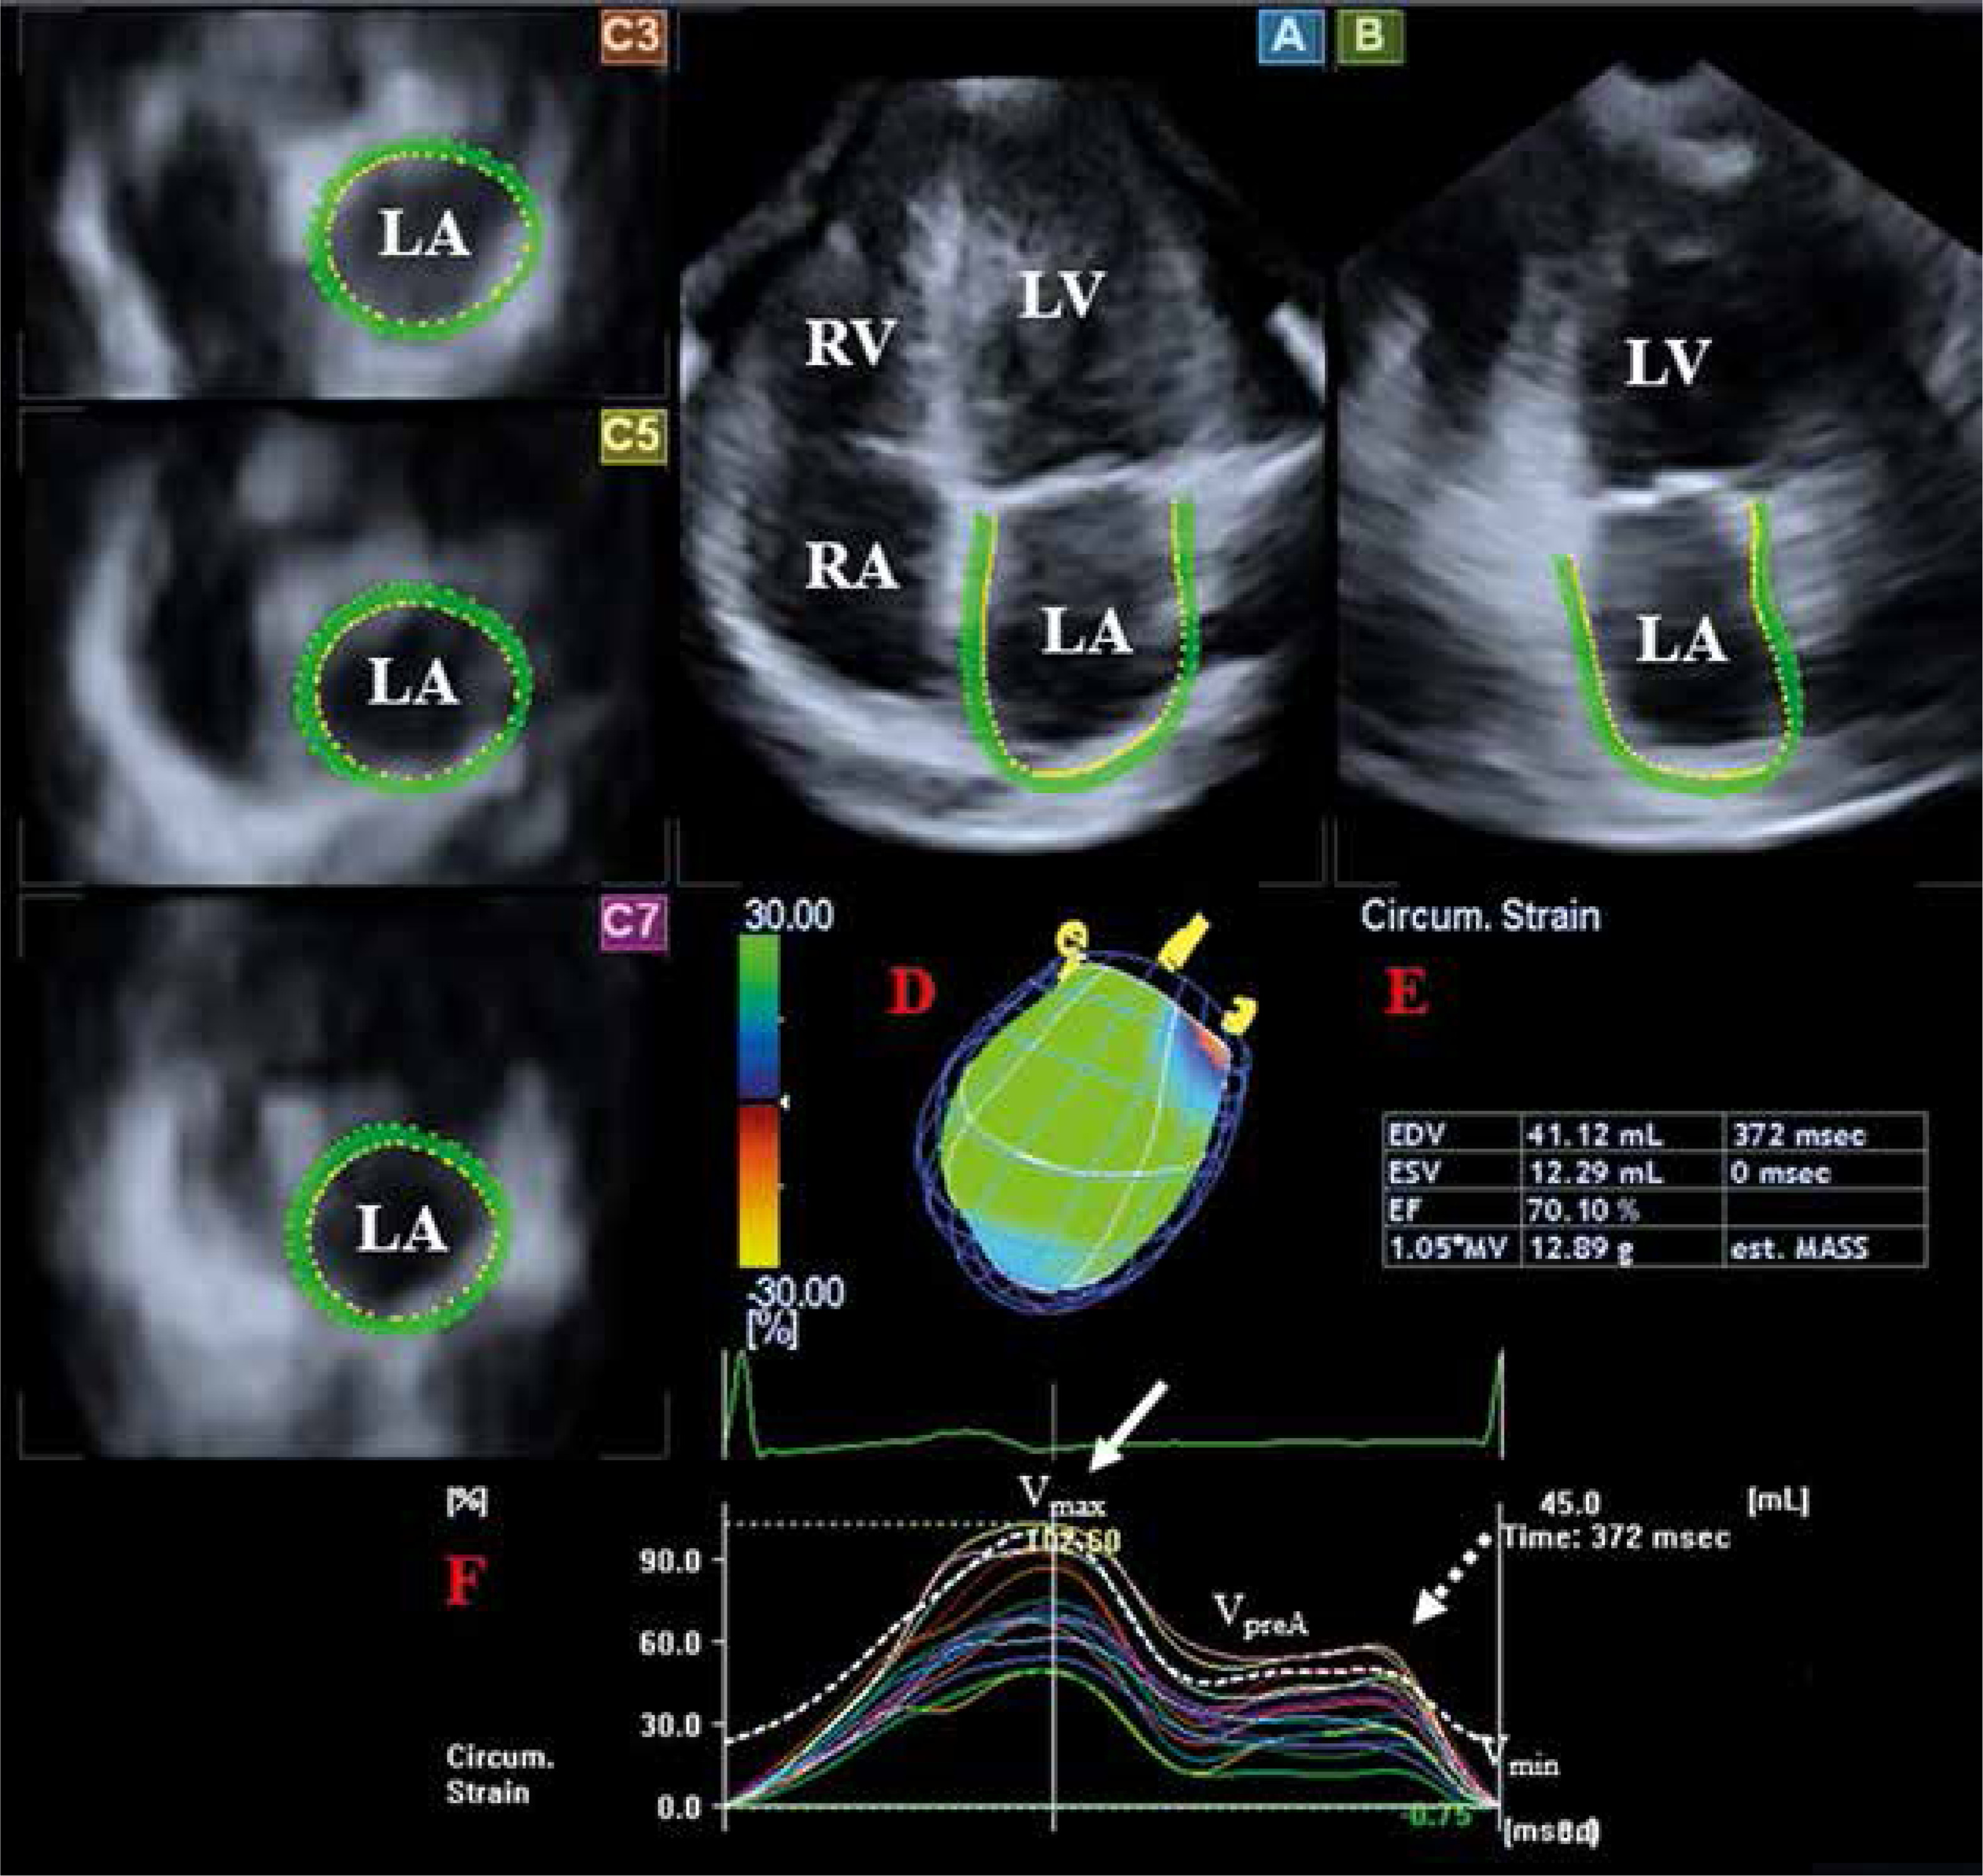
Several LA volumetric and derived volume-based functional data were calculated from the 3DSTE datasets (Figure 1) [2–5]:
Volumetric data:
Vmax: end-systolic maximum LA volume, measured just before mitral valve opening,
VpreA: early diastolic LA volume, measured before atrial contraction at the time of the P-wave on the ECG,
Vmin: end-diastolic minimum LA volume, measured just before mitral valve closure.
Derived volume-based functional data:
TASV: LA total stroke volume, calculated by Vmax-Vmin featuring LA reservoir function,
TAEF: LA total emptying fraction, calculated by total SV/Vmax featuring LA reservoir function,
PASV: LA passive stroke volume, calculated by Vmax-VpreA featuring LA conduit function,
PAEF: LA passive emptying fraction, calculated by passive SV/Vmax featuring LA conduit function,
AASV: LA active stroke volume, calculated by VpreA-Vmin featuring LA active contraction,
AAEF: LA active emptying fraction, calculated by active SV/VpreA featuring LA active contraction.
One of the most important benefits of 3DSTE is the option for simultaneous assessment of LA strains using the same acquired 3D datasets. Several unidimensional (unidirectional) radial (RS), longitudinal (LS) and circumferential (CS) and two multidimensional (multidirectional) complex 3D (3DS) and area (AS) LA strains were measured automatically. For detailed analysis, in addition to global and mean segmental strains, regional strains were also calculated from segmental values. Twin-peak strains were detected, the first representing LA reservoir function in end-systole and a second featuring atrial contraction at end-diastole (LA systole) (Figure 1) [2–5].
Experimental study protocol
The same protocol was used as demonstrated before [12, 13]. Firstly, 2D echocardiography extended with 3DSTE was performed in each lipoedema patient. Following echocardiographic examinations, MCSs were donned and applied for 60 min. Then a repeated echocardiographic assessment was scheduled before the patients took off their MCSs. No physical exercise, sitting with straight legs or standing and consuming any meal or beverage were allowed until the second echocardiographic procedure has been completed. Studies were performed at stable room temperature (21–22°C) and relative humidity (45–50%). Bauerfeind VenoTrain CuraFlow flat-knitted black-coloured ccl 2 (23–32 mmHg) (Bauerfeind, Zeulenroda, Germany) stocking consisting of 73% polyamide and 27% elastane was employed. Picopress device (Microlab Elettronica, Nicolò, Italy) was used for interface pressure measurement between skin and compression material at B1 point in standing position, the measurement revealed a mean pressure of 22.79 ±3.75 mm Hg in lipoedema patients [14].
Statistical analysis
A p-value < 0.05 was considered to be statistically significant. Categorical data were reported in frequencies and percentage and for their comparison, Fisher’s exact test was used. Continuous data were expressed as mean ± standard deviation. To test normality of distribution, Shapiro-Wilk’s test was used. To assess homogeneity of variance, Levene’s test for equality of variances was applied. For datasets following normal and non-normal distributions, Student’s t test and Mann-Whitney-Wilcoxon test were used, respectively. For statistical analysis, RStudio was used (RStudio Team, RStudio: Integrated Development for R. RStudio, Inc., Boston, MA, 2015). For offline data analysis and graph creation, a commercial software package was used (MATLAB 8.6, The MathWorks Inc., Natick, MA, 2015). GPower 3.1.9 Software (Heinrich-Heine University, Düsseldorf, Germany) was applied for power calculation: in the presence of effect size: 0.8, α: 0.05, power: 0.8 the minimum group size is n = 12.
Results
Demographic data
None of the healthy subjects or lipoedema patients had diabetes mellitus, hypertension or hypercholesterolemia, mean age was similar between the groups (Table 1).
Table 1
Two-dimensional echocardiographic data of patients with lipoedema and controls
Two-dimensional echocardiographic data
Increased LA diameter, LV end-diastolic diameter and volume, thickened interventricular septum and LV posterior wall and higher LV-EF and transmitral A flow velocity could be measured in lipoedema patients as compared to controls (Table 1).
3DSTE-derived volumes and volume-based LA functional properties
Increased LA volumes could be measured in lipoedema patients as compared to controls regardless of the phase of the cardiac cycle it was measured in, and the LA volumes showed further increase after 1-hour use of MCS. Similarly, TASV, PASV and AASV featuring all phases of the cardiac cycle were increased in lipoedema patients, and these parameters were further increased in systole and early-diastole. Systolic TAEF showed changes in lipoedema patients neither at rest nor after 1-hour use of MCS. PAEF were increased after the use of MCS as compared to data measured at rest, while AAEF were increased in lipoedema patients at rest, which showed no further changes after one-hour use of MCS (Table 2).
Table 2
Comparison of three-dimensional speckle-tracking echocardiography-derived volumetric left atrial parameters between patients with lipoedema and controls
| Variable | Controls (n = 54) | Lipoedema patients at rest (n = 25) | Lipoedema patients 1 h after the use of MCS (n = 25) |
|---|---|---|---|
| Calculated volumes [ml]: | |||
| Vmax | 40.9 ±13.8 | 55.3 ±16.7* | 62.4 ±16.4*,† |
| Vmin | 19.1 ±7.9 | 24.9 ±9.2* | 27.9 ±10.9*,† |
| VpreA | 28.3 ±12.9 | 38.6 ±13.9* | 42.1 ±14.0*,† |
| Stroke volumes [ml]: | |||
| TASV | 21.5 ±9.5 | 30.4 ±9.9* | 34.6 ±9.5*,† |
| PASV | 12.9 ±6.4 | 16.7 ±6.3* | 20.3 ±7.3*,† |
| AASV | 8.6 ±8.3 | 13.8 ±6.3* | 14.3 ±6.0* |
| Emptying fractions (%): | |||
| TAEF | 52.4 ±14.2 | 55.2 ±9.5 | 56.2 ±10.6 |
| PAEF | 32.7 ±14.6 | 30.8 ±10.1 | 33.6 ±10.6† |
| AAEF | 28.0 ±19.3 | 35.2 ±9.2* | 34.3 ±11.3 |
AASV – active atrial stroke volume, AAEF – active atrial emptying fraction, PAEF – passive atrial emptying fraction, PASV – passive atrial stroke volume, TAEF – total atrial emptying fraction, TASV – total atrial stroke volume, Vmax – maximum left atrial volume, Vmin – minimum left atrial volume, VpreA – left atrial volume before atrial contraction, MCS – medical compression stocking, 3D – three-dimensional.
3DSTE-derived peak LA strain parameters
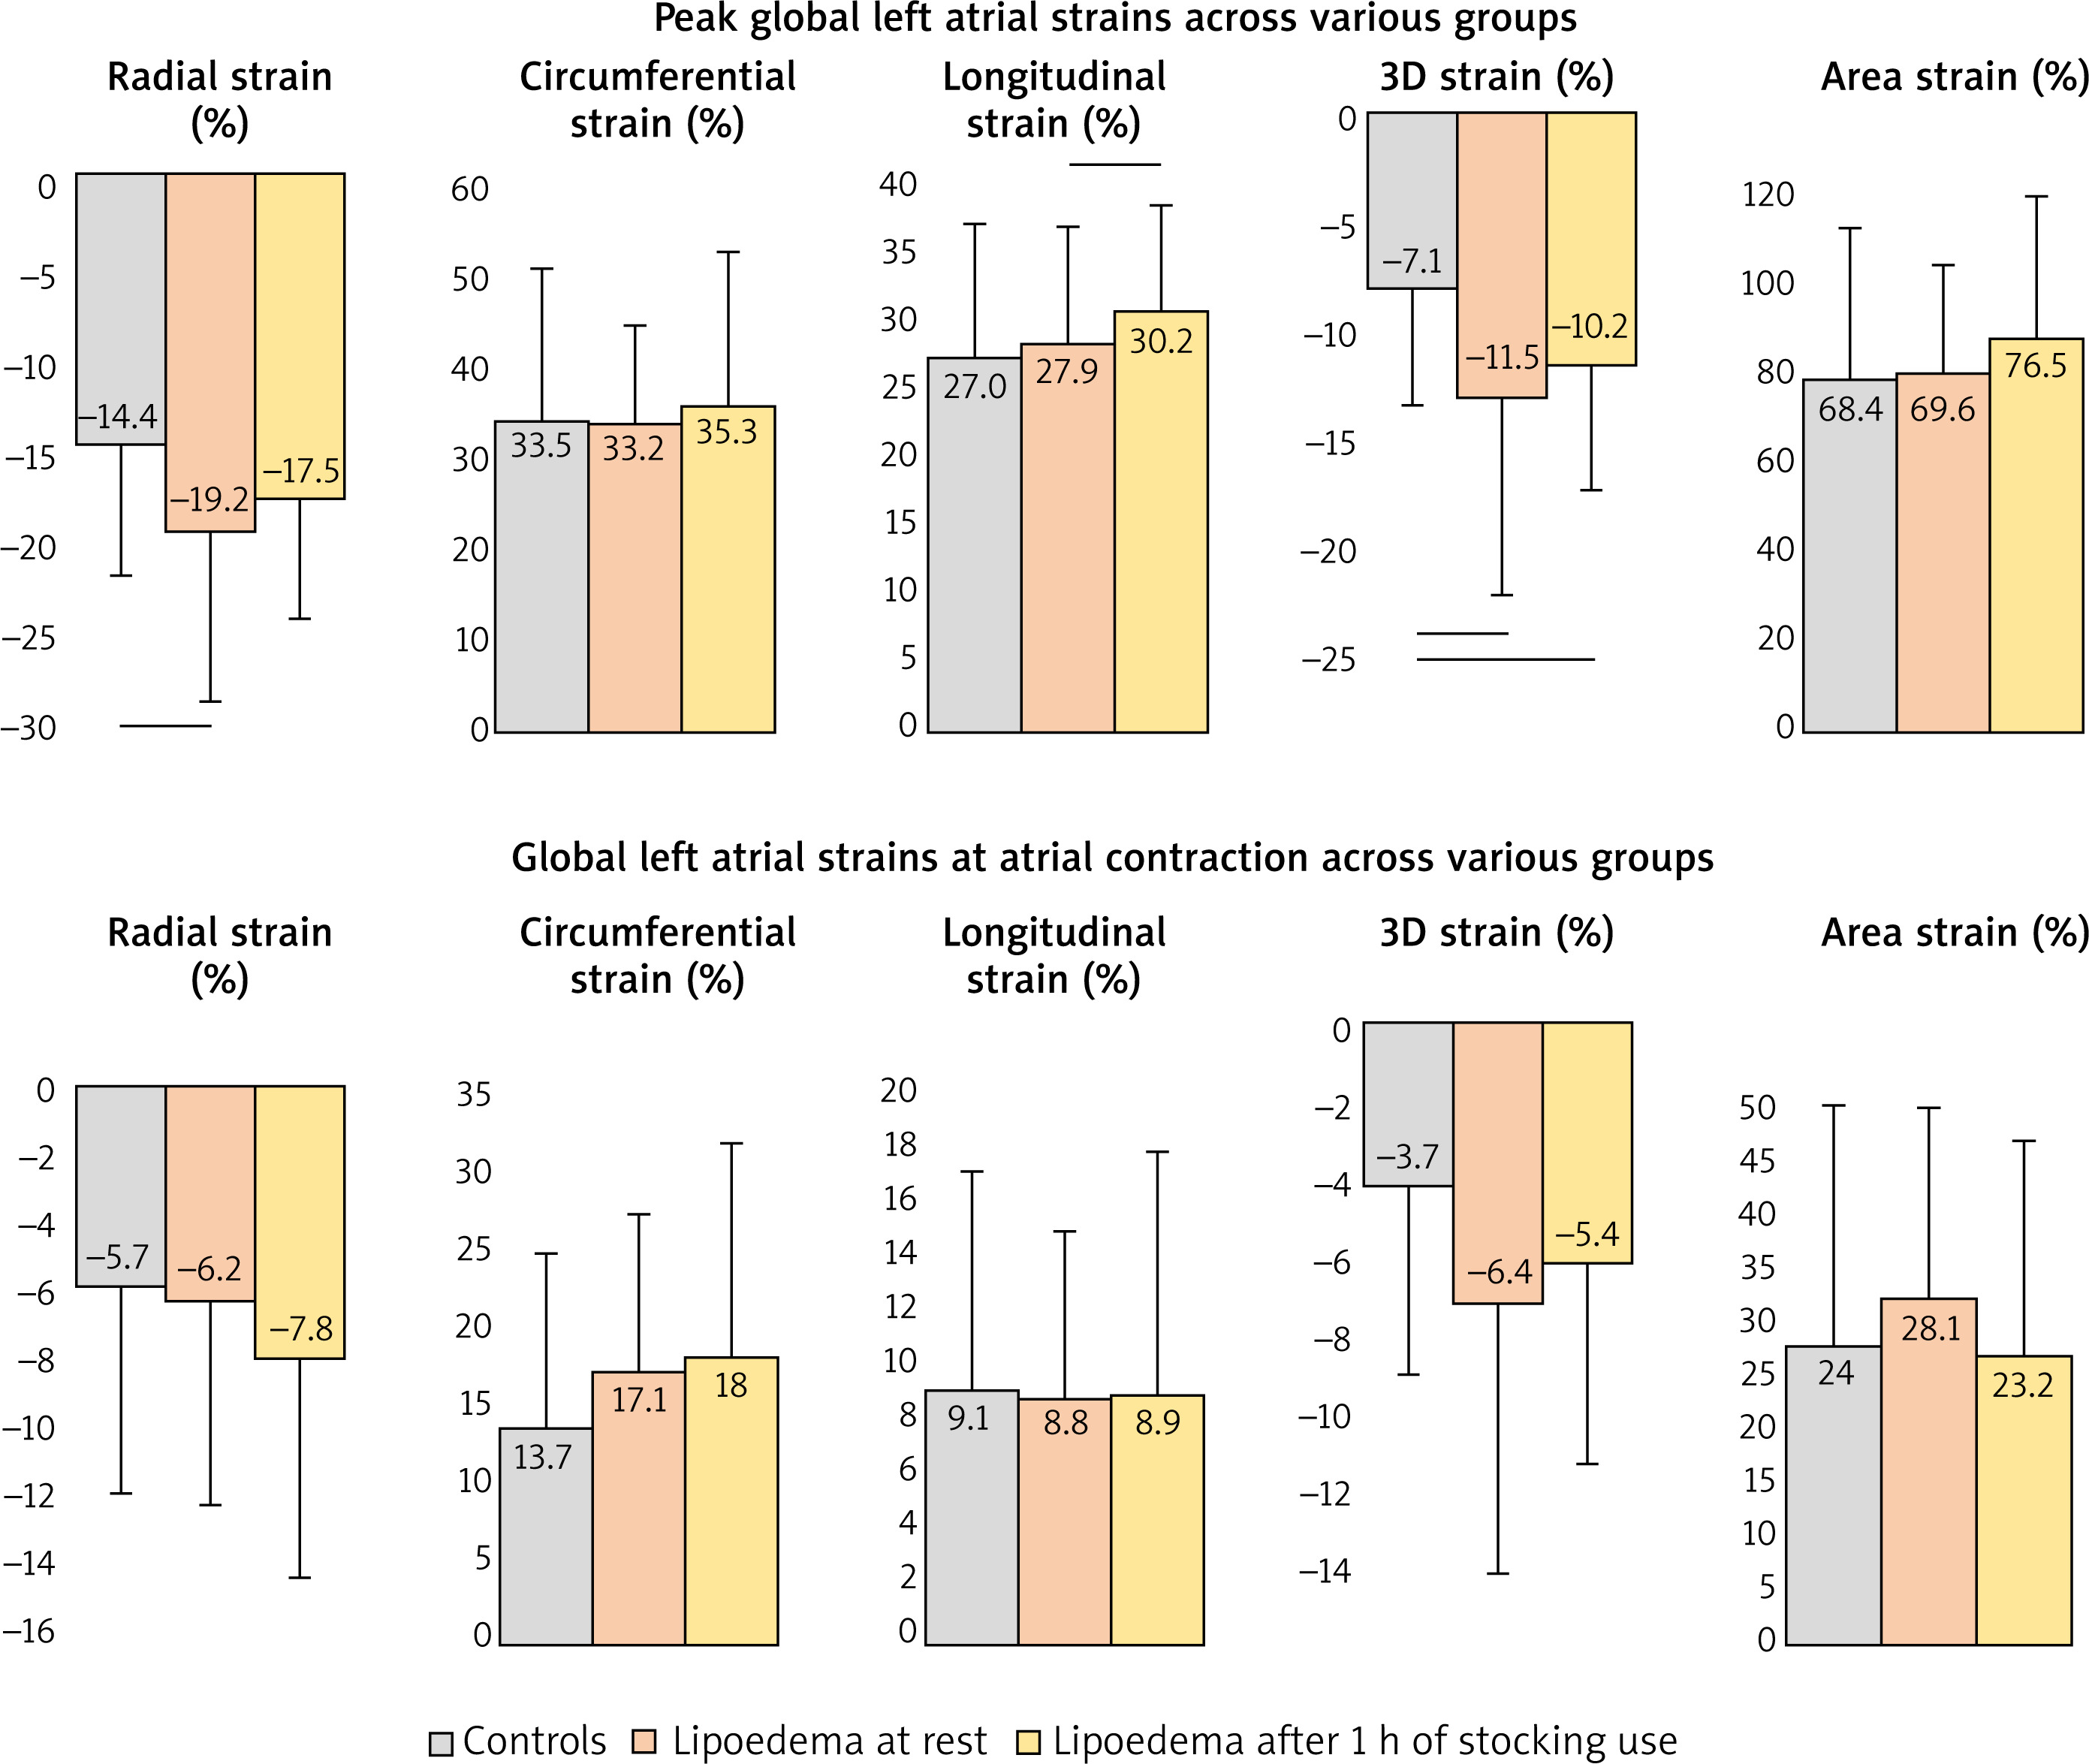
Peak global RS and 3DS were increased in lipoedema patients, which did not show significant alterations after one-hour use of MCS. Peak global LS increased in lipoedema patients after 1-hour use of MCS compared to data measured at rest (Figure 2). Mean segmental and regional data are presented in Table 3.
Table 3
Comparison of three-dimensional speckle-tracking echocardiography-derived regional peak left atrial strain parameters between patients with lipoedema and controls
| Variable | Controls (n = 54) | Lipoedema patients at rest (n = 25) | Lipoedema patients after 1 h use of MCS (n = 25) |
|---|---|---|---|
| Mean segmental (%): | |||
| RS | –19.1 ±5.6 | –22.3 ±8.1 | –21.1 ±5.3 |
| CS | 37.8 ±15.3 | 36.4 ±9.8 | 38.5 ±15.5 |
| LS | 30.3 ±8.9 | 29.8 ±7.3 | 31.7 ±7.4 |
| 3DS | –12.7 ±4.3 | –15.7 ±6.6 | –14.7 ±3.9 |
| AS | 74.8 ±27.9 | 73.7 ±19.9 | 80.3 ±26.9 |
| Regional (%): | |||
| RS basal | –17.4 ±8.2 | –19.6 ±7.4 | –20.4 ±7.0 |
| RS midatrial | –19.0 ±5.9 | –22.4 ±9.0 | –21.3 ±6.7 |
| RS superior | –20.7 ±12.0 | –26.3 ±12.5* | –21.9 ±9.3† |
| CS basal | 41.1 ±16.0 | 39.0 ±11.8 | 39.0 ±15.5 |
| CS midatrial | 33.5 ±14.9 | 33.9 ±9.9 | 35.0 ±12.9 |
| CS superior | 38.5 ±24.7 | 36.3 ±17.0 | 42.4 ±28.4 |
| LS basal | 22.8 ±10.9 | 21.1 ±9.1 | 22.3 ±9.4 |
| LS midatrial | 38.9 ±15.3 | 38.8 ±10.2 | 41.8 ±11.6 |
| LS superior | 28.0 ±15.5 | 29.2 ±13.5 | 30.7 ±14.6 |
| 3DS basal | –12.0 ±6.4 | –14.4 ±6.3 | –15.5 ±5.5* |
| 3DS midatrial | –11.8 ±4.2 | –14.7 ±7.2 | –14.2 ±5.6 |
| 3DS superior | –14.1 ±9.7 | –19.1 ±10.3 | –14.3 ±5.3† |
| AS basal | 64.3 ±28.8 | 61.6 ±21.8 | 63.9 ±22.2 |
| AS midatrial | 79.0 ±29.7 | 82.7 ±21.8 | 87.8 ±26.1 |
| AS superior | 82.5 ±58.9 | 78.4 ±41.6 | 93.5 ±64.3 |
3DSTE-derived LA strains at atrial contraction
While global atrial strains at atrial contraction did not differ between lipoedema patients and controls, mean segmental strain showed some significant alterations (Figure 2). CS was increased in lipoedema patients with no further changes after 1-hour use of MCS. 3DS were proved to be increased in lipoedema patients after one-hour use of MCS. Regional data are presented in Table 4.
Table 4
Comparison of three-dimensional speckle-tracking echocardiography-derived mean segmental and regional left atrial strain parameters at atrial contraction between patients with lipoedema and controls
| Variable | Controls (n = 54) | Lipoedema patients at rest (n = 25) | Lipoedema patients after 1 h use of MCS (n = 25) |
|---|---|---|---|
| Mean segmental (%): | |||
| RS | –8.6 ±4.7 | –9.8 ±4.3 | –10.1 ±3.8 |
| CS | 15.0 ±9.0 | 18.3 ±7.0* | 19.5 ±9.3* |
| LS | 10.1 ±5.7 | 10.7 ±4.4 | 11.0 ±4.0 |
| 3DS | –5.7 ±4.0 | –7.5 ±4.0 | –8.0 ±5.2* |
| AS | 26.6 ±15.9 | 31.5 ±12.1 | 32.8 ±15.8 |
| Regional (%): | |||
| RS basal | –8.0 ±5.6 | –9.2 ±4.5 | –9.7 ±5.7 |
| RS midatrial | –8.5 ±5.6 | –8.8 ±4.3 | –9.7 ±5.0 |
| RS superior | –9.8 ±8.3 | –12.0 ±10.0 | –11.3 ±5.4 |
| CS basal | 16.4 ±9.0 | 19.0 ±7.9 | 18.2 ±9.1 |
| CS midatrial | 13.4 ±10.0 | 15.6 ±7.9 | 17.0 ±8.3* |
| CS superior | 15.1 ±14.2 | 21.1 ±12.1* | 25.0 ±17.2* |
| LS basal | 7.2 ±3.9 | 6.9 ±4.0 | 5.9 ±4.0 |
| LS midatrial | 12.4 ±7.9 | 12.5 ±7.4 | 13.0 ±6.4 |
| LS superior | 10.9 ±10.1 | 13.5 ±7.4 | 15.8 ±10.4* |
| 3DS basal | –5.3 ±5.5 | –7.5 ±4.8 | –8.0 ±5.2* |
| 3DS midatrial | –5.1 ±4.1 | –6.7 ±3.7 | –6.8 ±3.9 |
| 3DS superior | –7.2 ±7.5 | –8.8 ±8.5 | –8.5 ±5.1 |
| AS basal | 22.9 ±13.5 | 26.6 ±10.9 | 23.7 ±12.0 |
| AS midatrial | 27.7 ±16.9 | 30.4 ±15.9 | 31.7 ±14.2 |
| AS superior | 30.6 ±29.5 | 40.3 ±24.4 | 47.9 ±36.4* |
Discussion
This is the first detailed assessment of lipoedema-associated LA volumetric and functional abnormalities before and after one-hour use of MCS. Physiologically, LA has a distinct phasic function: it is a reservoir during LV systole, a conduit during early LV diastole and a booster pump in late LV diastole [15]. 3DSTE is a new echocardiographic imaging technique based on block-matching mechanism enabling measurement of volumetric and strain variables at the same time from the same acquired 3D datasets [2–4]. These technical opportunities enable detailed analysis of different heart chambers like LA by volumetric data, volume-based functional properties and strain parameters respecting the cardiac cycle [5]. In several studies, 3DSTE-derived LA quantification was validated against other imaging methods [6–8]. Moreover, different patterns of changes of volumetric and strain variables could be demonstrated in several disorders from mild alterations in type 1 diabetes mellitus in youth to severe deterioration in cardiac amyloidosis [5]. Based on the presented findings, detailed analysis showed special features of LA volumetric data and strains in lipoedema suggesting alterations in all phases of LA function. Moreover, the use of MCS had significant effects on atrial volumes and function compared to data measured at rest.
Although patients with lipoedema display a less severe cardiovascular profile [1], increased aortic stiffness [16] and dilated and functionally impaired mitral annulus could be demonstrated [12]. Severely deteriorated left ventricular (LV) rotational mechanics including reduced apical rotation and twist and increased prevalence of absence of LV twisting mechanics called as LV rigid body rotation were also found in lipoedema patients without any cardiovascular symptoms [13]. These findings could practically explain LA abnormalities, but the role of other factors like fat depositions, fibrosis or oedema around the cardiac chambers or in their wall could not be excluded either. The present study gives further insights into lipoedema-associated cardiovascular alterations in asymptomatic patients, but further studies are also warranted to confirm the present findings and to clarify their clinical importance.
Limitation section
Low temporal and spatial image resolutions are known features of 3DSTE, which could theoretically affect the findings [2].
LA appendage and pulmonary veins were excluded from the assessments.
The present study did not aim to further validate 3DSTE-derived measurements [6–8].
It was also not aimed to characterize LA morphological abnormalities in selected planes.
3DSTE-derived volumetric and functional assessments of other heart chambers were also not aimed to be performed.
Although there is a debate whether atrial septum is a part of which atrium/which part of the atrium atrial septum is, it was considered to be a part of the LA in this study [15].
A LV segmentation model was used during evaluations due to absence of special 3DSTE-derived LA cast [2, 11].


