
Introduction
Nasal allergen provocation testing (NAPT) is an excellent tool for establishing the final diagnosis in rhinitis [1–5]. NAPT has been reported to play a particularly important role in diagnosing allergic rhinitis, and is defined as a “symptomatic disorder of the nose, developing following exposure to an allergen as a result of immunoglobulin E (IgE)-mediated nasal mucosal inflammation” (particularly in dispelling clinical or diagnostic uncertainties) [6, 7]. Accurate interpretation of the results depends on selecting appropriate techniques for measuring nasal obstruction. Various techniques meet the accepted criteria for either functional or structural assessment, with active anterior rhinomanometry, 4-phase-rhinomanometry, and peak nasal inspiratory flow (PNIF) meeting the former and acoustic rhinometry meeting the latter criteria [2, 3]. In an attempt to find an alternative technique that would meet both types of assessment criteria, a group of German rhinologists [8–12] published their study reports documenting the use of a newly standardized technique of optical rhinometry (ORM).
The properties of ORM (which measures pulses of infrared light with a mean wavelength of 600–800 nm) allow a real-time assessment of changes in intravascular blood flow during NAPT. The principles behind ORM are based on the Beer-Lambert law, which states that the absorbance of light is directly proportional to the concentration and thickness of the sample penetrated by the light [11, 12]. An ORM device, which works in a way similar to that of a pulse oximeter, has an infrared radiation detector (mounted on a frame resembling that of eyeglasses), which records any changes in (intravascular) blood flow within nasal cavity walls. The range of possibilities afforded by this useful assessment tool, including accurate detection of the onset, maximum reaction, and infrared light absorption capacity (optical density (OD) corresponding to the extent of nasal obstruction) has led to its growing use in NAPT. Like acoustic rhinometry [2], ORM allows a separate assessment of changes occurring in two target locations, i.e. at the head of the inferior nasal turbinate and, to a lesser extent, at the nasal isthmus. There is a positive correlation between the level of discomfort associated with nasal obstruction, nasal itching, and OD changes during NAPT [13–15]; there is also a strong correlation between ORM and both acoustic rhinometry [16] and active anterior rhinomanometry [13].
Aim
The aim of this study was to evaluate the level of nasal mucosal response based on three variables: time of onset (T1), time of maximum reaction (T2), and total change in light absorbance (ΔE). The subjective assessment of nasal discomfort in terms of nasal itching, sneezing, runny nose, nasal obstruction, tearing, itching of the throat, cough, and shortness of breath was measured with a visual analog scale.
Material and methods
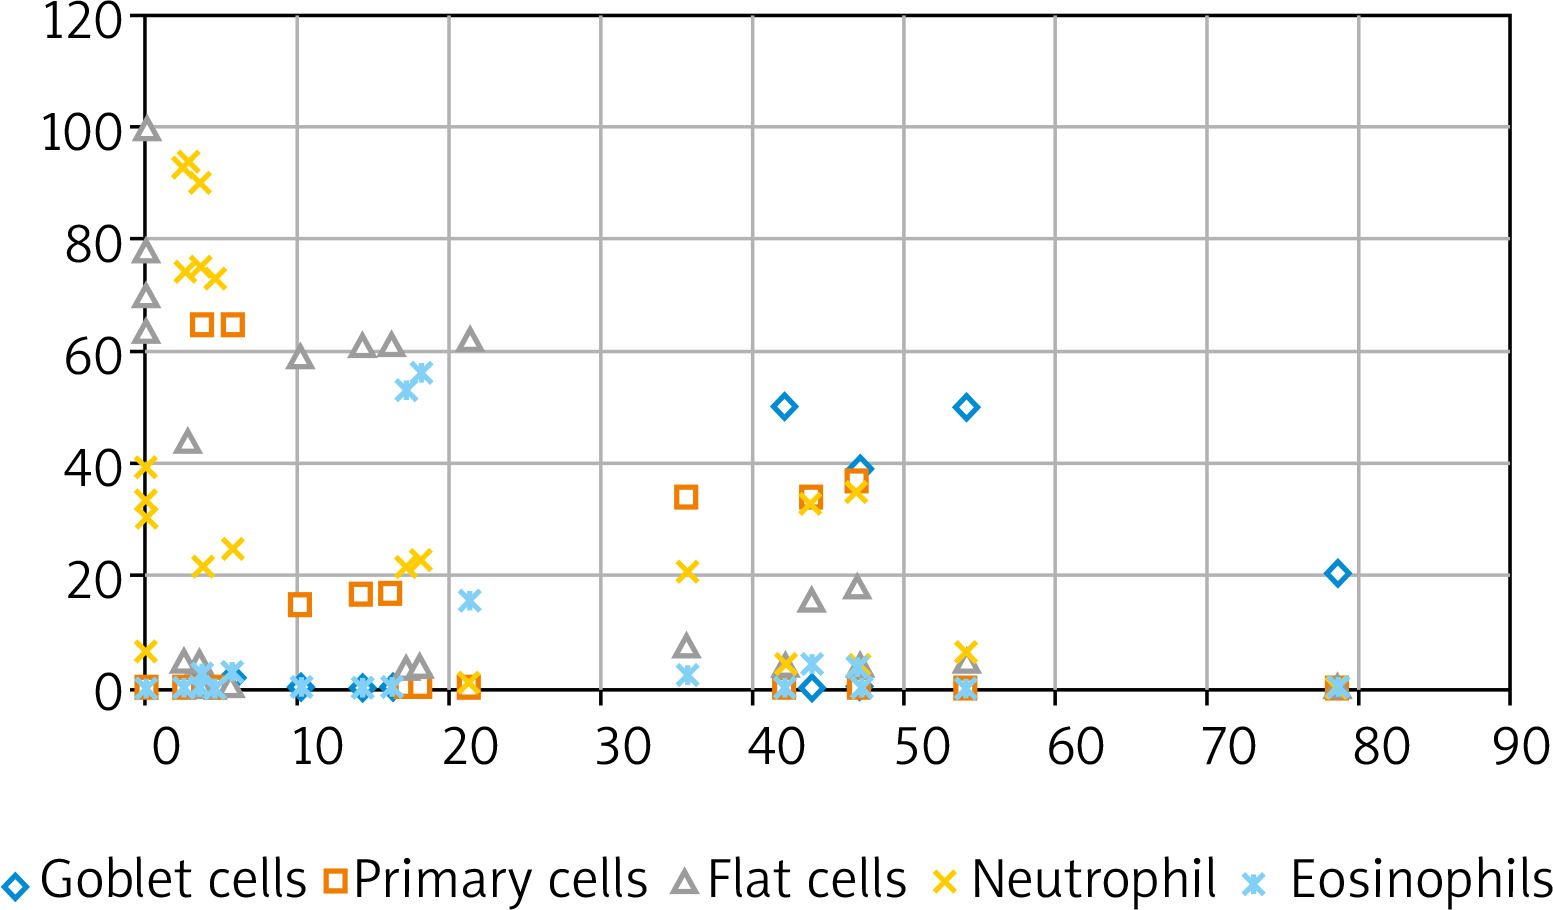
The study group consisted of 25 patients with a history of allergy to house dust mite (Dermatophagoides pteronyssinus, Dermatophagoides farina) allergens (Table 1) confirmed via skin tests (Allergopharma) and 20 healthy controls (mean height: 174.9 cm; mean body weight: 69.3 kg, mean age: 34.9 years). This study was conducted at the Department of Allergy and Clinical Immunology of the University Medical Centre, Medical University of Warsaw; the standard protocol 2 was followed and all necessary data protection regulations were observed. The study inclusion criteria were: a history of allergy to Dermatophagoides pteronyssinus and Dermatophagoides farinae confirmed by positive skin allergy tests and computed tomography scans of the paranasal and frontal sinuses. Nasal mucosa smears were prepared from specimens collected with a cytology brush or inoculation loop from an area near a turbinate and examined microscopically. Examinations of nasal secretions largely showed high eosinophil and neutrophil concentration and squamous cell metaplasia, whereas normal features of a nasal smear (i.e. columnar and goblet cells) were present to a lesser extent (Figure 1). Nasal smear examination results in the control group were normal. The study exclusion criteria were: a history of generalized anaphylaxis, allergy exacerbation (rhinitis, food allergy, hypersensitivity to drugs, allergy to the venom from insect stings), acute rhinitis and sinusitis, severe asthma or exacerbated moderate asthma, obstructive or restrictive lung disease, severe systemic conditions, advanced heart failure, pregnancy, systemic immunotherapy, acute bacterial or viral respiratory tract infection, contraindications to adrenaline administration, treatment with β-blockers or angiotensin convertase enzyme (ACE) inhibitors, the lack of access to the equipment and drugs necessary to treat anaphylactic shock, extensive environmental exposure to the allergen with a risk of anaphylaxis [2]. The assessment method used in this study was NAPT with 5,000 standardized biological units (SBU)/ml (Allergopharma) administered into both nostrils at 0.2 ml at room temperature with a calibrated atomizer. The nasal mucosa response was assessed with a visual analog scale, with 0 indicating no reaction and 100 indicating the most extreme reaction. The local response of the nasal mucosa was assessed with ORM (Rhinolux, infrared light with a wavelength of 600–800 nm) in accordance with the attached protocol. The changes in infrared light absorbance, i.e. OD, were assessed to determine the point of onset (T1) and maximum reaction (T2) on a rhinometry curve. The assessment was conducted three times: the baseline assessment after a 20-minute period of adaptation to the conditions at the laboratory (ambient temperature 21°C, relative humidity 40–50%), then after administration of the control solution (0.9% saline + 0.4% phenol, which constituted the medium for the tested allergen), and finally after topical allergen application. The initial phase of the allergic reaction occurring 10–30 min following allergen application was assessed. No post-NAPT complications in the form of itching or swelling in the nose or throat, auditory tube obstruction (manifesting as the sensation of a clogged ear), sinusitis, conjunctivitis, laryngeal symptoms, bronchial constriction, or generalized anaphylactic reaction (urticaria or anaphylactic shock) were reported. This study had been approved by the Institutional Review Board at the Medical University of Warsaw (KB 63/2012).
Table 1
Study group characteristics
Statistical analysis
The Wilcoxon test, Welch’s two-sample t-test, and analysis of variance (ANOVA) were used, with the significance level α of 0.05. Additionally, receiver operating characteristic (ROC) curves were plotted to assess the specificity and sensitivity of ORM as a tool for evaluating the nasal mucosal response to an allergen (Table 2).
Table 2
The mean values measured via optical rhinometry: optical density, the onset and end of the allergic reaction
Results
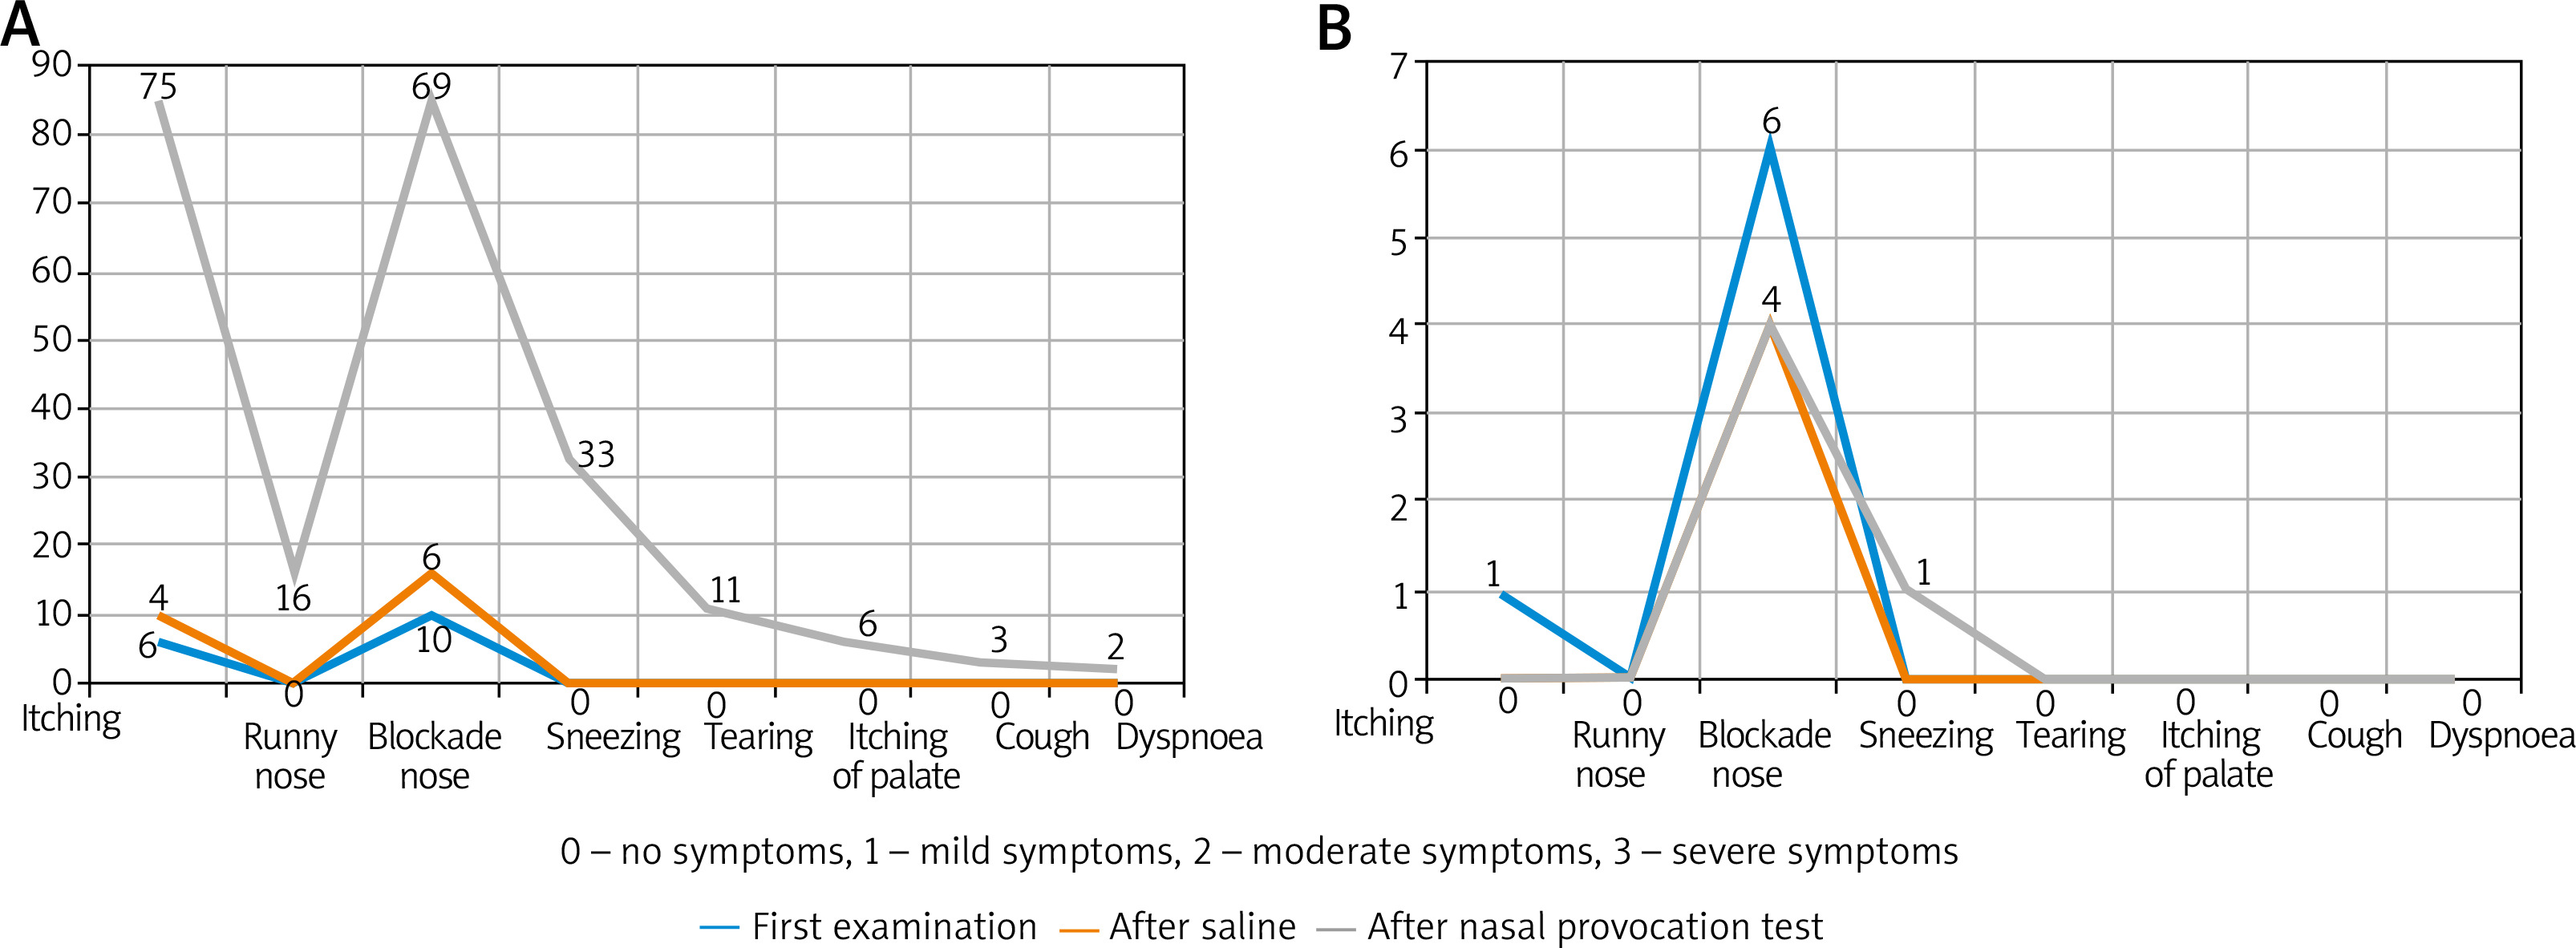
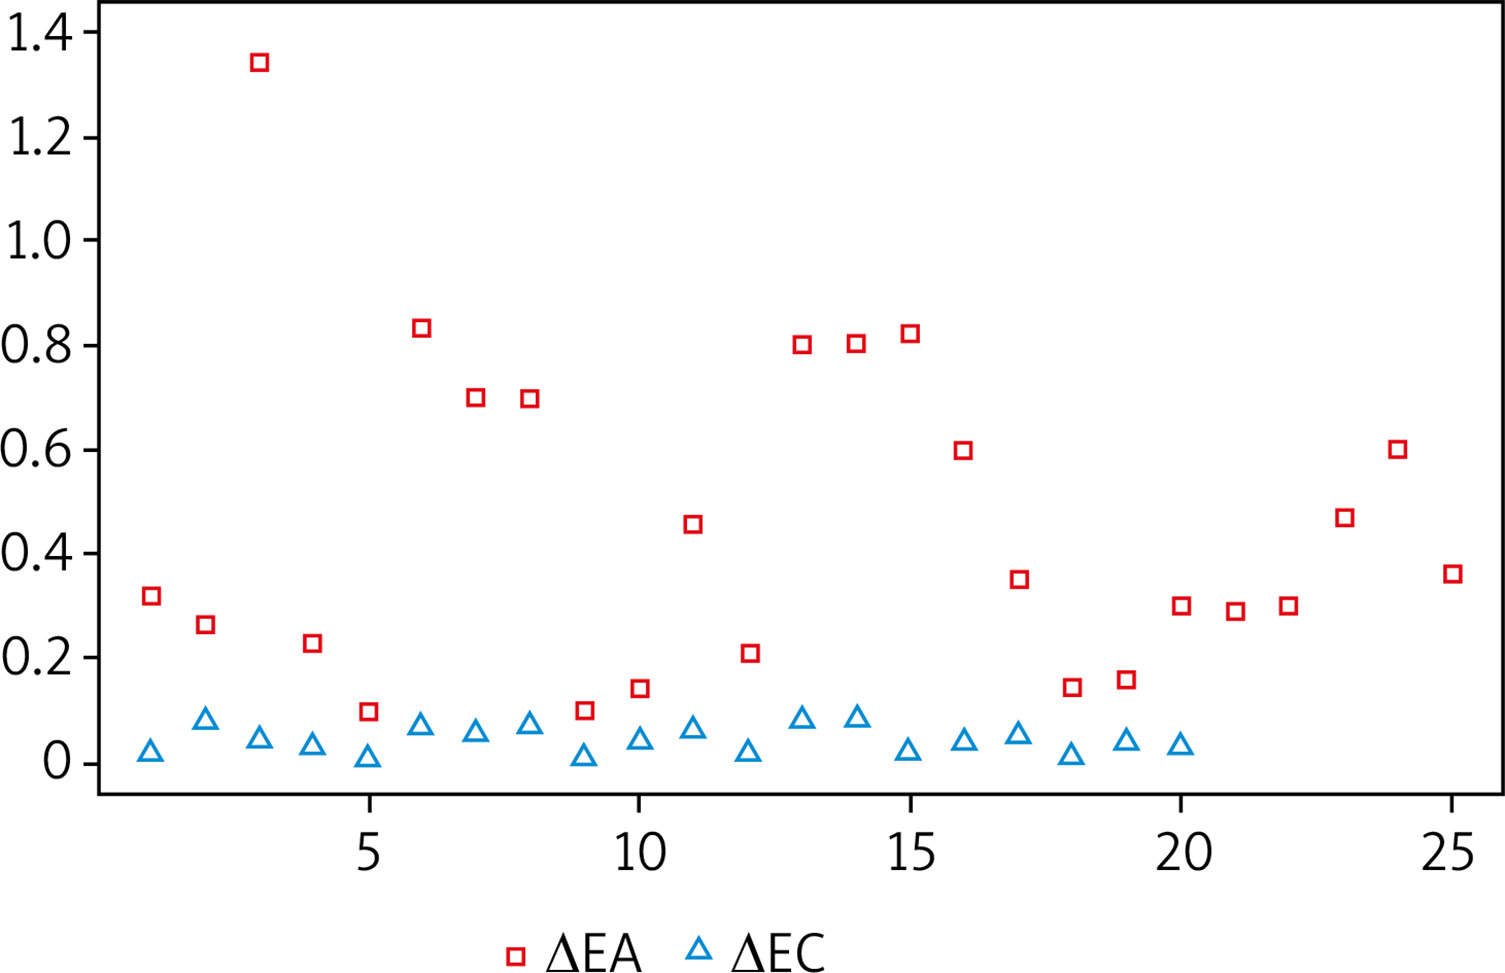
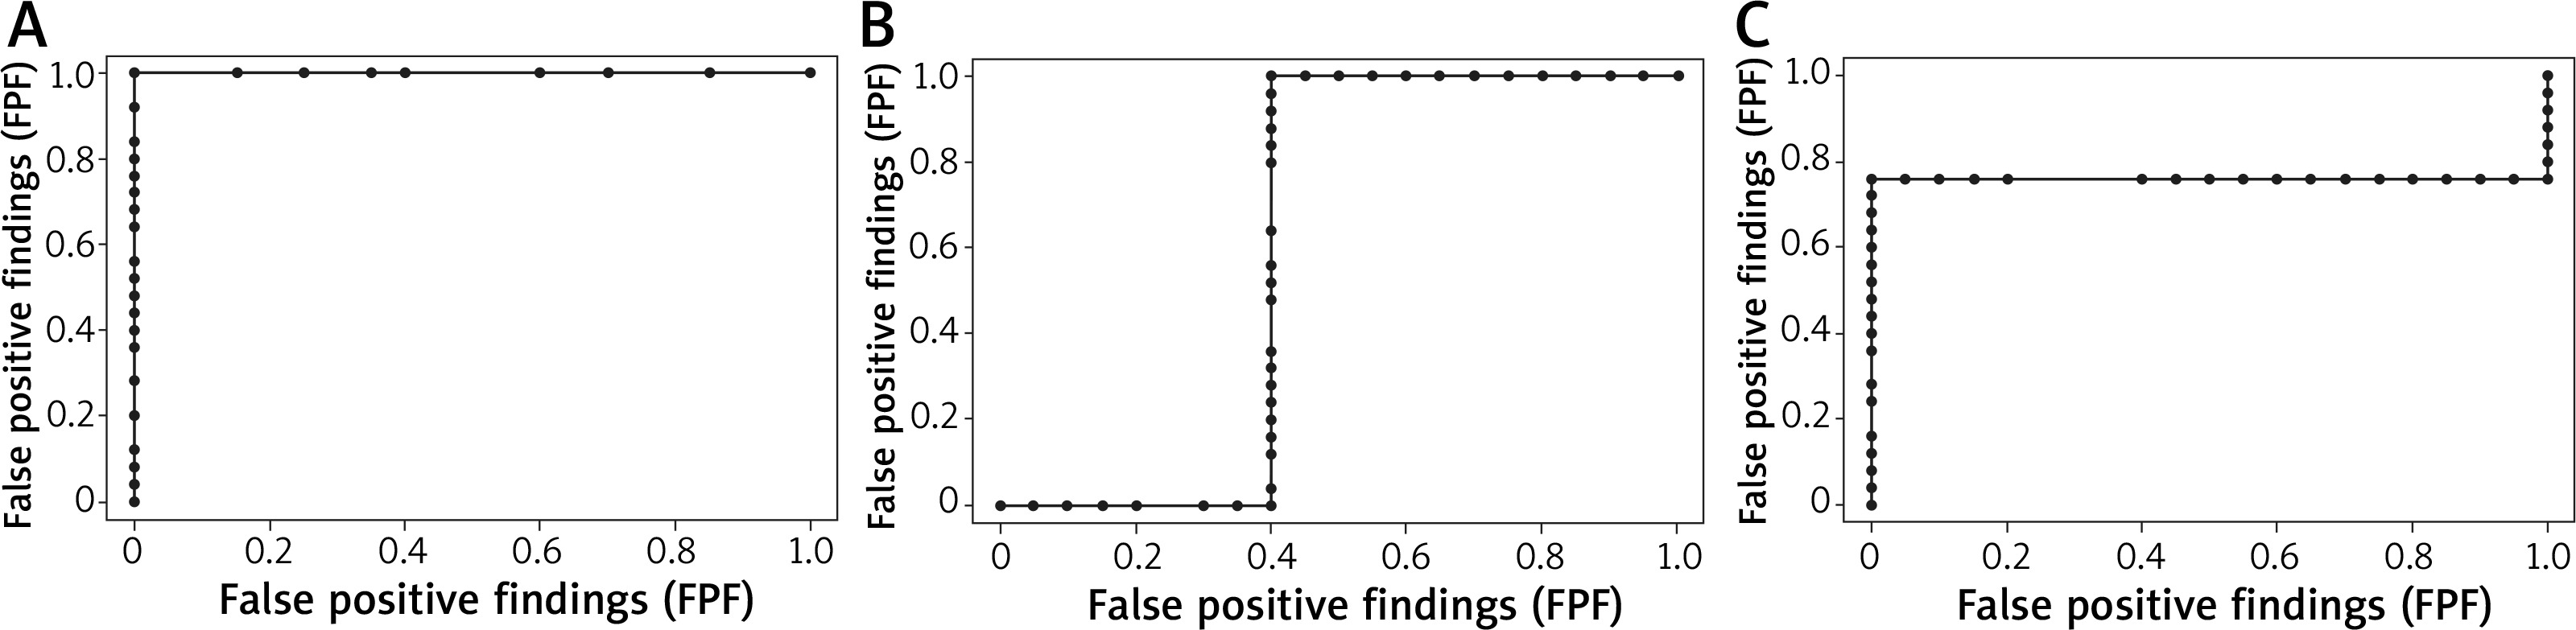
The symptoms predominant during the initial phase of the allergic reaction were itching and nasal obstruction (Figure 2). These varied significantly (p < 0.05) “over time”, with the majority of subjects reporting moderate-to-severe symptoms. Additional “extranasal” symptoms, such as itching of the palate, cough, and dyspnoea, were reported only in isolated cases, with no statistical significance. The two study groups differed significantly in terms of OD values (allergic rhinitis group vs. control group p = 1.165e-08, < 0.001). As nasal mucosal swelling was developing according to a subjective visual analog scale, the onset of the reaction (T1) was observed in the form of a distinct rise of the curve (there were no significant differences between the study groups) (Figure 3). The symptoms in the form of progressive nasal obstruction (measured with a visual analog scale) preceded those recorded with ORM at T1. The two study groups differed significantly in terms of maximum recorded nasal symptoms (T2), including nasal obstruction (p = 0.003085). The onset of the changes measured via ORM was recorded at 10.40 min after the assessment began, and the time to maximum symptoms (nasal obstruction) was recorded 53 s later. Due to spontaneous changes in nasal patency recorded in the control group, the cutoff OD value that marked a nasal mucosal reaction was set at an OD of 0.0430 (Table 1). In order to assess the usefulness of ORM in NAPT we analysed its specificity and sensitivity in terms of the following variables: ΔE, T1, and T2, with ORM showing the highest specificity and sensitivity in terms of ΔE, which perfectly differentiated the study groups (the patients diagnosed with allergic rhinitis and the controls) (Figure 4).
Discussion
The common aim of the objective nasal obstruction assessments used in NAPT is to assess the level of nasal mucosal swelling, which is measured at various phases of the reaction and considered in conjunction with subjective symptoms, thus providing a complete picture of the changes occurring in the nasal mucosa. Accurate interpretation of NAPT results relies on selecting the appropriate technique to objectively assess nasal obstruction. ORM seems to meet all the criteria expected from a good technique of nasal obstruction assessment thanks to its high specificity and sensitivity (our in-house study assessed the specificity and sensitivity of three ORM variables; T1, AUC = 0.6; T2, AUC = 0.76; OD, AUC = 1). This is the first study of this kind and it demonstrates a need for a deeper understanding of ORM in order to achieve its further standardization and promote its use in NAPT. The advantages of this assessment tool, i.e. a continuous measurement of changes in nasal obstruction without the need to ensure patient co-operation, make ORM particularly useful; this conclusion is consistent with earlier study reports. One such study conducted in 22 patients and a control group challenged with Alternaria and Aspergillus allergens demonstrated relatively good specificity and sensitivity for each allergen challenge individually (AUC = 0.48 and ORM = 0.53) [16]. The difference between those and our data seems to be due to the sample size. Therefore, there is an urgent need for further studies of this subject, with various assessment parameters. Our study indicates that the parameter of the highest specificity and sensitivity potential is the OD value, which corresponds to the degree of nasal obstruction. Unlike in the case of other objective techniques assessing nasal obstruction, such as acoustic rhinometry, rhinomanometry, or PNIF, for which the threshold of a definite positive response is clearly defined by European guidelines (CSA-2 change by ≥ 40% for acoustic rhinometry, flow reduction by ≥ 40% for rhinomanometry, and flow reduction by ≥ 40% for PNIF 2), in the case of the newly standardized ORM the relevant data vary widely. The main measure used in attempts to establish the threshold response of the nasal mucosa is OD. The available literature indicates a mean OD value that defines a positive NAPT response in adults to be 0.435 [13]. In our study the threshold OD value for the study group was similar at 0.4552. We must emphasize (based on the relevant literature) that the OD values used in NAPT depend on subject age. For instance, in children the OD value is approximately 0.37 [10] and in 61–80-year-olds it is 0.31 [12]. This difference is likely a result of the difference in the size of nasal structures, nasal mucosa thickness, and – in the case of the elderly population – vascular wall stiffness [17]. One of the issues that remains as yet unresolved is the reference value adopted as the threshold for a nasal mucosa response to local allergen provocation assessed via ORM. One possibility would be to adopt – based on our study results – the cutoff value (the nasal response achieved in the control group undergoing NAPT) at an OD of 0.0430 and, based on this value, calculate with mathematical formulas the mean change in infrared light absorbance. Another possibility would be to use the changes in nasal obstruction observed following a topical application of saline (in the experimental group, i.e. those allergic to common environmental allergens), like it is done when using other objective assessment techniques. Either way, comparisons with the baseline value (at time 0) seem ill-advised due to the phenomenon of the nasal cycle, which involves physiological fluctuations in nasal patency observed in all subjects (i.e. both in allergic rhinitis patients and controls).
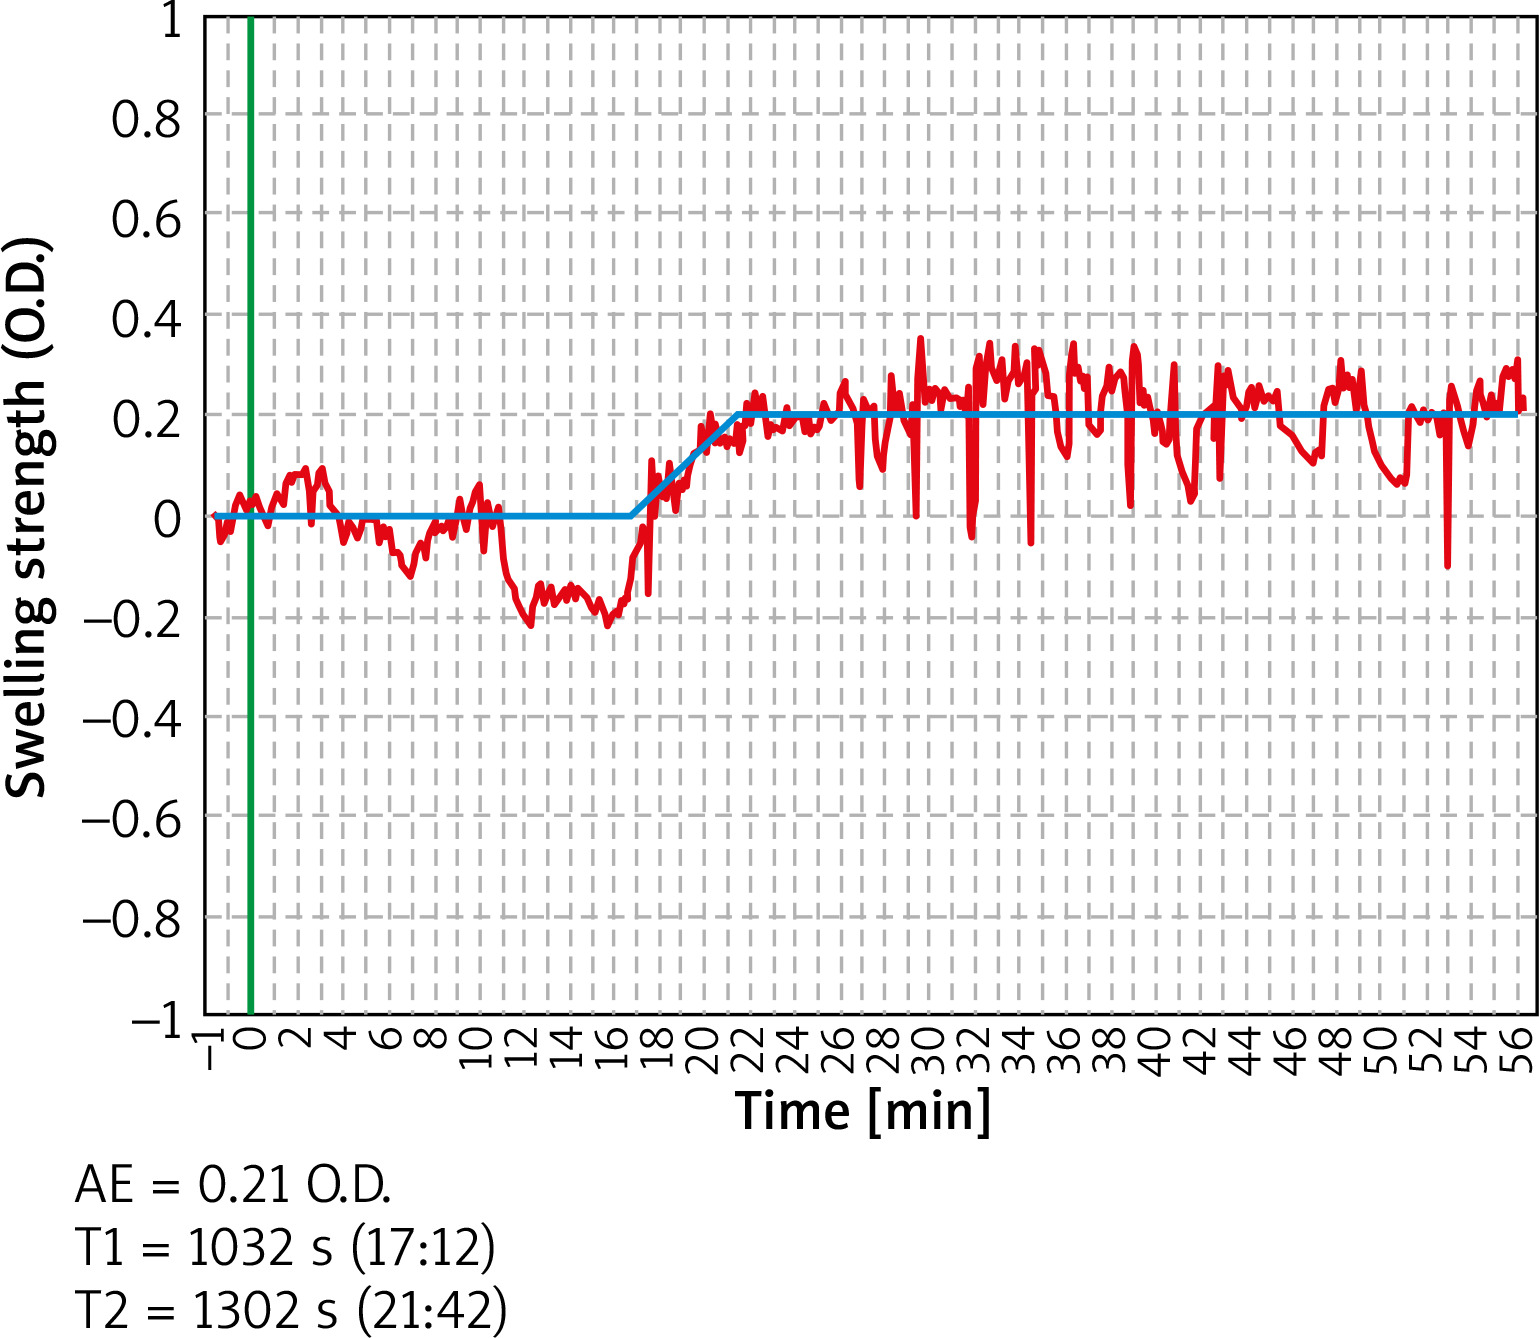
Other important parameters of NAPT assessment with the use of ORM are the onset (T1) and maximum level (T2) of the allergic response (Figure 5). Available literature reports indicate that the onset of the nasal mucosa response in the form of a change in the rhinometry curve reflecting an altered light absorbance is typically adopted to be at 120 s from the beginning of the assessment in children and at 330 s in adults [10, 11, 13]. Another major aspect to consider while using these values involves the time period when the data are being recorded (whether it is a continuous measurement from the moment the subject becomes acclimated to the laboratory environment and saline is applied nasally, with the observation involving the early phase of the allergic reaction, or a recording of only the phase following topical allergen application, without including any of the earlier stages). The method used in our study included recording all the stages of the assessment, and – interestingly – revealed that the onset of the allergic reaction (i.e. ORM-based increase in nasal obstruction) did not occur in the first seconds of the assessment, but rather at 10.40 min after topical allergen application, which explains to some extent the model course of NAPT. Hence the recommendation issued in the EAACI Position paper on the standardization of nasal allergen challenges is to record the objective changes in nasal obstruction during the early phase of an allergic reaction in 10-minute intervals [2]. The observed changes in nasal obstruction (both those observed in our study and reported by other authors) seem to illustrate certain minor fluctuations (which are also observed in the control group and are not statistically significant), which do not represent the onset of an allergic reaction (Figure 5). While interpreting the results of ORM assessments it is crucial to consider the curve that indicates the onset, maximum reaction, and infrared light absorbance represented by OD values. One undeniable challenge associated with the use of ORM in NAPT are artifacts in the form of bouts of sneezing or a runny nose, which accompany the early phase of an allergic reaction and – depending on their severity – may alter the rhinometry curve to a lesser or greater extent.
The capacity to assess the rate of changes in the level of nasal obstruction places ORM high in the ranks of objective techniques for assessing nasal obstruction. Our study indicates that the time from the onset of nasal mucosal reaction to its maximum point is only 53 s. This finding demonstrates a very rapid course of the early allergic reaction, which warrants describing this NAPT phenomenon as a localized anaphylactic reaction within the nasal mucosa. The early phase of an allergic reaction is characterized by a cascade of events triggered by the stimulation of certain cells (mast cells, macrophages), which are coated with immunoglobulins, and leads to the release of mediators, such as tryptase, histamine, CysLT, and PGD2 [1, 5, 7]. Subsequently, these mediators stimulate the local sensory nerve and vascular receptors within the nasal mucosa. Mastocytes release chemotactic factors and the platelet activating factor (PAF), which contribute to the development of inflammation [1, 7]. It is important to note that the observed change in nasal patency is only one out of many events accompanying the early phase of an allergic reaction. Other important events complementary to the changes in nasal patency are itching (which occurs within the first minute), sneezing and increased serous secretion (which occur within the second to third minute). The early phase of an allergic reaction typically lasts until 60 min after topical allergen application and subsequently continues into the late phase, which lasts 4–12 h and may be still perceptible to the subject (manifesting with less pronounced nasal congestion, runny nose, and sneezing) or completely asymptomatic [1].
Conclusions
Due to the amount of data it provides, ORM is an important assessment tool although its unique nature and the still relatively sparse literature coverage, call for further studies regarding its standardization. Not unlike exhaled nitric oxide assessments in NAPT, whose role has been repeatedly negated or questioned, ORM is also gaining popularity as a recommended tool for assessing the degree of nasal obstruction.


