
INTRODUCTION
Photoplethysmography (PPG) is a non-invasive diagnostic tool enabling the assessment of vascular perfusion in distal areas [1]. The method uses a probe emitting infrared light invisible to the eye with a length of 600–1200 nm, which is absorbed depending on the temporary volume of blood in the examined area [1, 2]. PPG allows to measure oxygen saturation, blood pressure and cardiac output, identification of peripheral vascular disorders and diagnosis of diabetic angiopathy [3]. The latest applications are based on digital image processing PPG to identify cardiac arrhythmias [4], monitoring patients with hypertension or diabetes [5, 6] and the early identification of microvascular changes in patients with coronavirus disease 2019 (COVID-19) [7].
Cutaneous lupus erythematosus (CLE) is a chronic inflammatory autoimmune disease of multifactorial etiology. In each form of CLE, there is a risk of progression to systemic lupus erythematosus (SLE) at any stage of the disease [8–11]. Its development is influenced by genetic predisposition, environmental factors and immune system interactions leading to endothelial damage [12, 13].
There are only a few reports in the literature regarding the usefulness of PPG in SLE [14–16]. Microcirculatory disturbances and endothelial dysfunction have been observed in these patients [14, 15]. As a consequence of vascular obstruction, abnormalities in PPG waveforms are also seen in patients with secondary Raynaud’s phenomenon [16, 17]. To date, there are no reliable studies documenting changes in PPG in patients with CLE.
OBJECTIVE
This study was conducted to assess the usefulness of PPG in the evaluation of patients with CLE, including varieties, severity, and activity of the disease.
MATERIAL AND METHODS
The study group consisted of 70 adults, 56 (80%) women and 14 (20%) men. The mean age was 52 ±15.2 years (range: 25–85 years), 52.6 ±14.7 for women (25–83) and 49.7 ±17.6 for men (28–85). The mean disease duration was 9.3 ±8.3 years (1–37). Patients with isolated CLE (who did not meet the SLE criteria according to Systemic Lupus International Collaborating Clinics (SLICC) and EULAR/ACR criteria [9, 18, 19]) and patients with CLE who met the criteria for the diagnosis of SLE were enrolled in the study. The study did not include patients with SLE without skin symptoms. Also, non-specific variants of LE have not been studied. The study population was divided into 2 main groups, SLE and CLE. The study included 2 patients with acute cutaneous lupus erythematosus (ACLE) who met the criteria for SLE and were therefore included in the SLE group. The diagnosis of SLE was made based on the SLICC criteria and EULAR/ACR criteria [18, 19]. The diagnosis of CLE was confirmed by histopathological examination in each patient [9, 11].
Sixteen patients, including 13 women (81.2%) and 3 men (18.8%), were assigned to the SLE group. The mean age of the patients was 47.4 ±15.3 years (range: 25–82), and the mean disease duration was 9.6 ±8.3 years (range: 1–29). Based on the Systemic Lupus Erythematosus Disease Activity Index (SLEDAI), disease activity ranged from 2 to 15, with an average score of 9.56 ±3.32 points [20].
ACLE was diagnosed in 2 patients (12.5%), discoid lupus erythematosus (DLE) in 10 patients (62.5%), and subacute lupus erythematosus (SCLE) in 4 patients (25%). No coexistence of different CLE forms was observed in any of the patients. The mean CLASI-A score was 7.88 points (range: 0–26), and the mean CLASI-D score was 4.50 points (range: 0–13) (table 1) [21].
Table 1
Descriptive statistics of Cutaneous Lupus Erythematosus Disease Area and Severity Index in patients with systemic lupus erythematosus and cutaneous lupus erythematosus, including subtypes
| Study group | CLASI-A | CLASI-D | ||||
|---|---|---|---|---|---|---|
| Min. | Max. | Mean | Min. | Max. | Mean | |
| SLE | 0 | 26 | 7.88 | 0 | 13 | 4.50 |
| CLE | 0 | 27 | 5.70 | 0 | 23 | 4.59 |
| CCLE | 0 | 17 | 4.73 | 0 | 23 | 4.17 |
| SCLE | 0 | 27 | 8.77 | 0 | 20 | 5.92 |
54 patients, 43 (79.6%) women and 11 (20.4%) men, were assigned to the group with isolated form of CLE. Within this group, two subtypes were distinguished: chronic cutaneous lupus erythematosus (CCLE) and SCLE. The mean age of the patients was 53.4 ±15.0 years (range: 25–85), and the mean disease duration was 9.3 ±8.3 years (range: 1–37). The mean CLASI-A score was 5.70 points (range: 0–27), and the mean CLASI-D score was 4.59 points (range: 0–23) (table 1). The isolated CCLE subgroup included 41 patients, 32 (78%) women and 9 (22%) men. The mean age of patients was 50.3 ±3.7 years (range: 26–75) and the mean duration of the disease was 9.4 ±7.6 yeas (range: 1–31). The mean CLASI-A value was 4.73 points (range: 0–17), CLASI-U 4.17 points (range: 0–23) (table 1). 25 (61%) patients were diagnosed with DLE, 11 (26.8%) with DDLE, 4 (9.7%) lupus erythematosus tumidus (LET), and 1 (2.4%) with lupus erythematosus profundus (LEP).
The SCLE subgroup included 13 patients, 11 women (84.6%) and 2 men (15.4%). The mean age was 63.2 ±15.2 years (range: 25–85), and the mean disease duration was 8.8 ±6.0 years (range: 1–37). The mean CLASI-A score was 8.77 points (range: 0–27), and the mean CLASI-D score was 5.92 points (range: 0–20) (table 1).
The control group consisted of 20 healthy adult volunteers, 15 (75%) women and 5 (25%) men, with no personal or family history of autoimmune connective tissue diseases or other autoimmune disorders. Additional exclusion criteria included diseases that could affect microcirculation, such as diabetes mellitus, hypertension, cancer, or pulmonary diseases; use of medications influencing microcirculatory function; smoking; and pregnancy. The mean age in the control group was 47.4 ±14.6 years (range: 22–75), with a mean age of 50.1 ±14.0 years (range: 24–75) among women and 39.4 ±14.8 years (range: 22–63) among men.
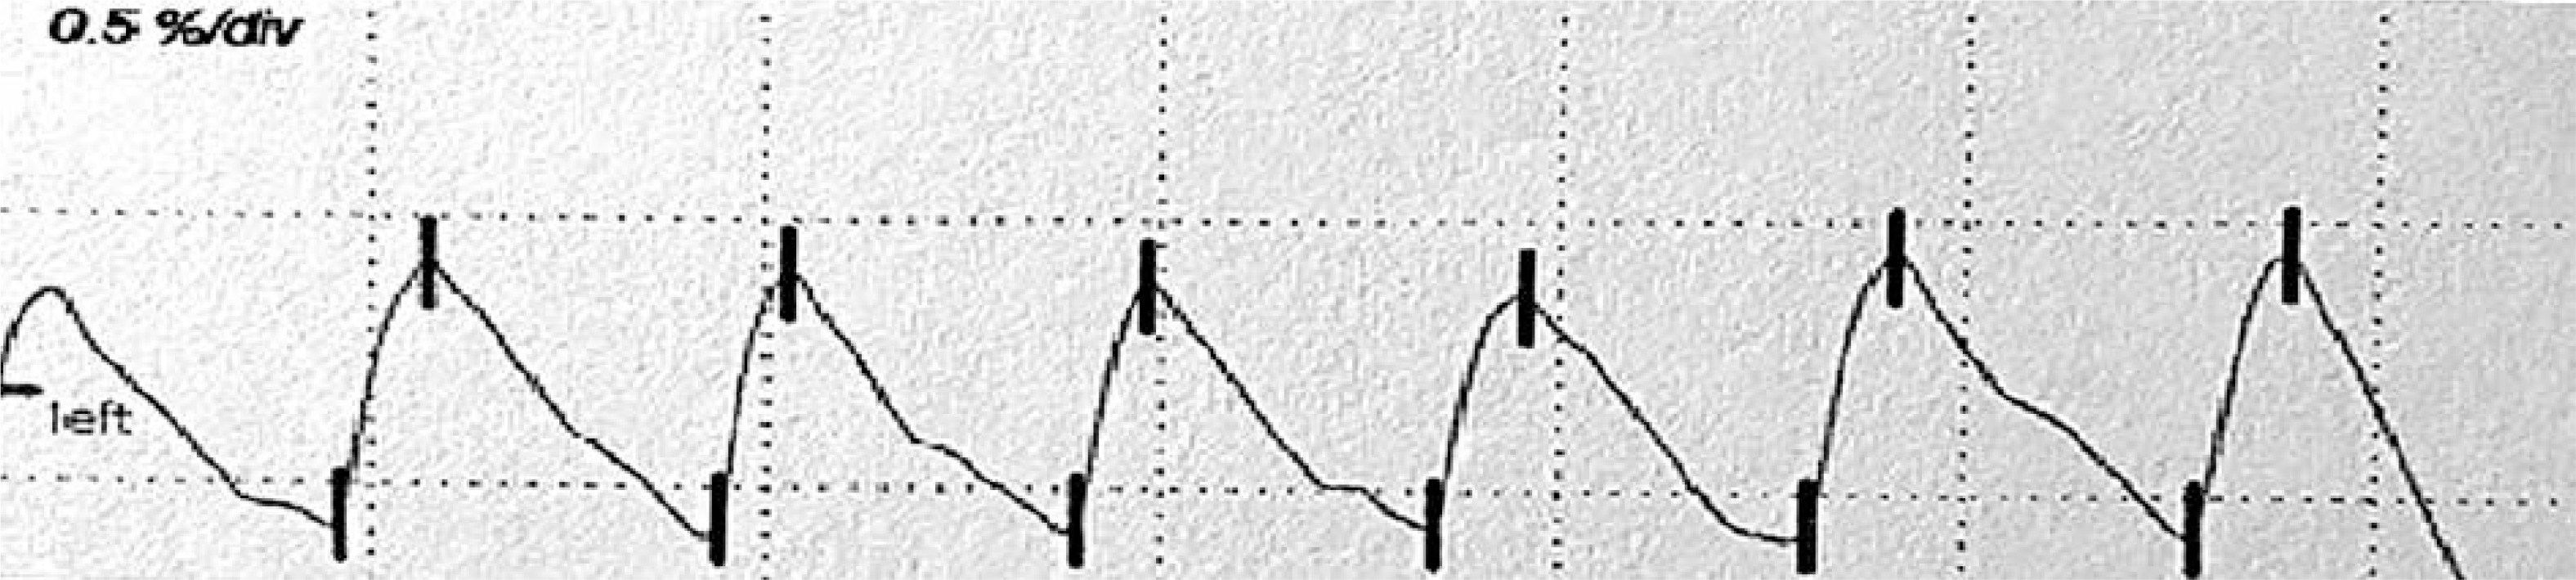
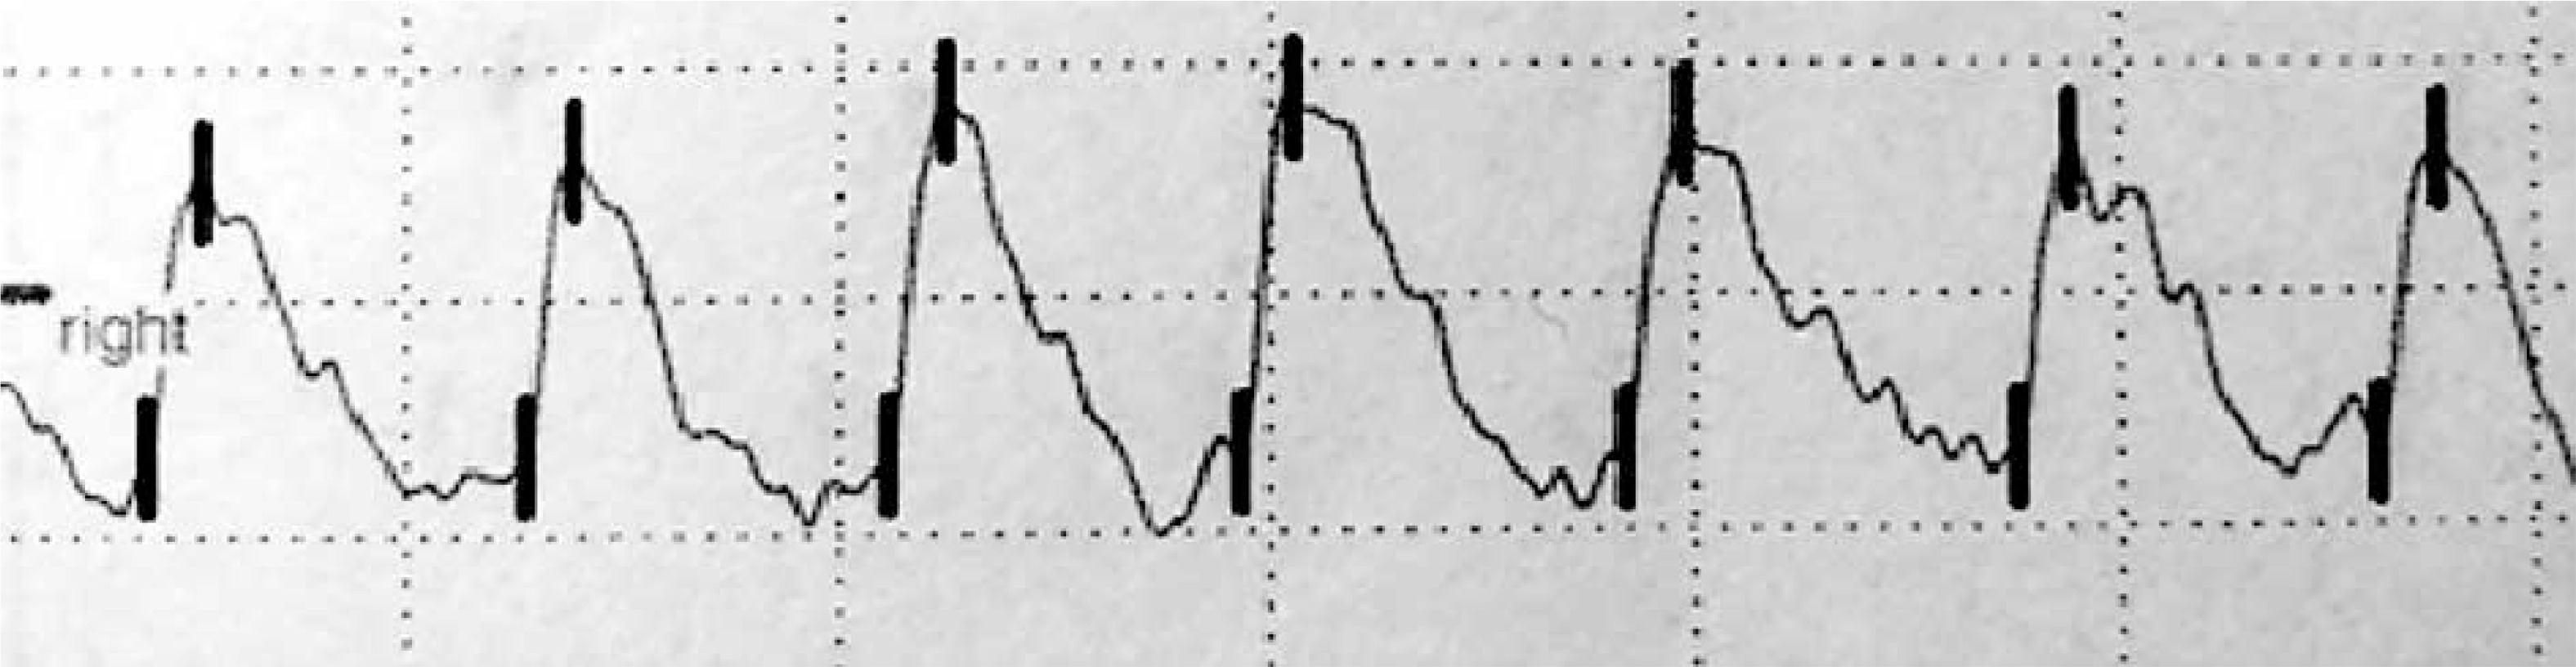
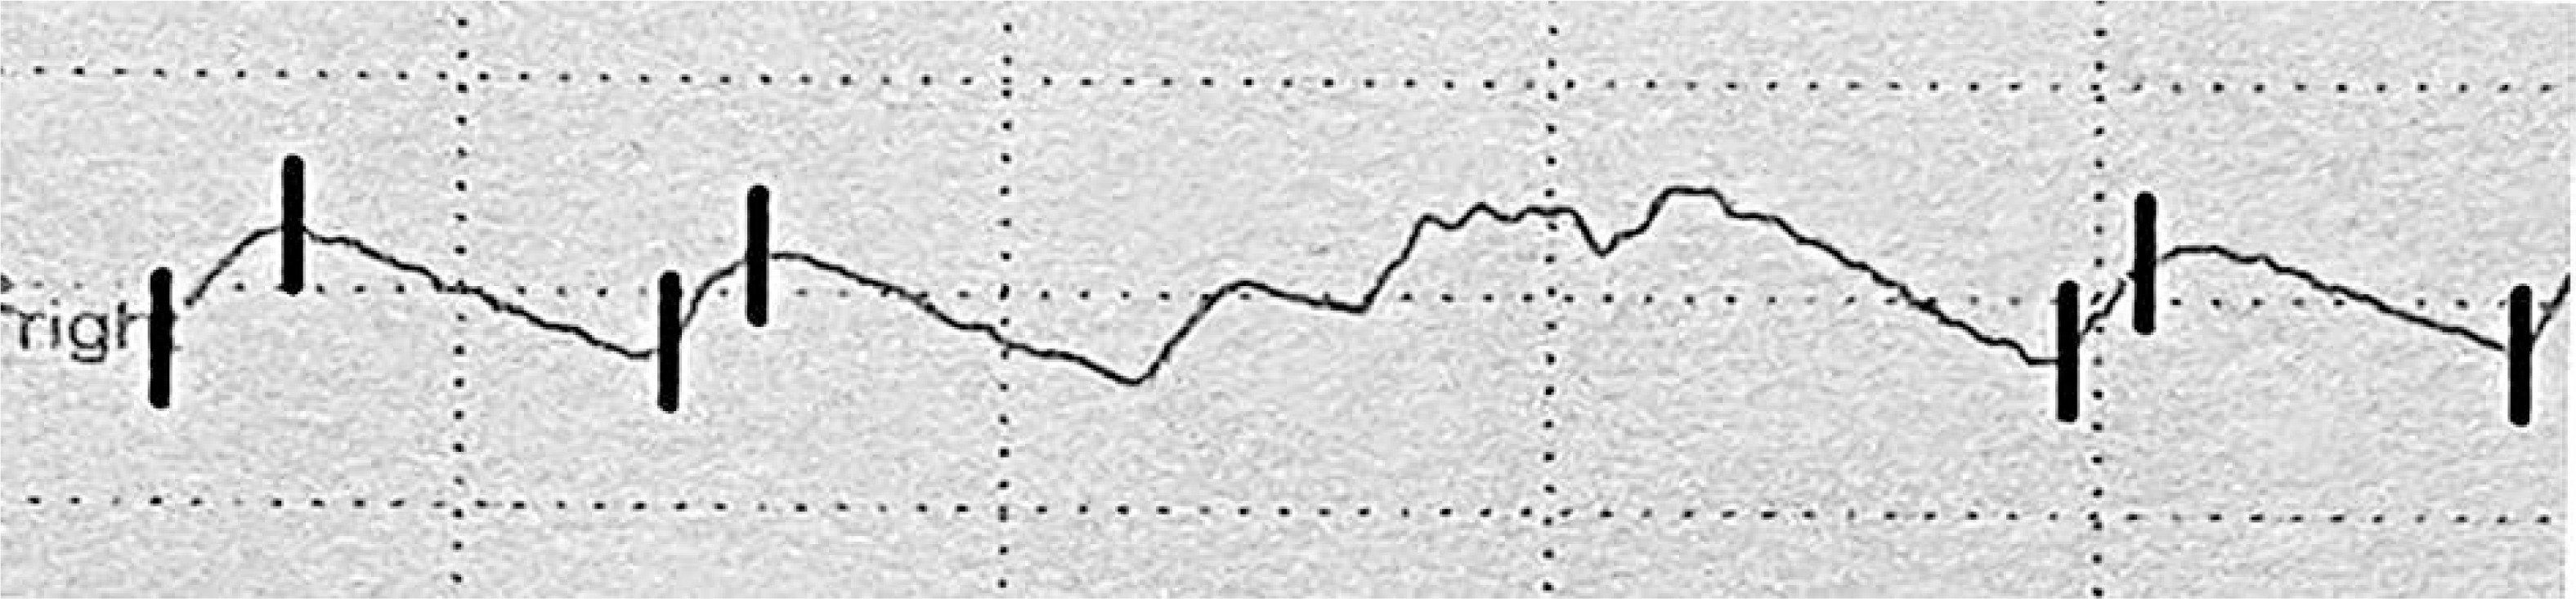
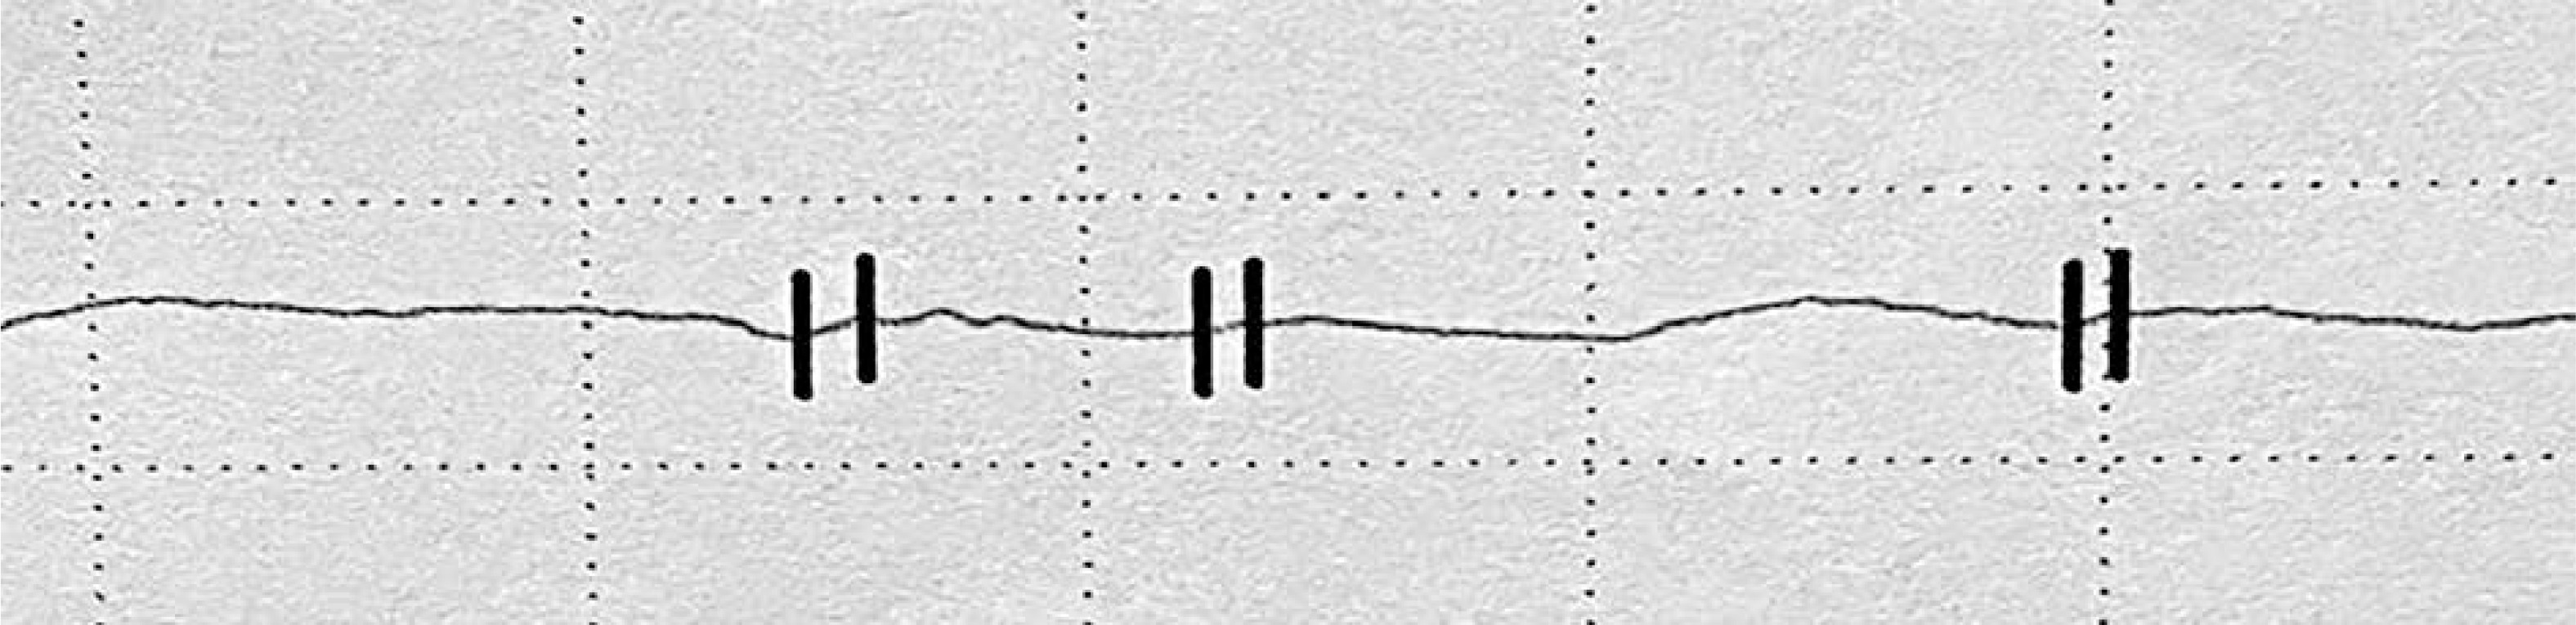
The examination was carried out using the Rheoscreen Medis photoplethysmograph with a light function, within all fingers of both hands. Before the examination, the patient remained in a warm room for several minutes at constant temperature of 20–22°C to equalize the fingers’ temperature. Then the patient was placed in a sitting position and advised to avoid muscle tension or body movement during the study to eliminate artifacts caused by venous blood displacement. All fingers were examined by applying electrodes symmetrically within both hands. The four types of photoplethysmographic pulse wave were evaluated according to Schüler [1]: 1 – normal , 2 – showing the limited perfusion of the acral areas, 3 – showing microangiopathy, 4 – showing significant flow disturbances, including arterial occlusion (figs. 1–4).
In order to assess the severity of changes in photoplethysmography, patients were classified into 4 groups, taking into account the number of fingers in which abnormal PPG waves were found:
I – no deviation: normal photoplethysmographic wave in each finger,
II – low severity of changes: abnormal photoplethysmographic wave type 2, 3 or 4 in 1–3 fingers,
III – average severity of changes: abnormal photoplethysmographic wave type 2, 3 or 4 in 4–6 fingers,
IV – high severity of changes: abnormal photoplethysmographic wave type 2, 3 or 4 in ≥ 7 fingers.
Statistical analysis
In the last stage, statistical analysis by R program (R Foundation for Statistical Computing, Wirtschaftsuniversität Wien, Austria) was performed. The results were considered statistically significant at p < 0.05. In order to characterize individual groups, descriptive statistics of patient age and disease duration were presented: arithmetic mean, standard deviation, as well as minimum and maximum values. Welch’s t-test, F-test and Pearson c2 test were performed to compare individual characteristics in the study group and the control group.
RESULTS
The percentage of different types of photoplethysmographic waves in particular study groups is presented in table 2.
Table 2
Types of the photoplethysmographic waves in particular groups
| Group | N | Wave type | |||||||
|---|---|---|---|---|---|---|---|---|---|
| n | % | ||||||||
| 1 | 2 | 3 | 4 | 1 | 2 | 3 | 4 | ||
| LE | 70 | 67 | 53 | 14 | 5 | 95.7 | 75.7 | 20.0 | 7.1 |
| CLE | 54 | 54 | 38 | 7 | 2 | 100.0 | 70.4 | 13.0 | 3.7 |
| SLE | 16 | 13 | 15 | 7 | 3 | 81.2 | 93.8 | 43.8 | 18.8 |
| CCLE | 41 | 41 | 27 | 5 | 1 | 100.0 | 65.9 | 12.2 | 2.4 |
| SCLE | 13 | 13 | 11 | 2 | 1 | 100.0 | 84.6 | 15.4 | 7.7 |
| Control | 20 | 20 | 7 | 4 | 0 | 100.0 | 35.0 | 20.0 | 0.0 |
When all types of photoplethysmographic waveforms observed in the study and control groups were analyzed, statistically significant differences were found between patients with CLE and SLE (p = 0.038), as well as between CCLE and SLE (p = 0.035). The difference between SLE and the control group approached statistical significance (p = 0.055) (table 3).
Table 3
Significance in the frequency of occurrence of different waves types
| Compared groups | P-value | |
|---|---|---|
| LE | Control | 0.225 |
| CLE | SLE | 0.038 |
| CLE | Control | 0.293 |
| SLE | Control | 0.055 |
| CCLE | SCLE | 0.836 |
| CCLE | Control | 0.392 |
| SCLE | Control | 0.286 |
| CCLE | SLE | 0.035 |
| SCLE | SLE | 0.456 |
Given the prevalence of each wave type in each study group and the control group, in SLE, unlike isolated forms of CLE and CCLE, the normal wave was observed significantly less frequently (p = 0.011 and p = 0.029), but the wave showing microangiopathy was observed significantly more often (p = 0.019 and p = 0.024). The wave showing the limited perfusion of the acral areas was observed significantly more often in the LE group (p = 0.002), in CLE (p = 0.012), in SLE (p = 0.001), in CCLE (p = 0.045) and in SCLE (p = 0.015) than in the control group. In the control group a wave showing significant flow disturbances, including arterial occlusion, was not observed (p = 0.499) (table 4). The results of analysis of differences in the severity of changes in PPG are shown in table 5.
Table 4
Significance of differences in the frequency of occurrence of each type of wave separately
Table 5
Severity of photoplethysmographic disturbances in particular groups
| Group | N | PPG group | |||||||
|---|---|---|---|---|---|---|---|---|---|
| n | % | ||||||||
| I | II | III | IV | I | II | III | IV | ||
| LE | 70 | 16 | 22 | 22 | 10 | 22.9 | 31.4 | 31.4 | 14.3 |
| CLE | 54 | 15 | 20 | 14 | 5 | 27.8 | 37.0 | 25.9 | 9.3 |
| SLE | 16 | 1 | 2 | 8 | 5 | 6.2 | 12.5 | 50.0 | 31.2 |
| CCLE | 41 | 13 | 18 | 7 | 3 | 31.7 | 43.9 | 17.1 | 7.3 |
| SCLE | 13 | 2 | 2 | 7 | 2 | 15.4 | 15.4 | 53.8 | 15.4 |
| Control | 20 | 11 | 7 | 2 | 0 | 55.0 | 35.0 | 10.0 | 0.0 |
In the control group, compared to the LE study group, the changes in the PPG examination were significantly lower (p = 0.012), as compared to the group of patients with SLE (p < 0.001). Significantly greater intensity of changes was also observed in patients with isolated forms of SCLE in relation to patients with isolated forms of CCLE (p = 0.030), as well as in relation to the control group (p = 0.005). Statistically significant differences were observed also between the SLE group and isolated CLE (p = 0.010) and isolated CCLE (p = 0.001) groups. In other analyses, the differences did not reach statistical significance. High intensity of changes was not found in any person from the control group (table 6).
DISCUSSION
According to the literature, disturbances in the shape of the PPG wave reflect the small vessel vascular flow dysfunction. Unfortunately, there is no standardized study interpretation scheme. Presence of a dicrotic notch and a rounded, distinct top of the wave is a desirable symptom. In turn flattening of the wave, its unequal amplitude and the disappearance of the dicrotic notch define the incorrect variant [1, 22–24]. In this paper, the types of curves proposed by Schüler were adopted as the most optimal assessment scale [1].
Preliminary analysis of differences in the severity of changes in the PPG study, according to the author’s classification, taking into account the number of abnormal waves, showed the greatest deviations in patients with SLE – abnormalities were not found only in 1 (6.2%) patient, while in 2 (12.5%) low severity of changes, in 8 (50%) average severity of changes, and in 5 (31.2%) high severity of changes were observed. There was no correlation between the severity of changes and the SLEDAI scale. These results are consistent with the observations of Ghosh and Biswas, who, in their PPG analysis of 10 patients with SLE, found flow disturbances in all subjects but no correlation with disease activity or duration [14]. The examination was carried out in all fingers of the upper and lower limbs. In 6 patients, decreased vascular flow was found in 12 (60%) fingers, in 4 in 8 fingers (40%). In 2011, Kudaravalli described PPG abnormalities in 32 patients with SLE, such as increased arterial stiffness, which, according to the author, indicates endothelial dysfunction [15]. The PPG parameters normalized after treatment with N-acetylcysteine and atorvastatin.
Due to the limited data available in the literature, we attempted in the present study to assess the frequency of occurrence of all types of PPG waveforms in each study group and to compare them with the control group. In our analysis, the greatest deviations in PPG were observed in patients with SLE compared to those with CLE and the control group. In our study, we observed the greatest deviations in PPG in patients with SLE as compared to the CLE and control group. This may indicate more common microvascular disturbances in the SLE group. Among patients with CLE, the greatest intensity of changes in PPG concerned patients with SCLE. There was no relationship between the severity of deviations and CLASI-A.
It is worth mentioning that in the literature there is one report from the late 1950s on PPG in patients with DLE, where no significant differences in vascular flow were found compared to the control group [25]. However, reduced vascular flow was observed in patients with SLE compared to the control group, but without statistical significance. The characteristic PPG wave pattern was not defined either for DLE or for SLE. However, the study was conducted on a small group of patients, and the authors’ distinction between different forms of LE may be questioned. On the other hand, in a study involving 5 patients exposed to vinyl chloride with Raynaud’s phenomenon, a correlation of abnormalities in angiography with non-invasive tests was demonstrated, e.g. PPG waves were markedly flattened, with rapidly rising and slowly falling pulse segments, indicating arterial occlusion, as well as waves rounded upwards, without any dicrotic notch, which showed the occlusion of the smaller arterial trunks, but compensated by collaterals of larger diameter [26]. Previous studies have also suggested that some patients with impaired microvascular flow may not show PPG abnormalities, particularly when larger vessels are able to maintain sufficient blood supply to the distal phalanges [27]. In 2014, Valdovinos and Landry again emphasized the value of PPG in the assessment of microcirculation in patients with primary and secondary Raynaud’s phenomenon accompanying autoimmune diseases of the connective tissue, e.g. SLE. Researchers showed that in patients with secondary Raynaud’s phenomenon, the PPG waveform was different, while in patients with primary Raynaud’s phenomenon no deviations were found [16].
CONCLUSIONS
Patients with SLE are characterized by significantly greater intensity of changes in PPG than patients with CLE and CCLE, what may indicate more common microvascular disturbances in the SLE group. In patients with SCLE, the intensity of deviations in the PPG is significantly greater than in CCLE, and according to the literature, the greatest risk of progression to SLE is reported in patients with SCLE [11]. Deviations in PPG also occur in healthy people, but their intensity is significantly lower than in patients with LE. Moreover, in patients with SLE, a normal wave is observed significantly less frequently while a wave indicating microangiopathy is observed significantly more often than in patients with CLE and CCLE, which may indicate the usefulness of photoplethysmography in overall evaluation of LE at the stage of distinguishing between CLE in the course of systemic disease and the isolated form of CLE. Due to the risk of progression to SLE, it is necessary to increase diagnostic vigilance in CLE patients with PPG abnormalities. Perhaps periodic repetition of the examination and observation of the possible intensification of deviations as a function of time may contribute to a faster diagnosis of the progression of an isolated skin disease to SLE. However, it is necessary to deepen research in this direction on larger groups.