
Introduction
Basal cell carcinoma (BCC) has a slow growth rate, minimal soft tissue invasiveness, and a high cure rate. Occasionally, BCC can behave aggressively, invading deep tissues, and potentially having metastatic behaviour. Nodular and superficial BCC subtypes are classically acknowledged as non-aggressive or less aggressive BCCs (nBCC), while more aggressive BCCs (aBCC) include the following patterns: metatypical, micronodular and infiltrative or morpheaform [1].
The association between the prognosis of solid tumours and the p53, Ki-67, and Bcl-2 biomarker expression has not been fully elucidated. The tumour suppressor p53 is the most frequently mutated gene in human cancers, and its inactivation is the second most frequent event following upregulation of the Hedgehog signalling pathway in BCC [2]. Several studies on p53 expression in BCCs reported a significantly greater expression of p53 in the aggressive groups, stating that p53 immunoexpression is an important prognostic factor for these tumours [3].
Expression of the nuclear protein Ki-67 is associated with cell proliferation. It has been used as a marker of tumour aggressiveness in solid tumours and some haematological malignancies. The prognostic implications of Ki-67 have been examined in numerous well-established studies [4, 5].
A key regulator of the mitochondrial apoptotic pathway is Bcl-2, favouring cell survival by inhibiting adapters necessary for the activation and cleavage of caspases. It promotes cell viability without promoting cell proliferation [6].
Previous studies have described that Bcl-2 is highly expressed in several hematologic and solid malignancies. However, recent evidence suggests that Bcl-2 is an independent favourable prognostic marker in basal cell carcinoma, breast cancer, and non-small cell lung cancer [7–10].
Aim
This study aimed to investigate the clinicopathological features and immunohistochemical expressions of p53, Ki-67, and Bcl-2 in cutaneous basal cell carcinoma focusing on histological subtypes. Their roles and possible interactions in the development and progression of BCC are discussed.
Material and methods
Data and specimen selection
A cross-sectional study was carried out in the Dermatology Service of Civil Hospital of Guadalajara from June 2018 to June 2019, where a total of 50 BCCs from 50 patients from Western Mexico were analysed and grouped by histological subtype. Samples were excluded if there was insufficient material, over-fixed material, or artefact by the process. Clinical data including gender and age at diagnosis were recorded. This study was approved by the local ethics committee and the institutional review board.
Histopathologic examination
The histopathological subtypes were re-confirmed and in tumours with mixed histological subtypes, the predominant component was recorded. Additional variables such as desmoplasia, Clark level, solar elastosis and pigment deposition were also evaluated. The haematoxylin-eosin stained sections of all samples were reviewed by two experienced pathologists (D.E.V) to determine the histological subtype and then immunohistochemistry expression was graded.
Immunohistochemistry
Immunohistochemical staining of p53, Ki-67 and Bcl-2 was performed using automated staining with the Benchmark ULTRA system (Ventana Medical Systems, AZ, USA). For each BCC, a 4 µm thick section of paraffin was mounted on a Menzel SuperFrost Plus adhesive slide and the manufacturer’s specifications were followed using the Ventana Ultraview System. The antibodies used were the CONFIRM mouse monoclonal anti-Bcl-2 antibody 124 (Ventana), primary anti-p53 antibody Bp53-11 (Ventana) and CONFIRM rabbit anti-Ki-67 monoclonal primary antibody 30-9 (Ventana).
All slides included positive controls and the omission of the primary antibody was used as a negative control.
Expression grading
Cytoplasmic positivity for Bcl-2 and nuclear positivity for Ki-67 and p53 were evaluated. Only histological areas that presented the neoplasm were assessed. The staining intensity was classified from 0 to 3 (0 for negative staining, 1 for weak staining, 2 for moderate staining, and 3 for strong staining). Positivity was determined by observing all slides at low power (40×) and then randomly selecting three fields at high power (400×) to estimate an average percentage of immunolabelled positive cells. Disparities in percentages were solved by digital imaging analysis with QuPath software version 0.2.2 [10]. Percentage positivity was ranked from 0 to 4; 0 (no positive cells), 1 (< 10% of positive cells), 2 (10–50% of positive cells), 3 (51–80% of positive cells) and 4 (> 80% of positive cells). The sum of the ordinal scores for percentage and intensity of immunostaining allowed obtaining an expression score from 0 to 7, where 0–3 was considered as a low expression and 4–7 as a high expression.
Ethics
Institutional ethics committee registration number: 024/20. This study was performed in line with the principles of the Declaration of Helsinki.
Statistical analysis
The relationship between biomarker expression and the clinicopathological features were analysed using the Fisher’s exact test. Multinomial linear regression was conducted to recognize the association between the biomarkers ki-67, p53 and Bcl-2 and the rest of the variables. A correlation test was used to estimate the degree of association between variables. Statistical significance was considered with a value of p < 0.05. Data were analysed using IBM SPSS® statistics version 25 (Armonk, New York, USA).
Quality assessment
The Reporting Recommendations for Tumor Marker Prognostic Studies (REMARK) guidelines were used to evaluate manuscripts’ quality in order to enhance the possibilities of comparing results across studies involving molecular biomarkers [11].
Results
Clinico-pathological data
A total of 50 BCC samples from 50 patients were included, from June 2018 to June 2019. Clinicopathological results are shown in Table 1.
Table 1
Clinical and histological characteristics (n = 50)
Biomarker expression
High expression of p53 was found in 30 (60%) samples and low expression in 20 (40%) samples. High expression of ki-67 was found in 33 (66%) samples and low expression in 17 (34%) samples. High expression of Bcl-2 was found in 24 (48%) samples and low expression in 26 (52%) samples.
The immunohistochemical patterns evaluated as low (0–3) and high (4–7) expressions between non-aggressive BCCs and aggressive BCCs are shown in Figure 1. Representative immunohistochemical expressions are shown in Figure 2.
Figure 1
Immunohistochemical expression patterns in aggressive and non-aggressive (less aggressive) groups
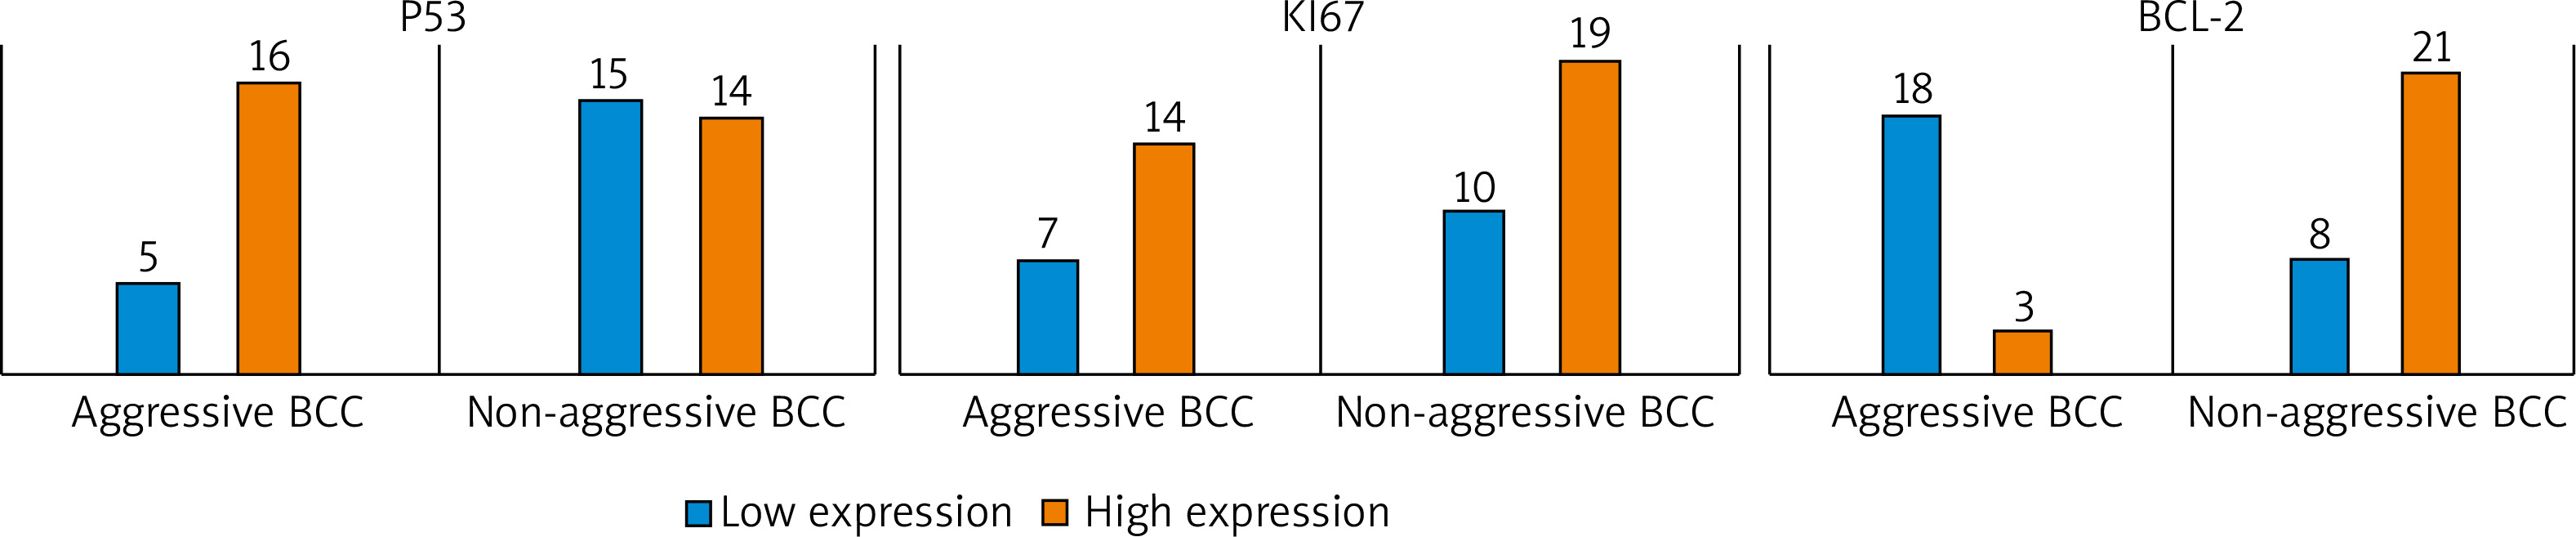
Figure 2
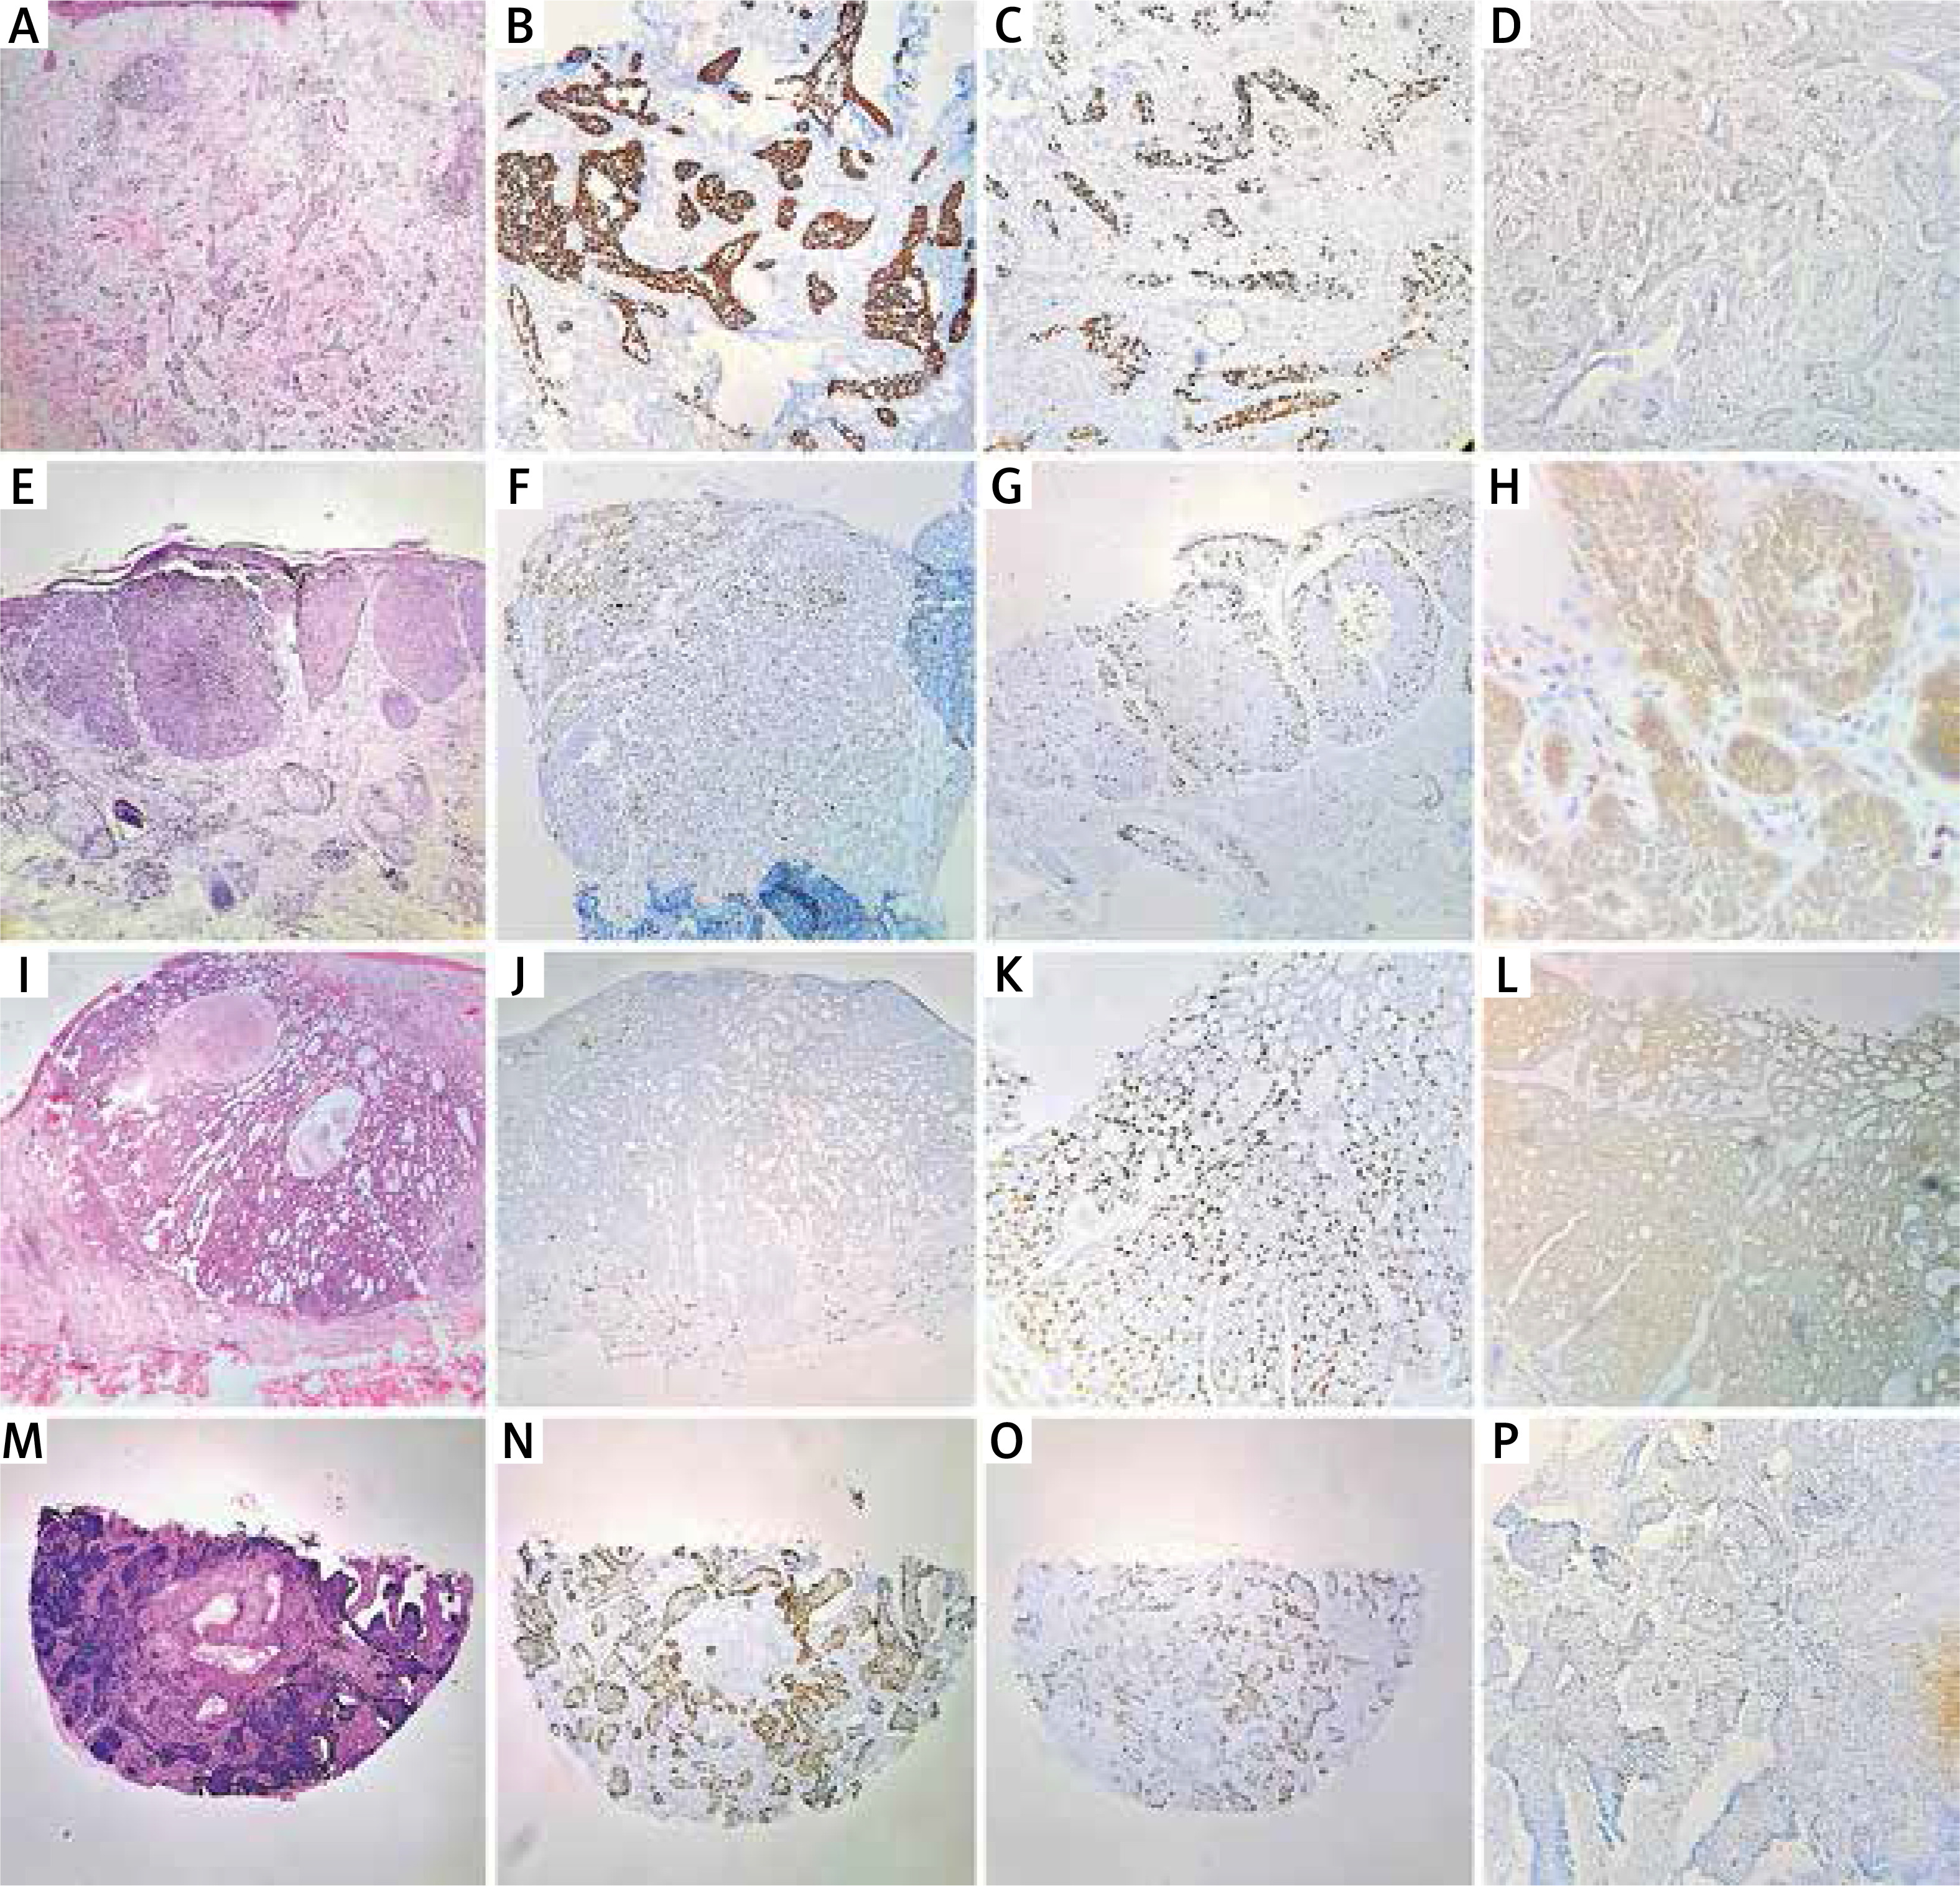
Representative images of immunohistochemical expression of p53 (B, F, J, N), Ki-67 (C, G, K, O) and Bcl-2 (D, H, L, P) in infiltrative morpheaform basal cell carcinoma (A), nodular basal cell carcinoma (E), adenoid basal cell carcinoma (I) and infiltrative morpheaform basal cell carcinoma (M). A, E, G, I, J, M, N, O – 40×, B, C, D, F, K, L – 100×, H – 400×
Relationship and association of biomarker expression and clinicopathological variables
We observed a statistically significant association when BCCs were grouped as non-aggressive and aggressive subtypes for p53 (p = 0.04) and Bcl-2 (p < 0.01). No statistical association was found between Ki-67 and tumour aggressiveness. No statistical association was found between histological variables and biomarkers (Table 2).
Table 2
Relationship of immunostaining results for aggressive and non-aggressive groups of BCCs
| Biomarker | Expression | Total | Non-aggressive BCCs | Aggressive BCCs | P-value* |
|---|---|---|---|---|---|
| p53 | Low High | 20 30 | 15 (75) 14 (46.6) | 5 (25) 16 (53.4) | 0.04 |
| Ki-67 | Low High | 17 33 | 10 (58.8) 19 (57.5) | 7 (41.2) 14 (42.5) | 0.93 |
| Bcl-2 | Low High | 26 24 | 8 (30.7) 21 (87.5) | 18 (69.3) 3 (12.5) | < 0.01 |
Multinomial logistic regression analysis showed that the expression of Ki-67, p53 and Bcl-2 was statistically associated with the aggressiveness of the tumour. Compared with BCCs with low Bcl-2 expression, BCCs with high expression of Bcl-2 were obviously associated with a non-aggressive subtype (OR = 8.79; 95% CI: 3.21–61.9, p = 0.01). In addition, the odds ratio for associating a low expression of p53 (as compared to a high expression of p53) with a non-aggressive BCC was significant (OR = 6.4; 95% CI: 1.17–23.9, p = 0.006).
On the other hand, the probability of associating a high level of ki-67 (compared to a low level of ki-67) with a low aggressiveness was significant (OR = 2.96; 95% CI: 0.39–8.78, p = 0.05). Given that the latter value presents a borderline p-value, it should be taken with caution. There was no statistical significance with age, histological subtype, pigment deposition, desmoplasia or Clark level (Table 3).
Table 3
Multinomial logistic regression analysis
| Low BCL-2a | B | Std. error | Wald | P-value | OR (odds ratio) | 95% confidence interval for OR | ||
|---|---|---|---|---|---|---|---|---|
| Lower bound | Upper bound | |||||||
| Low Ki-67 | Age | –0.04 | 0.027 | 2.20 | 0.13 | 0.96 | 0.91 | 1.01 |
| Histological subtype | –0.72 | 0.69 | 1.09 | 0.29 | 0.48 | 0.13 | 1.87 | |
| Sola elastosis | 1.44 | 1.14 | 1.6 | 0.21 | 4.2 | 0.45 | 36.02 | |
| Pigment deposition | –0.57 | 0.96 | 0.35 | 0.56 | 0.57 | 0.086 | 3.73 | |
| Clark level | –0.46 | 0.68 | 0.47 | 0.49 | 0.63 | 0.16 | 2.39 | |
| Desmoplasia | 0.61 | 0.57 | 0.65 | 0.42 | 1.84 | 0.42 | 8.16 | |
| Aggressive BCCs | 1.08 | 0.66 | 2.68 | 0.101 | 2.93 | 0.81 | 10.6 | |
| High Ki-67 | Age | –0.007 | 0.022 | 0.11 | 0.74 | 0.99 | 0.95 | 1.04 |
| Histological subtype | 0.29 | 0.51 | 0.33 | 0.57 | 1.34 | 0.49 | 3.65 | |
| Sola elastosis | 0.49 | 0.94 | 0.27 | 0.60 | 1.63 | 0.26 | 10.39 | |
| Pigment deposition | –0.25 | 0.87 | 0.092 | 0.762 | 0.77 | 0.14 | 4.23 | |
| Clark level | 0.12 | 0.57 | 0.05 | 0.83 | 1.13 | 0.37 | 3.49 | |
| Desmoplasia | –0.25 | 0.584 | 0.18 | 0.67 | 0.78 | 0.25 | 2.46 | |
| Aggressive BCCs | 1.08 | 0.55 | 3.8 | 0.05 | 2.96 | 0.39 | 8.78 | |
| Low p53 | Age | –0.026 | 0.025 | 1.11 | 0.29 | 0.97 | 0.93 | 1.02 |
| Histological subtype | 0.145 | 0.591 | 0.60 | 0.81 | 1.16 | 0.36 | 3.68 | |
| Sola elastosis | 1.08 | 1.04 | 1.09 | 0.29 | 2.94 | 0.39 | 22.36 | |
| Pigment deposition | –0.205 | 0.95 | 0.047 | 0.83 | 0.82 | 0.13 | 5.23 | |
| Clark level | –0.43 | 0.66 | 0.43 | 0.51 | 0.65 | 0.18 | 2.35 | |
| Desmoplasia | –0.019 | 0.65 | 0.001 | 0.97 | 0.98 | 0.274 | 3.52 | |
| Aggressive BCCs | 1.86 | 0.67 | 7.6 | 0.006 | 6.4 | 1.17 | 23.9 | |
| High p53 | Age | –0.013 | 0.022 | 0.357 | 0.550 | 0.98 | 0.94 | 1.03 |
| Histological subtype | –0.101 | 0.52 | 0.037 | 0.85 | 0.90 | 0.32 | 2.52 | |
| Sola elastosis | 0.44 | 0.99 | 0.19 | 0.66 | 1.55 | 0.22 | 10.89 | |
| Pigment deposition | –0.67 | 0.88 | 0.58 | 0.45 | 0.51 | 0.09 | 2.86 | |
| Clark level | 0.13 | 0.58 | 0.05 | 0.82 | 1.14 | 0.37 | 3.56 | |
| Desmoplasia | 0.105 | 0.616 | 0.029 | 0.87 | 1.11 | 0.33 | 3.72 | |
| Aggressive BCCs | 0.63 | 0.56 | 1.26 | 0.26 | 1.88 | 0.62 | 5.69 | |
| High bcl2 | Age | –0.03 | 0.025 | 1.77 | 0.18 | 0.97 | 0.92 | 1.01 |
| Histological subtype | –0.07 | 0.59 | 0.016 | 0.89 | 0.93 | 0.29 | 2.93 | |
| Sola elastosis | 1.43 | 1.02 | 1.98 | 0.16 | 4.19 | 0.57 | 30.7 | |
| Pigment deposition | –0.68 | 0.92 | 0.56 | 0.46 | 0.51 | 0.08 | 3.04 | |
| Clark level | –0.298 | 0.64 | 0.22 | 0.64 | 0.74 | 0.21 | 2.6 | |
| Desmoplasia | 0.149 | 0.66 | 0.05 | 0.82 | 1.17 | 0.321 | 4.48 | |
| Aggressive BCCs | 2.64 | 0.76 | 12.3 | 0.01 | 8.79 | 3.21 | 61.9 | |
Correlation between Bcl-2, p53, and Ki-67 expression and clinicopathological characteristics
A correlation test among biomarker expression and clinicopathological features was performed. Bcl-2 showed a significant negative correlation with age (correlation coefficient = –0.308, p ≤ 0.05) (Table 4).
Table 4
Correlation among biomarker expression and clinicopathological features
| Age | Ki-67 biomarker | p53 biomarker | Bcl-2 biomarker | Clark level | |
|---|---|---|---|---|---|
| Age | – | 0.144 | 0.069 | –0.308* | –0.088 |
| Ki-67 biomarker | 0.144 | – | 0.103 | –0.071 | –0.032 |
| p53 biomarker | –0.069 | 0.103 | – | –0.114 | 0.137 |
| BCL-2 biomarker | –0.308* | –0.071 | –0.114 | – | –0.231 |
| Clark level | –0.088 | 0.157 | 0.144 | –0.236 | – |
Discussion
BCC histological subtypes considered aggressive are particularly more complicated to treat due to subclinical extension, local destruction, and unfavourable biologic behaviour with higher recurrence rates. In addition, histologic subtypes of BCC that include morpheaform, micronodular, and metatypical patterns, are more likely to metastasize [12, 13].
Increased nuclear staining for mutant p53 reflects a loss of function of p53. In sporadic BCCs, inactivating mutations in the TP53 gene have been found in 50% of BCCs [14]. Our analysis of p53 expression revealed a statistical association with tumour aggressiveness. These findings are consistent with Oana et al. [15] who found that infiltrative BCCs had higher p53 expression in comparison to the nodular subtype (p = 0.054). Likewise, Shamsimeymandi et al. [3] assessed p53 expression between aBCC and nBCC and found a significantly higher expression in the aggressive groups. In addition, Brito et al. [16] reported a higher expression in recurrent BCC and infiltrative BCC than the normal epidermis. Mutations of p53 may also have an impact on BCC treatment. A recent study of p53 expression found that cell lines that displayed mutations of p53 were more resistant to imiquimod-induced apoptosis [17]. Moreover, p53 expression was also associated with BCC resistance to photodynamic therapy (PDT) [18].
In our study, the number of tumour cells in BCC expressing Ki-67 antigen exhibited wide variation, and a high expression was found independent of the histological subtype. These findings are consistent with Shamsimeymandi et al. [3] who evaluated an equivalent number of cases amongst most histological subtypes (n = 22 aBCCs vs. 20 nBCCs) and found no difference in Ki-67 expression. However, Khalesi et al. [19] evaluated nBCC and found a significantly higher expression of Ki-67 in the superficial subtype compared to the nodular subtype. Interestingly, Yerebakan et al. [20] found strong differences (p < 0.0001) of expression in recurrent tumours but not between histological subtypes.
Our results concerning Bcl-2 are consistent with previous data, where nBCC had a higher expression. Like our study, all following studies found a significant difference between the two groups, with the expression being the highest in nBCCs and lowest in aBCCs. Ramdial et al. [21] reported a low Bcl-2 expression in all of their aBCCs compared to nBCCs (p < 0.02). Zagrodnik et al. [22] examined recurrent tumours in patients treated with radiotherapy and found a significant correlation between low Bcl-2 expression and aBCCs (p = 0.0169) but not with recurrences. Sivrikoz et al. [9] included more samples of aBCCs (n = 77) than nBCC (n = 23). The contrast of Bcl-2 expression in aBCC and nBCC in our study suggests that they form a complex group of tumours that differ considerably in morphologic and biological behaviour, despite the common origin of these tumours from basal stem cells [23]. In the context of these previous studies, our findings suggest that a high expression of Bcl-2 might be a favourable prognosis factor. This can be explained by the finding that although Bcl-2 inhibits apoptosis it may also slow cell growth [24]. It is known that ultraviolet (UV) radiation induces downregulation of Bcl-2 in vivo and in vitro [25]. A recent study concluded that apoptosis in BCC does not involve BAX and that the apoptotic activity of BCCs is regulated by either less common members of the BCL2 gene family or a BCL2 gene family independent pathway [26]. The increase in genetic mutations induced by UV or other carcinogens together with a spontaneous or UV-induced downregulation of Bcl-2 may result in aggressive biological behaviour in BCCs. UV chronic exposure could explain our findings of the correlation between older age and lower Bcl-2 expression.
Conclusions
We have found that a high expression of Bcl-2 and a low p53 expression is associated with more indolent histopathological features with better outcomes. Our results suggest that analysis of p53 and Bcl-2 expression in BCC patients may provide useful prognostic information. However, the clinical implications of these interactions in BCC need to be critically evaluated.


