
Introduction
The allergic process taking place in the human system is a manifestation of immunological hypersensitivity to contact with various environmental allergens [1, 2].
The discovery of immunoglobulin E (IgE), produced in the human body as a result of contact with various environmental allergens, made it possible to understand the pathogenetic mechanisms leading to the development of the allergic process [3–5]. The possibility of quantitative and qualitative determination of the level of IgE in human blood serum enables recognizing the type of sensitization of the organism and the type of allergic disease. Assessment of the level of immunoglobulin E in the blood serum of the patient also helps to differentiate the allergic disease between atopic (IgE-dependent) and non-atopic (IgE-independent) [1–5].
Atopic people are burdened with a hereditary/family predisposition of the organism to excessive production of immunoglobulin E in contact with a harmful allergen. The total pool of IgE which is the source of allergen-specific antibodies (asIgE), capable of recognizing a specific allergen, may be 10–100 times higher in them than in healthy people [2, 4, 6].
One of the diagnostic methods for detecting the sensitization of IgE-dependent organism are Skin Prick Tests (SPT), a standardized method of testing the reactivity of the skin after it has been exposed to an allergen. A positive result of this test confirms that someone is sensitized to a specific allergen(s). In epidemiological studies, skin prick tests (SPT) offer the possibility to confirm or exclude the sensitization to a specific allergen(s) in the study population [7–12].
In our studies on the frequency and type of IgE-dependent sensitization in the Polish children and adolescents from the north-eastern region of Poland, the SPT test was used as a tool to identify sensitization to selected food and airborne allergens [13, 14].
Aim
Retrospective, comparative analysis of the frequency of IgE-dependent sensitization to food and airborne allergens in a group of children and adolescents from the north-eastern region of Poland, in selected years of the study (1998, 2003, 2008, 2012).
Long-term evaluation of the incidence of IgE-dependent sensitization depending on the age of the patients studied during the period of 1998-2012.
Material and methods
A total of 6577 children and adolescents aged up to 18 years with a suspected allergic disease, referred to the Department of Paediatrics, Gastroenterology and Allergology, the Medical University of Bialystok, Poland, for further diagnosis, were studied in 1998, 2003, 2008, and 2012.
Skin prick testing (SPT) with selected food allergens (trophoallergens) and airborne allergens was used to evaluate the sensitization process of patients recruited to this study between 1998 and 2012 (Allergopharma Skin Prick Test solutions). A positive result of sensitization was defined when the patient had at least one positive skin prick test with the allergen studied [13, 14].
The skin prick tests were done after written consent had been obtained from the parents.
The dynamics of the process of sensitization of the study patients by some environmental allergens was assessed in 1998-2012. The retrospective analysis consisted in comparing the frequency (percentage) of sensitization to food and airborne allergens in particular years of the research: 1998, 2003, 2008, and 2012.
Due to the different age distribution of the children examined in particular years (1–18 years of life), direct standardization was used in the calculations [15]. The age distribution of the subjects from 1998 was adopted as the standard population to calculate the actual percentage of sensitizations at a given age [13, 14].
The value of positive SPT results for at least one allergen per 100 patients tested was calculated using the formula: number of subjects with a positive SPT result (N1) divided by the number of subjects (N) × 100. To analyse the frequency of sensitization in 1998–2012 in the examined patients in relation to their age, the Spearman’s rank correlation coefficient was determined.
Results
The percentage of sensitization to food and airborne allergens in 1998–2012
Over 14 years (1998 vs. 2012), a significant increase was found in the percentage of patients sensitized to at least one allergen (without specifying the allergen type) from 35.3% to 40.4% (p = 0.0025). There was also a significant increase in the percentage of patients sensitized to food allergens only, from 5.1% to 13.1%, and a marked increase in the percentage of patients sensitized to at least one food allergen from 10.5% to 20.1% (p < 0.0001).
Contrary to sensitization to food allergens, such a trend was not observed in individual years of the research in relation to airborne allergens (without specifying the allergen type): 1998 – 22.7% vs. 2012 – 20.2%, except for 2003. In this year the percentage of patients sensitized to airborne allergens only increased to 30.7% vs. 1998 – 22.7% (p < 0.0001) as well as the percentage of sensitized to at least one airborne allergen increased significantly to 39.3% vs. 1998 – 28.2% (p < 0.0001).
In the years compared (1998 vs. 2012), an increase was also observed in the percentage of patients sensitized to both food and airborne allergens (5.5% vs. 8.5%) (p = 0.0009).
Comparison of the percentage of sensitization to food and airborne allergens in the study group in the years: 1998 vs. 2003, 2003 vs. 2008, 2008 vs. 2012 is presented in Table 1.
Table 1
The percentage of sensitization to food and airborne allergens in the studied years
Long-term assessment of the frequency of sensitization in the patients studied, depending on their age, in 1998–2012
The sensitization prevalence to at least one allergen (without specifying the allergen type) is presented in Figure 1.
Figure 1
The sensitization prevalence to at least one allergen in 1998–2012, depending on the age of the patients (without specifying the allergen type) (Spearman’s rank correlation coefficient R = 0.598; p = 0.0088)
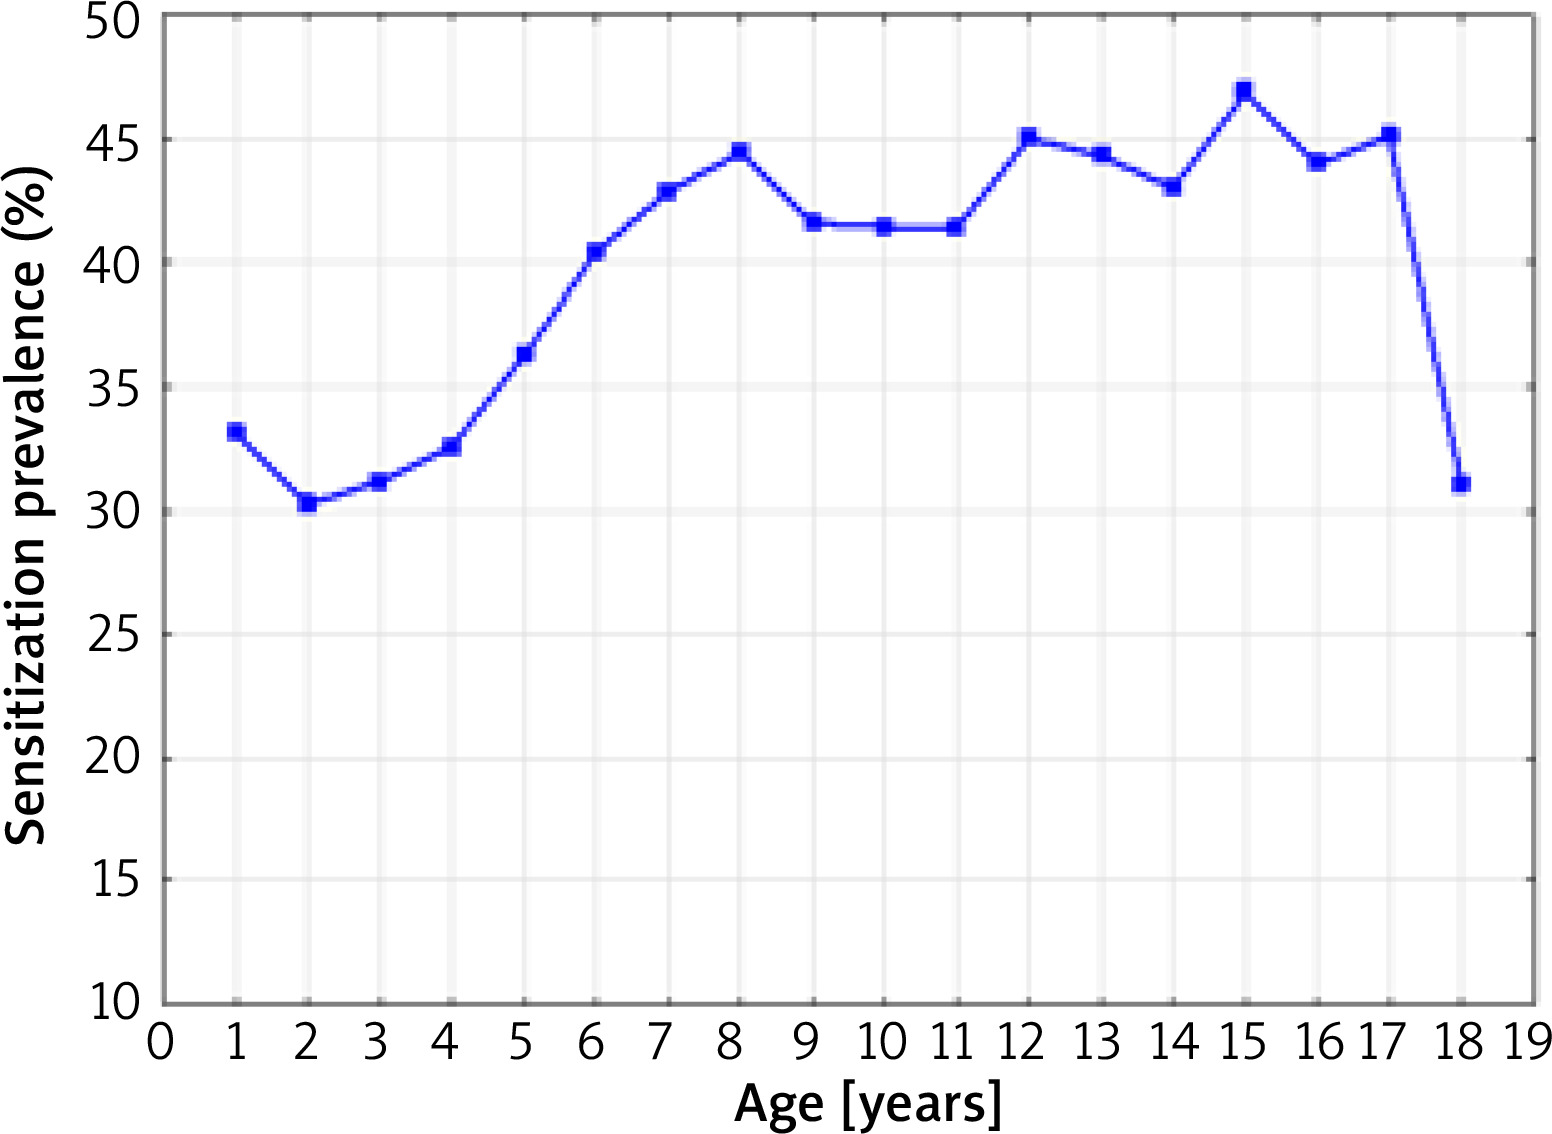
A statistically significant correlation was found between the age of the studied patients and a positive test result for at least one allergen (without specifying the allergen type) over the 14-year period of the research (Spearman’s rank correlation coefficient R = 0.598; p = 0.0088). The lowest percentage of positive SPT results for at least one allergen was found in 2-year-old children (30.2%), the highest in 15-year-old children (46.8%). The small number of patients in the 17–18 age group was caused by the systematic transfer of these patients to the specialist care of an outpatient clinic for adults.
The sensitization prevalence to at least one food allergen in 1998–2012 depending on the age of the patients is presented in Figure 2.
Figure 2
The sensitization prevalence to at least one food allergen in 1998–2012 depending on the age of the patients (Spearman’s rank correlation coefficient R = –0.17; p = 0.49)
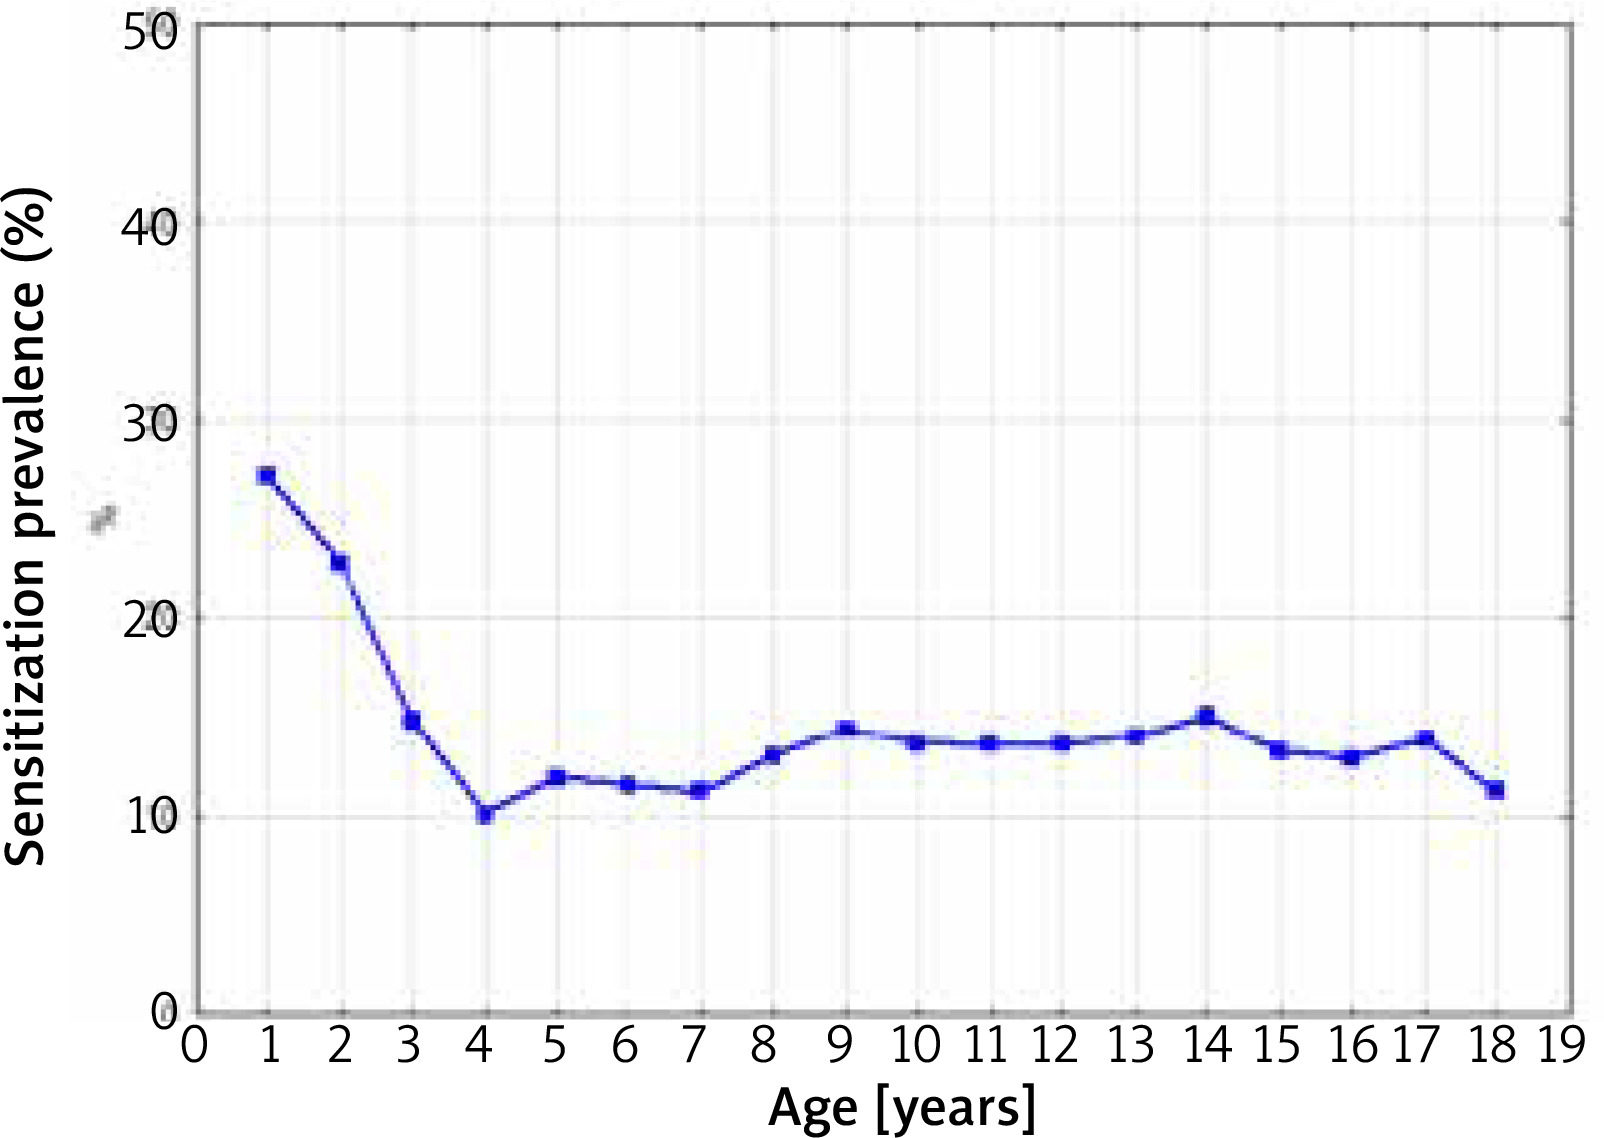
The highest percentage of positive SPT results for at least one food allergen was observed in children > 1 year of age (28.5%). There was a significant important decrease in the frequency of sensitization between the ages of 1 and 3. After the third year of life, despite the increase in the age of the patients, the percentage of a sensitized patients remained at the constant level of 10.0–14.0% (Spearman’s rank correlation coefficient R = –0.17; p = 0.49).
In children up to 2 years of age, sensitization to animal origin allergens predominated: egg white 28.5%, egg yolk 14.5%, cow’s milk 11.7%, and beef 8.4%.
In children over 6 years of age, sensitization to plant trophoallergens dominated: soybean 15.3%, wheat flour 14.9%, and sesame 12.9%.
The various food allergen contribution in positive SPT results, regardless of the age of the patients studied, is presented in Figure 3.
Figure 3
The various allergen contributions to positive SPT results for food allergens, regardless of the age of the patients studied
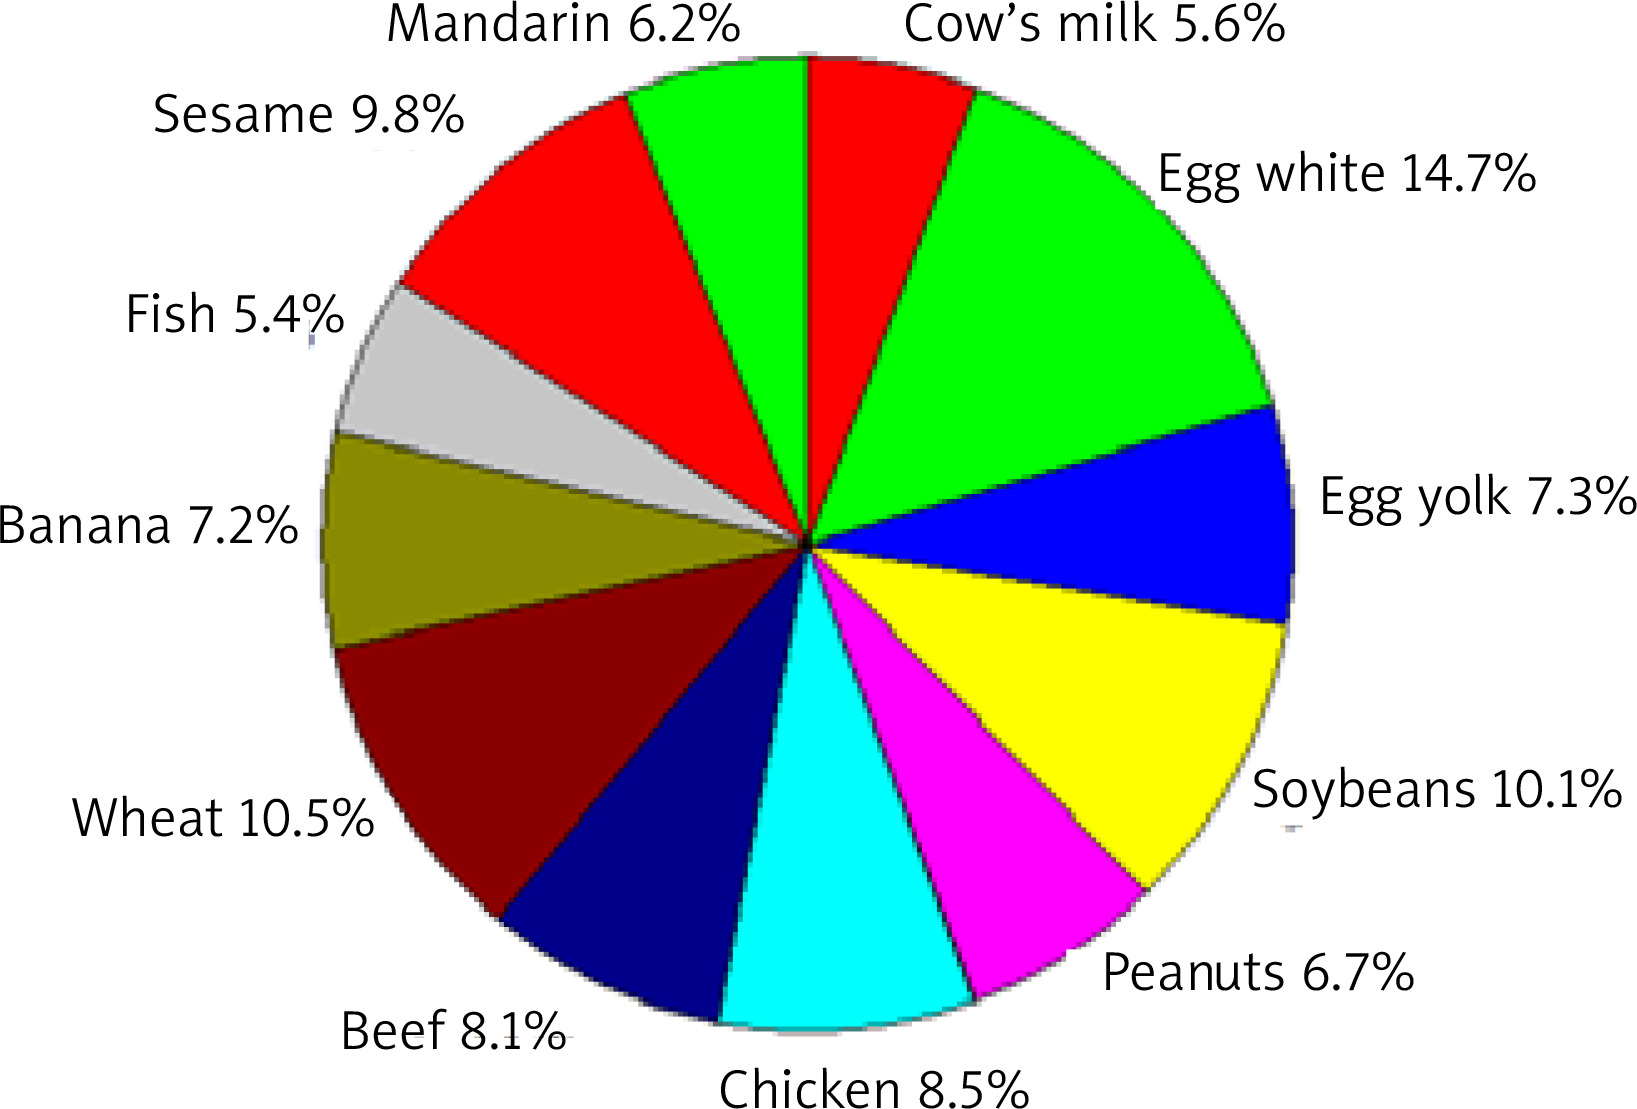
The highest percentage of sensitization was caused by chicken egg – 22.0% (egg white 14.7%, yolk 7.3%), wheat flour (10.5%), and soybean (10.1%). The percentage of those sensitized to beef (8.1%) was higher than that of those sensitized to cow’s milk proteins (5.6%).
The sensitization prevalence to at least one airborne allergen, depending on the age of the patients, is shown in Figure 4.
Figure 4
The sensitization prevalence to at least one aeroallergen (airborne allergen) in 1998–2012 depending on the age of the patients (Spearman’s rank correlation coefficient R = 0.67; p = 0.0024)
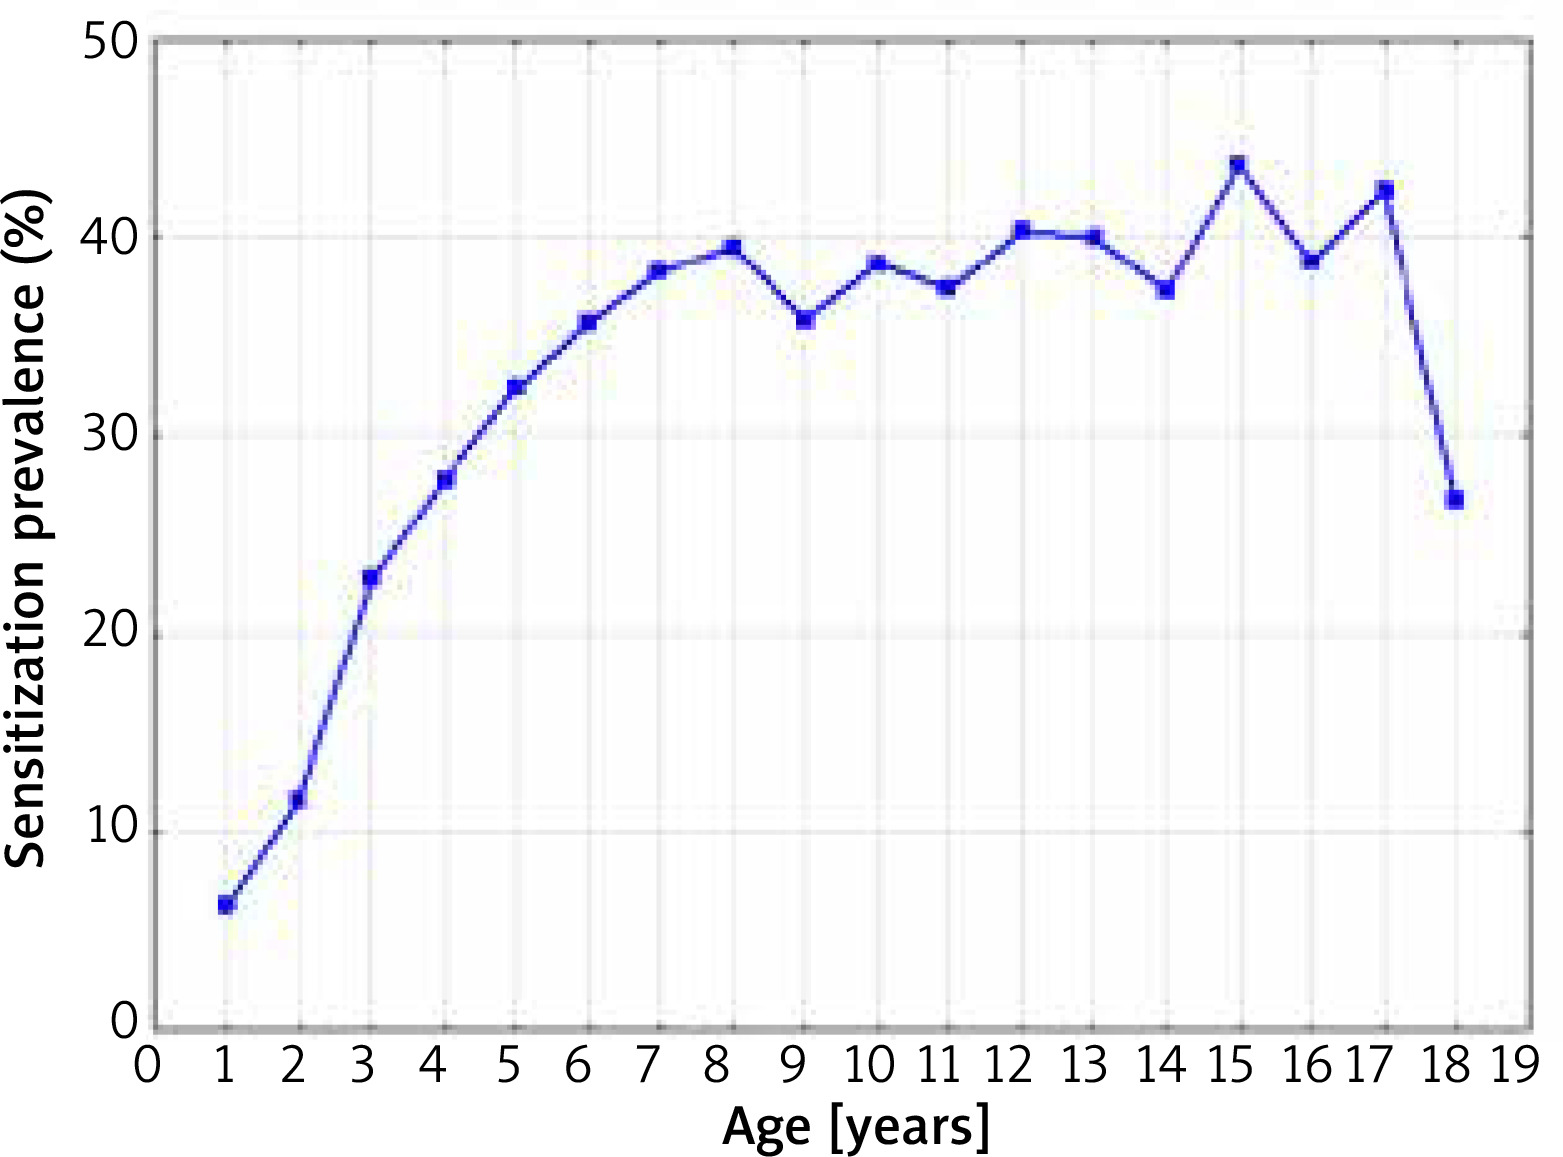
The percentage of sensitization to this type of allergens increased statistically significantly with the age of the patients (Spearman’s rank correlation coefficient R = 0.67; p = 0.0024). The lowest rate of sensitization to at least one airborne allergen was observed in infants (6.3%), and the highest in 15-year-old children (43.7%).
Figure 5 presents the contribution of airborne allergens to the positive results of SPT in the patients studied, regardless of their age, in the period of 14 years of the research.
Figure 5
The contribution of various allergens to positive SPT results to aeroallergens (airborne allergens) regardless of the age of patients
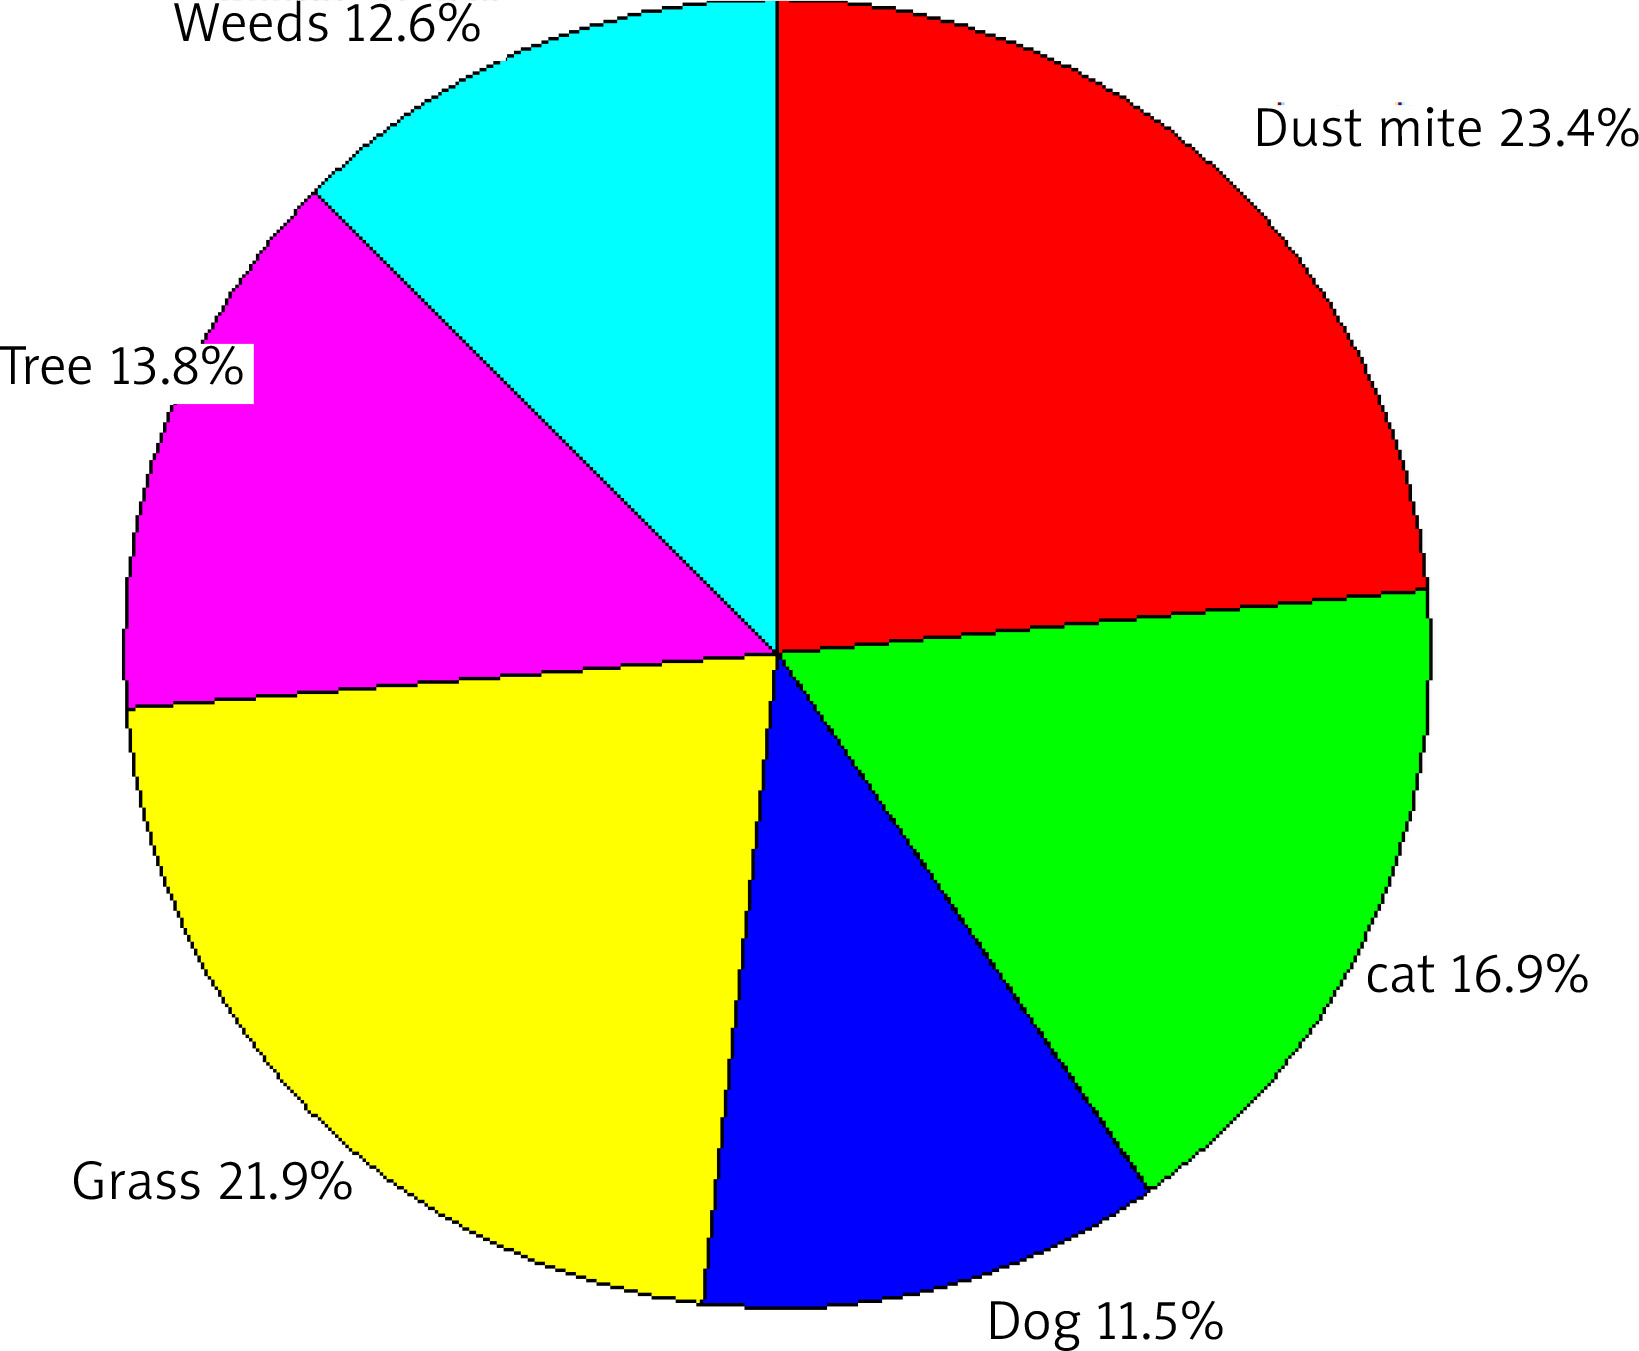
The most common source of sensitization was dust mite allergens (23.4%), followed by grass (21.9%), tree (13.8%) and weed (12.6%) allergens. Cat hair sensitization was observed in 16.9% of patients, and dog hair sensitization in 11.5%.
Figure 6 shows a graphical comparison of the simultaneous prevalence of sensitization to at least one food allergen and one airborne allergen, in 1998-2012 depending on the age of the patients.
Figure 6
The sensitization prevalence to at least one food allergen and aeroallergen (airborne allergens) in 1998–2012 depending on the age of the patients
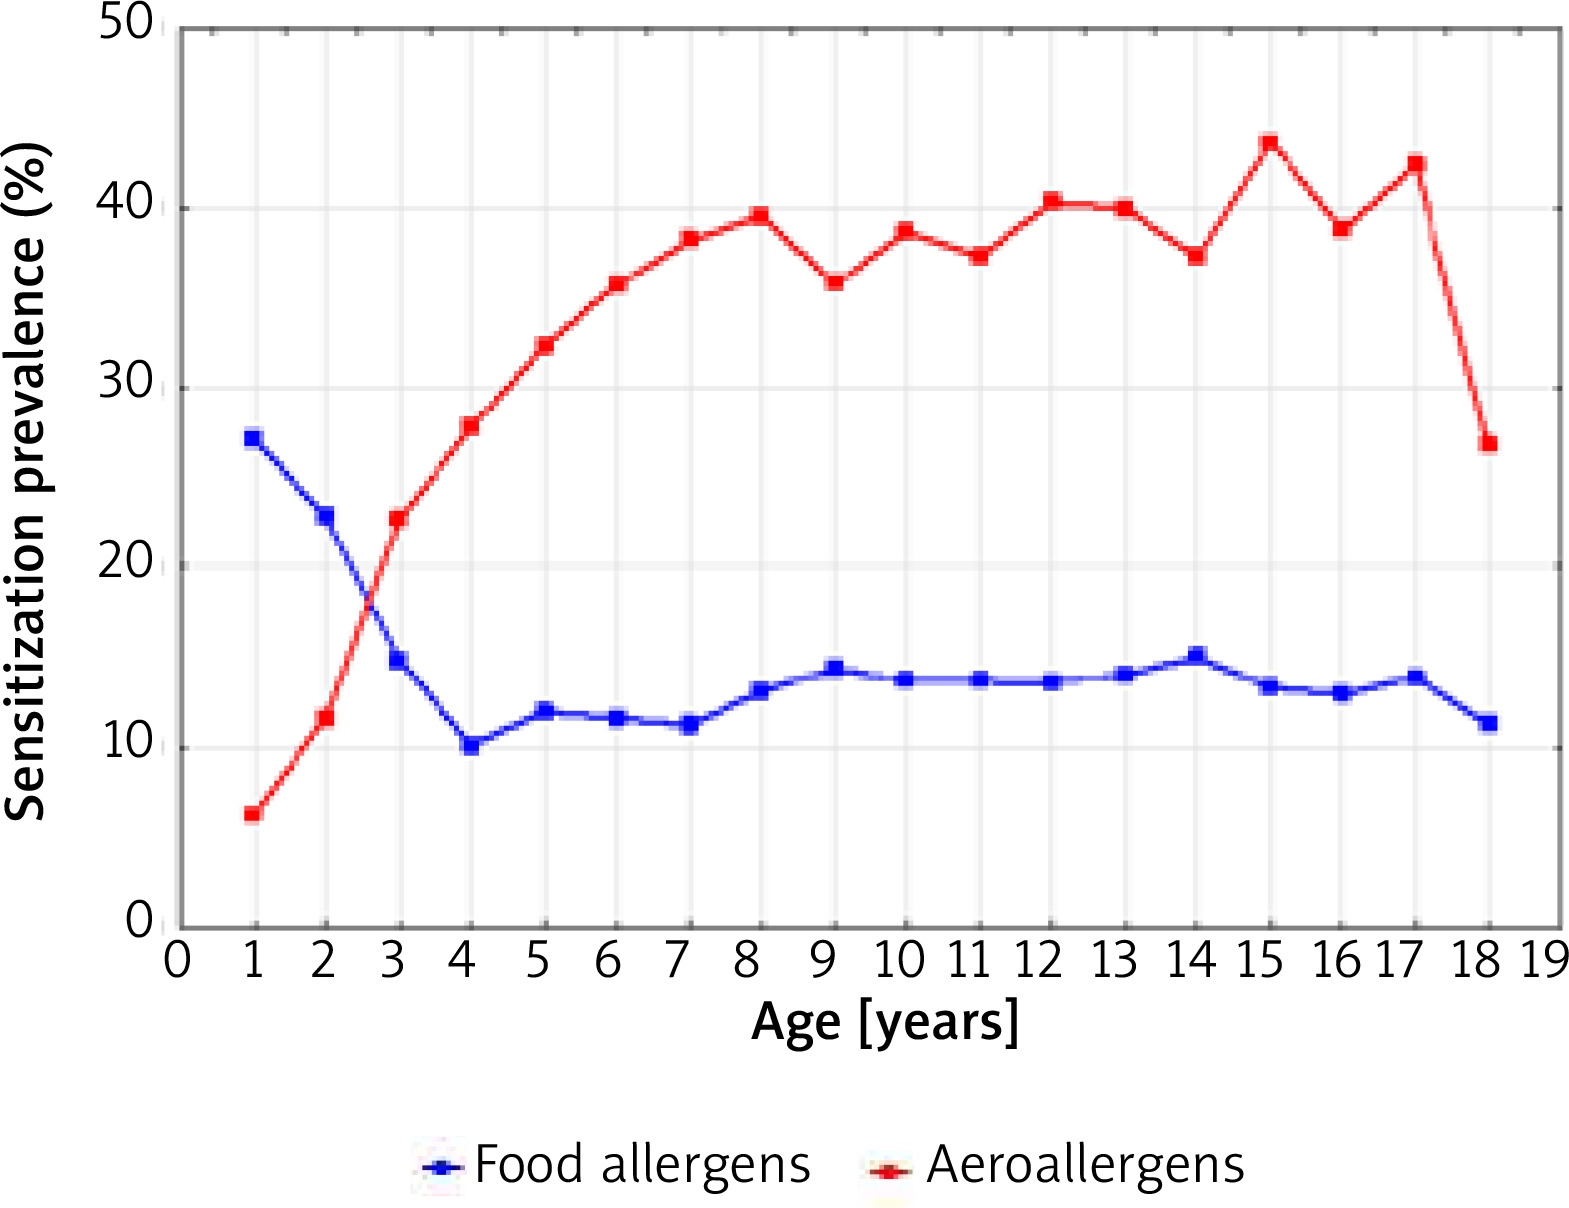
The intersection of the graph curves shows that at the age of 2.5 years the percentage of people sensitized to both food and inhalant allergens was the same (18.0%). The graphical comparison of the two curves also indicates that among children under 2.5 years of age, the percentage of those sensitized to one food allergen was higher than that of children sensitized to one airborne allergen. At the age above 2.5 years, the percentage of children sensitized to at least one airborne allergen systematically increased with age and was the highest at the age of 15–17 years (approximately 40.0%).
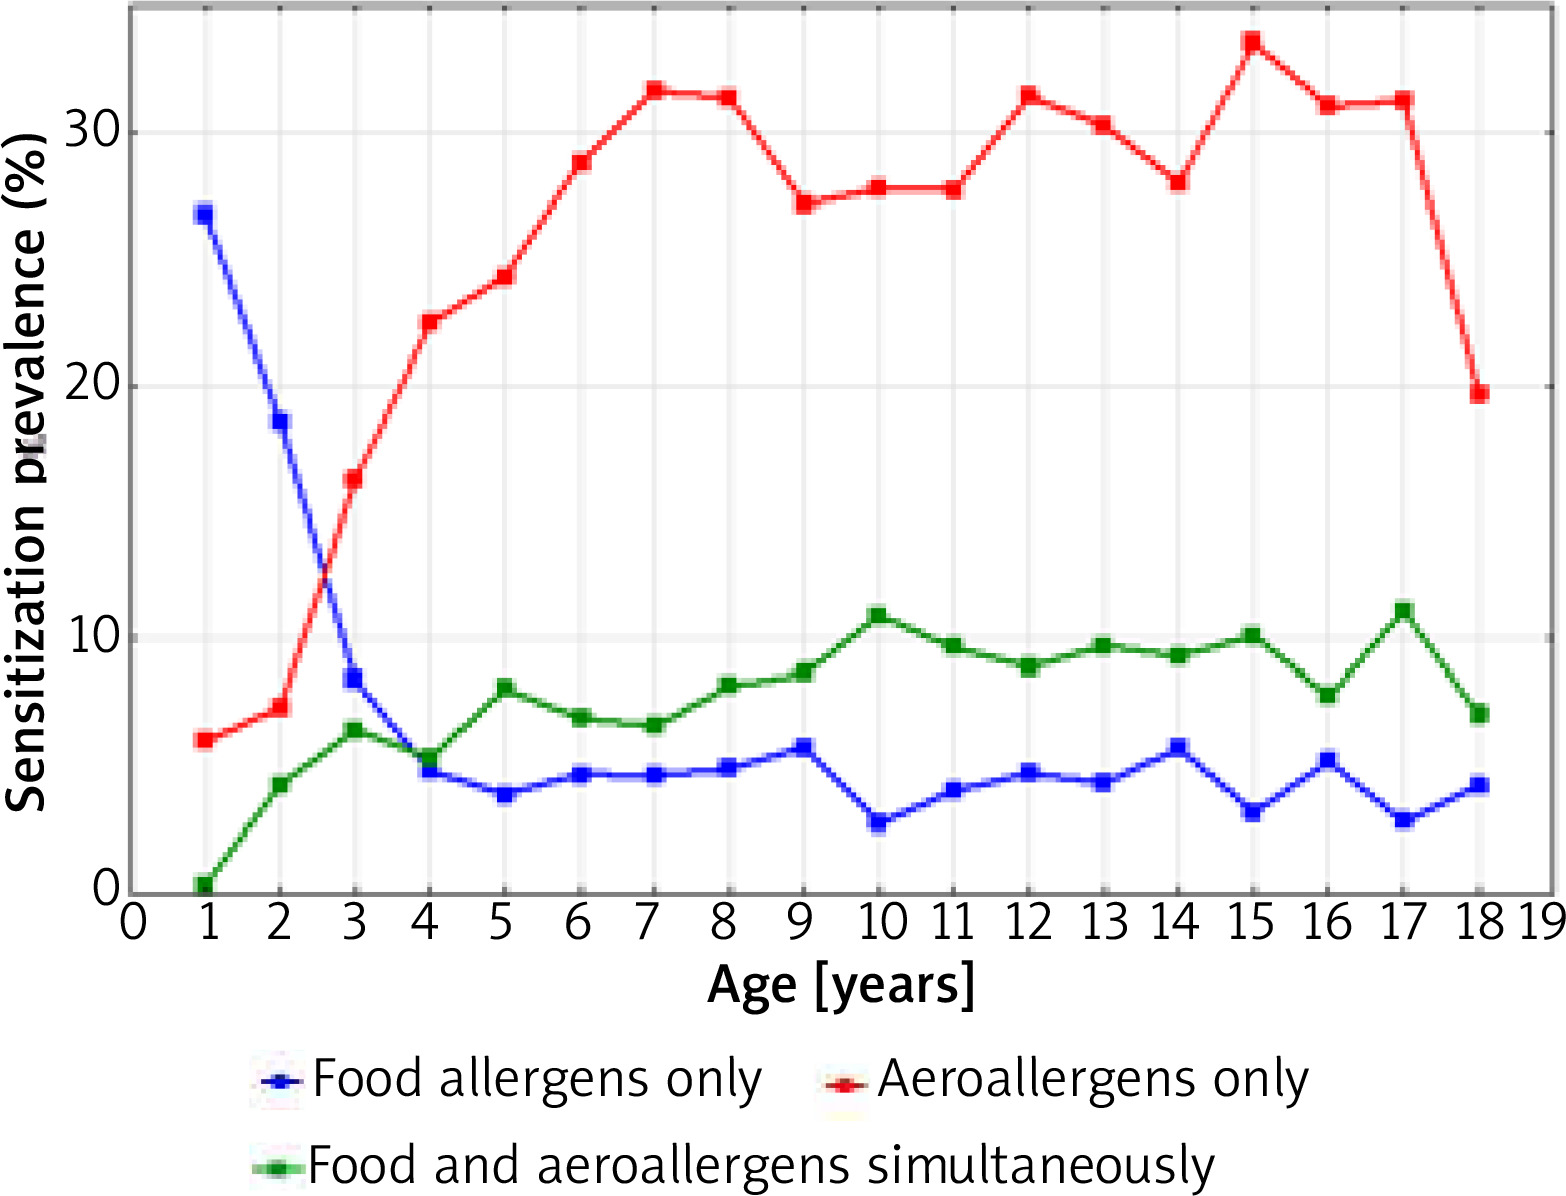
Figure 7 shows that after the age of 4, the percentage of children sensitized to both food and airborne allergens was always higher than the percentage of those who were sensitized only to food allergens (the intersection of the graph curves).
Discussion
In the evaluation of the sensitization process of the study group of children and adolescents, a universal research and diagnostic tool was used (Skin Prick Tests) [2, 6, 12]. The results obtained with this method constitute the basis for the interpretation and better understanding of the impact of environmental and genetic factors on the studied population. These factors shape both the nature and scale of the sensitization process or the development of atopic/allergic diseases in the studied population [2, 6, 16, 17]. Some aspects of the process of sensitizing in the chosen group of Polish children and adolescents, were presented in two previous publications [13, 14].
This publication presents a retrospective, comparative analysis of the process of atopic sensitization, observed in the period of 14 years, in the group of children and adolescents with suspected allergic disease. The evolution of this process in relation to the age of the examined patients was also analysed. There was a significant increase in the percentage of the sensitized patients, expressed as a positive SPT result for one allergen (without specifying the allergen type) over a period of 14 years. From the beginning (1998) to the end of the research (2012), the percentage of sensitized patients increased by 5.0% (35.3% vs. 40.4%). A similar phenomenon was also observed in the increasing frequency of the patients who were sensitized only to food allergens (5.1% to 13.1%) and those who were sensitized to one food allergen (10.5% to 20.1%). A similar upward trend in sensitization to food allergens was also observed in the results from 2003 and 2008 versus 1998.
Analysing the participation of airborne allergens in the sensitization process of children and adolescents, no such regular upward trend in sensitization was observed as in the case of food allergens. The exception was 2003, when the percentage of patients sensitized to one airborne allergen increased by 8.0% compared to 1998 (22.7% vs. 30.7%). Similarly, between 1998 and 2003, the percentage of children and adolescents sensitized to food and airborne allergens increased from 5.5% to 8.5%. In 2008 and 2012, the percentages of patients sensitized to one airborne allergen were 21.1% and 20.2%, respectively.
The increasing frequency of sensitization, mainly to food allergens, observed over a period of 14 years in the Polish children and adolescents, does not diverge from the upward trend in the frequency of sensitization and allergic diseases in various countries of the world. This phenomenon dates back to the second half of the 20th century, has continued to the present and mainly concerns IgE-dependent allergic diseases [18–23]. In the diagnosis of these diseases, the SPT method is used to determine or rule out atopic sensitization and/or the atopic basis of the allergic disease [6, 7, 9, 16, 17]. These diseases pose a challenge to public health and generate a significant economic burden in many countries of the world [20–24].
The increase in the percentage of food allergy in the examined Polish children and adolescents confirmed by the authors (5.1% to 13.1%) is consistent with the study results documenting the increase in the incidence of food allergy in other countries over a similar period of time [18, 20, 23, 25, 26]. The prevalence of food allergy among infants born between 2009 and 2012 in Great Britain and receiving standard introduction foods was estimated at around 7.1% to 7.3% [27]. In the group of children born in 2001–2002 on the Isle of Wight, the cumulative incidence of food hypersensitivity in the first decade of life was 6.8% [27, 28]. The trend towards an increase in the incidence of food allergy was also observed in Australia and Asia [18, 21, 23, 29–32].
Another aspect of our long-term observation was the assessment of the frequency of sensitization in the patients studied in 1998-2012, in relation to their age. It was found that the percentage of patients sensitized to at least one allergen increased with their age. Similarly, a systematic increase in the percentage of sensitization to at least one airborne allergen was observed.
Analysis of sensitizations, depending on the age of the examined patients, shows that the process of sensitization to food and airborne allergens was of a different nature. The highest percentage of patients sensitized to at least one food allergen concerned the youngest children (> 1-year-old 28.5%, 4-year-old 10.0%). In the > 4–18 years age group, the percentage of sensitized children and adolescents was in the constant range of 10.0–14.0%.
The lowest percentage of sensitization to at least one airborne allergen was observed in toddlers (6.3%), with an upward trend reaching the highest rate in 15-year-old children (43.7%).
Similar results were obtained in studies conducted in other countries.
The British research on the type and frequency of sensitization by environmental allergens in the youngest children (1, 2, 3 years), with the use of SPT, showed the increase of sensitization to food allergens (2.8%, 3.9%, 3.7%, respectively), and to inhalant allergens (1.3%, 6.4%, 10.7%) [12].
In a prospective German study on IgE-dependent sensitization to food and inhalant allergens, the percentage of patients sensitized to food allergens rated on 10.0% in the first year of life decreased to 3.0% at the age of 6; the frequency of patients sensitized to inhalant allergens increased from 1.5% to 8.0% [33].
The long-term Australian studies showed the highest percentage of patients sensitized to food allergens in infancy (26.3%), a decreasing trend in adolescence up to 8.4%, and the lowest percentage of sensitization to inhalant allergens in infancy (18.5%) increasing up to 63.6% at the age of 18 years [29].
An important scientific aspect of our study was to determine the percentage share of food and airborne allergens in the positive PTS results obtained in the group of patients from the north-eastern region of Poland.
In our study the greatest number of sensitization to food allergens was caused by chicken egg proteins (22.0% in total), wheat flour (10.5%), soybean (10.1%), beef (8.1%), and cow’s milk proteins (5.6%). In the Australian study, the main sensitizing food allergens were in infancy: egg white (19.2%), peanut allergens (14.7%), cow’s milk protein (8.7%); at the age of 18, peanut sensitization was the most common (6.7%) [29].
In the category of airborne allergies, in our study allergens of mites (23.4%) and grasses (21.8%) dominated. In Swedish studies sensitization to birch pollen, and timothy were predominant in children at the age of 4 and in adolescents [34].
In the ECAP cross-sectional study, the degree of sensitization to airborne allergens was assessed among the inhabitants of Polish towns and villages. In a comparable period of time, using the same research tool (SPT), results similar to our results were obtained: the percentage of children and adolescents at a similar age, sensitized to one inhalant allergen (39.0% vs. 45.8%), the most sensitizing allergen (D. pteronyssinus: 23. 4% vs. 23.4%), sensitization to grass allergens (21.8% vs. 21.3%) [35, 36].
The obtained results of our own research and the results of numerous studies from other research centres confirm that in early childhood sensitization to food allergens of animal origin (milk, eggs, fish) prevails, which should be related to the type of nutrition of this population. With the growing age of the sensitized population, the contribution of airborne allergens (of plant origin) in IgE-dependent sensitization increases, potentially leading to the development of various atopic diseases (allergic march) [16, 17].
A significant limitation in this publication is the lack of reference of the level and type of sensitization to the frequency and type of atopic/allergic diseases in the study group of patients. Such an analysis was not the aim of this study.
Conclusions
During the 14-year period of the study (1998–2012) the authors observed an upward trend in the frequency of sensitization to food allergens in the study population of Polish children and adolescents, diagnosed at the Department of Paediatrics, Gastroenterology and Allergology, the Medical University of Bialystok. The frequency of sensitization to airborne allergens was similar at the beginning and the completion of the study. The results of the study are similar to the results of studies carried out in other countries in the analysed period of time.


