
Introduction
Autoimmune hepatitis (AIH) is a chronic, progressive liver disease. It may lead to liver failure requiring transplantation if not treated properly. Its incidence ranges from 0.1 to 0.23 per 100,000 children [1, 2] and the treatment recommended by ESPGHAN Hepatology Committee consists of prednisolone (or prednisone) and azathioprine (AZA) [3]. The latter medication is also used to maintain remission.
Azathioprine is a pro-drug which is converted among others into 6-thioguanine (6-TG) and 6-methyl-mercaptopurine (6-MMP). It is recommended to measure these metabolites in order to avoid side effects of the treatment and to estimate drug activity. 6-TG levels refer to drug activity and myelosuppression, while 6-MMP levels correlate with hepatotoxicity [4].
Despite the widespread use of AZA in AIH therapy, the appropriate 6-TG levels that can be targeted in pediatric patients with AIH have not been established yet. To solve this problem, hepatologists apply recommendations for patients with inflammatory bowel disease, where 6-TG concentration in the range 250-450 pmol/8 × 108 red blood cell (RBC) is considered appropriate to maintain remission [4].
Motivated by those facts, our aim was to determine the relationship between the AZA active metabolite 6-TG and both the biochemical and histological remission outcomes.
Material and methods
Data collection
We carried out a retrospective review of 44 pediatric patients with AIH aged ≤ 18 who were diagnosed in our department between 2011 and 2018. The diagnosis was based on the clinical, biochemical, immunological and histological criteria. Other potential causes of liver disease such as Wilson disease, hepatitis B and hepatitis C were excluded during the investigation. Moreover, patients with primary sclerosing cholangitis, overlap syndrome, inflammatory bowel disease and celiac disease were excluded from the sample, too.
The following data were collected at the time of diagnosis: sex, age, comorbid diseases, weight, length, clinical symptoms, findings in physical examination and the result of liver biopsy (evaluated using the BatsLudwig score). On top of that, laboratory test performed upon the diagnosis included the measurement of total protein, albumin, total bilirubin, direct bilirubin, aspartate aminotransferase (AST), alanine aminotransferase (ALT), γ-glutamyl transferase (GGT), international normalized ratio (INR), white blood cell count (WBC), hemoglobin, hematocrit, platelet count, anti-nuclear antibody, anti-smooth muscle antibody, liver kidney microsomal type 1 antibody, antimitochondrial antibodies, anti-parietal cell antibodies, γ-globulin, and immunoglobulin G. In the course of treatment, patients regularly underwent clinical and biochemical follow-up evaluations during which data on weight, laboratory findings, medications, and biopsy result were collected.
We defined the biochemical remission as an ALT level below 40 U/l and histological remission was defined as a situation when the control biopsy revealed inflammation grade G1 (or lower) in the Bats-Ludwig score.
Statistical methods
Statistical inference was performed using the MannWhitney-Wilcoxon test, Kolmogorov-Smirnov test and Student’s t-test. Correlation was measured with the Pearson correlation coefficient. We assumed that p-values below 0.05 were statistically significant. We estimated the logistic regression that captured the relationship between the level of 6-TG and the probability of remission and we used it to generate the ROC curve to assess how informative the 6-TG levels were in assessing the chances of remission. Statistical analysis was performed using STATA and Octave.
Results
Sample characteristics
The number of pediatric patients included in the study was 44 (68.2% girls). The mean age at the time of diagnosis was 8.2 years (with the standard deviation of 3.3 years). In the sample, 63.6% of subjects had type 1 AIH and 15.9% had type 2 AIH. The most common symptoms of AIH during the examination were jaundice, hepatomegaly and splenomegaly. Liver biopsies performed at the time of presentation revealed median inflammation of grade 3 and fibrosis at grade 2 according to the Batts-Ludwig score.
The dosage of either prednisone or azathioprine was recorded for 37 patients. The treatment of 83.8% of them started with both prednisone and azathioprine, while 16.2% started only with prednisone. Mean doses of prednisone and AZA were 1.52 mg/kg/day and 1.69 mg/kg/day, respectively. Subsequently, the dose of prednisone was gradually decreased to a maintenance dose.
The total number of 6-TG observations collected during follow-up visits was 114. For a subsample of 45 observations it was possible to calculate the correlation between the dose of AZA and 6-TG concentration.
The concentration of 6-TG was uncorrelated with the dose of AZA (the correlation coefficient was equal to 0.01 and the p-value was 0.93). As we discussed, the poor correlation of these two variables was documented also in the related works by Bolia et al. [5] and Sheiko et al. [4].
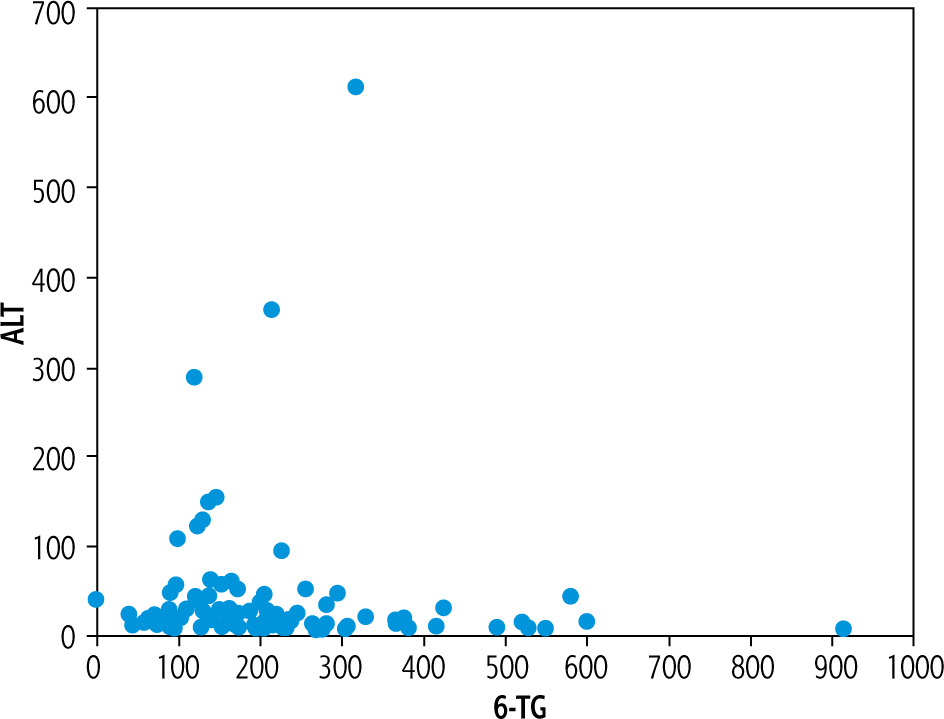
Sample characteristics (means and standard deviations of key variables characterizing patients in the analyzed group) are summarized in Table 1. To give an idea of what the main focus of this study looks like in our sample, Figure 1 plots the 6-TG concentration against the level of ALT.
Table 1
Patients’ characteristics (N = 44)
Biochemical remission
To guarantee the comparability between our results and those documented in the related works, we used several statistical methods to assess whether the level of 6-TG affects the chances for obtaining remission. Moreover, to check the robustness of our findings, we performed statistical inference for various definitions of 6-TG concentration. First, to stay in line with the literature we took the 6-TG level measured together with ALT during each follow-up visit (labeled as variant A). Second, to take into account the potential impact of past 6-TG levels on therapeutic outcomes we used the mean average of 6-TG levels recorded up to the time when the level of ALT was measured (variant B).
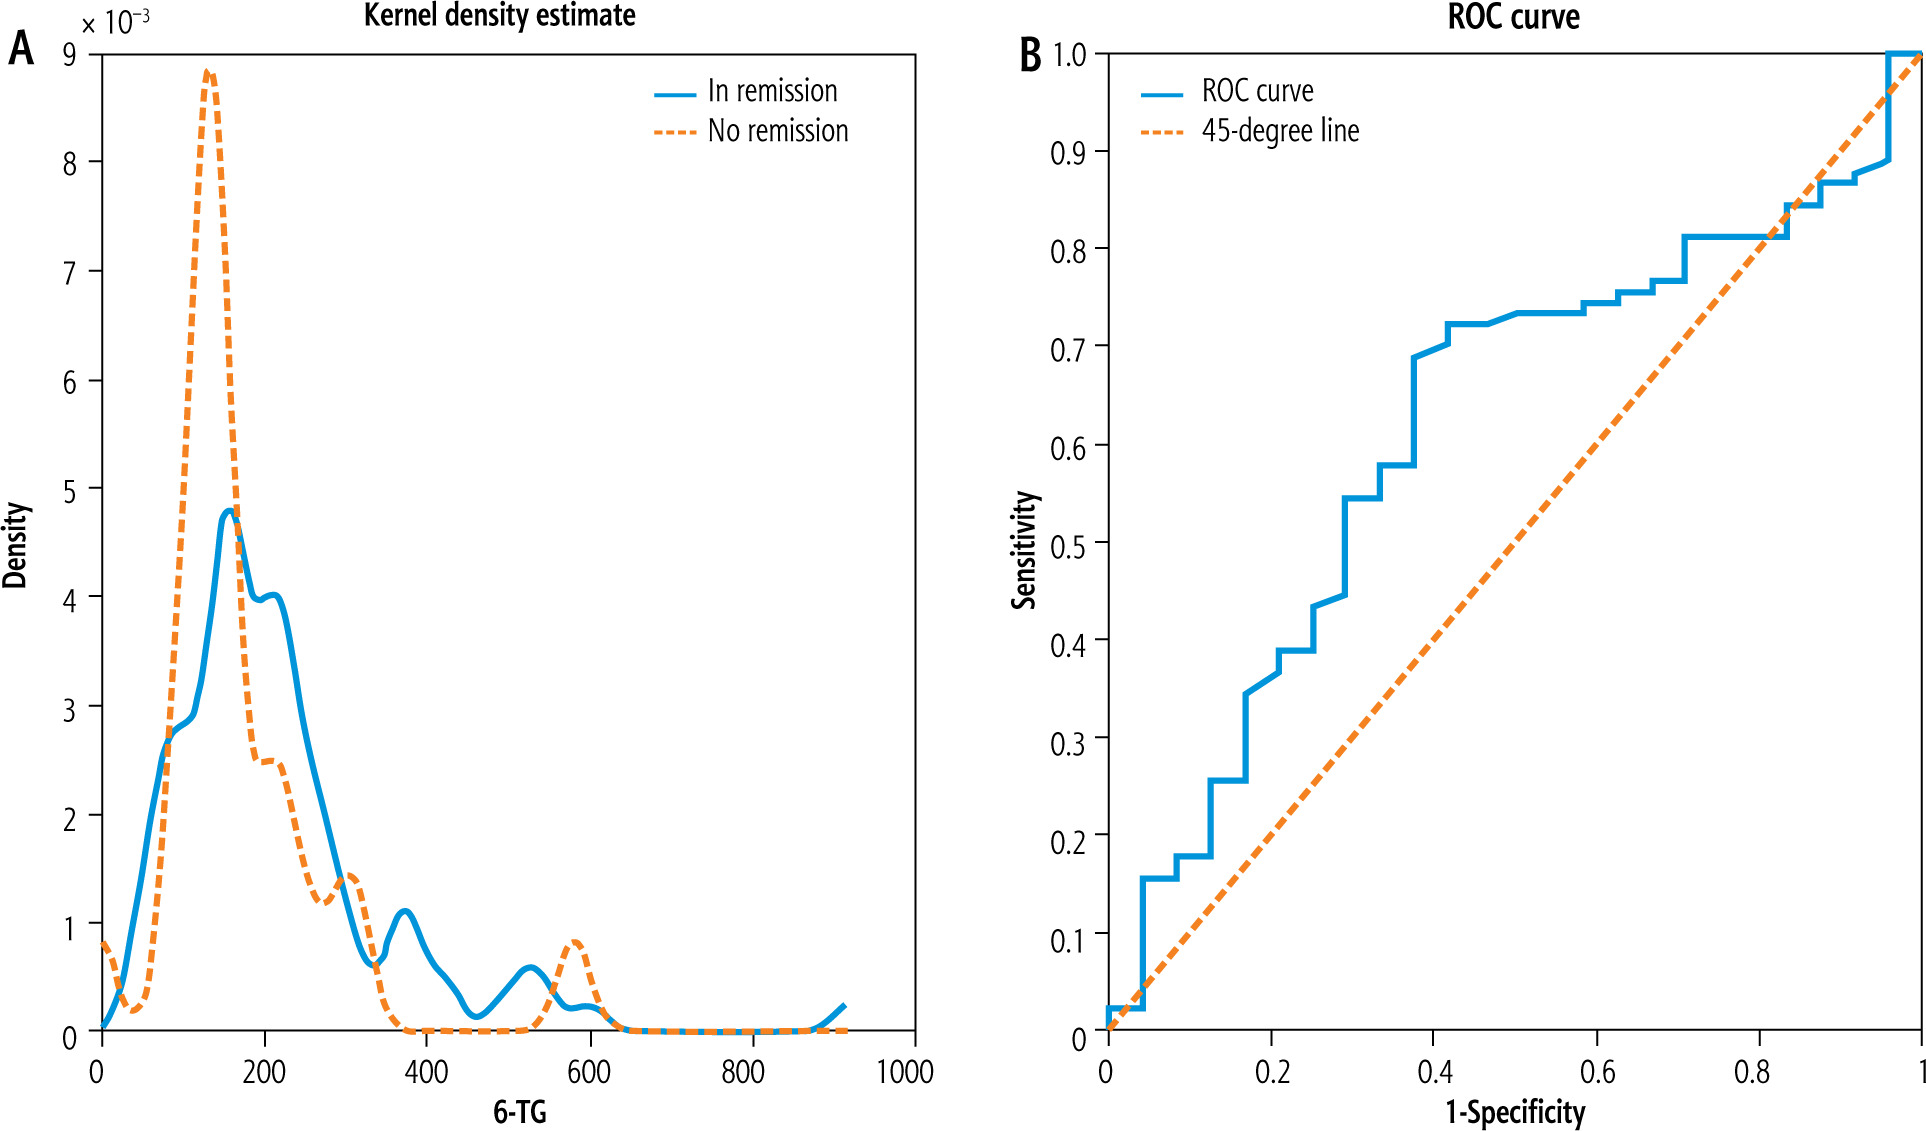
Variant A. The sample size in variant A was 114 (90 observations in remission and 24 without remission). The correlation of 6-TG and ALT was –0.04 but was not statistically significant (p-value of 0.68). The mean 6-TG was 174.9 pmol/8 × 108 RBC in the population with active disease and 218.6 pmol/8 × 108 RBC in the population with remission. Similarly to Sheiko et al. [4], we used the two-sample t-test to analyze the difference between those means and we found that the associated p-value was 0.16. As in Bolia et al. [5], we used the Mann-Whitney-Wilcoxon test to compare the distribution of 6-TG in populations in and with no remission. The associated p-value was 0.08 (with medians 192.5 and 139.5 for observations featuring remission and no remission, respectively). To check the robustness of those findings, we applied the Kolmogorov-Smirnov test to compare empirical cumulative distribution functions of 6-TG for observations with and without remission and the p-value was to 0.04. To illustrate the similarities between both distributions, we plot the estimated kernel densities of 6-TG in both subpopulations in the left panel of Figure 2. Furthermore, the right panel of Figure 2 plots the ROC curve associated with the logistic regression that estimates the dependency of the chances of remission on 6-TG concentration. We found that the AUC associated with the ROC curve was 0.62.
Variant B. The total number of observations in this case was 115 (with 91 classified as remission and 24 with no remission). We found no statistically significant correlation between the mean past 6-TG level and ALT (the correlation coefficient equal to –0.04 with the associated p-value at the level of 0.64). The p-value of the two sample t-test was 0.46 (with the mean past averages of 6-TG being 223.9 pmol/ 8 × 10⁸ RBC in the population with remission and 202.5 pmol/8 × 108 RBC in the population with no remission). The p-value of the Mann-Whitney-Wilcoxon test was 0.26 (where the median of past mean 6-TG concentrations for the observations with remission was 194.3 pmol/8 × 108 RBC and for the observations with no remission was 170.5 pmol/8 × 108 RBC) and the p-value associated with the Kolmogorov-Smirnov test was 0.26. Figure 3 displays the estimated kernel densities of empirical 6-TG distributions for patients with active disease and remission (left panel) and the ROC curve based on the logistic regression estimating the impact of the mean past 6-TG concentration on the chances of remission (with the AUC of 0.57) (Table 2).
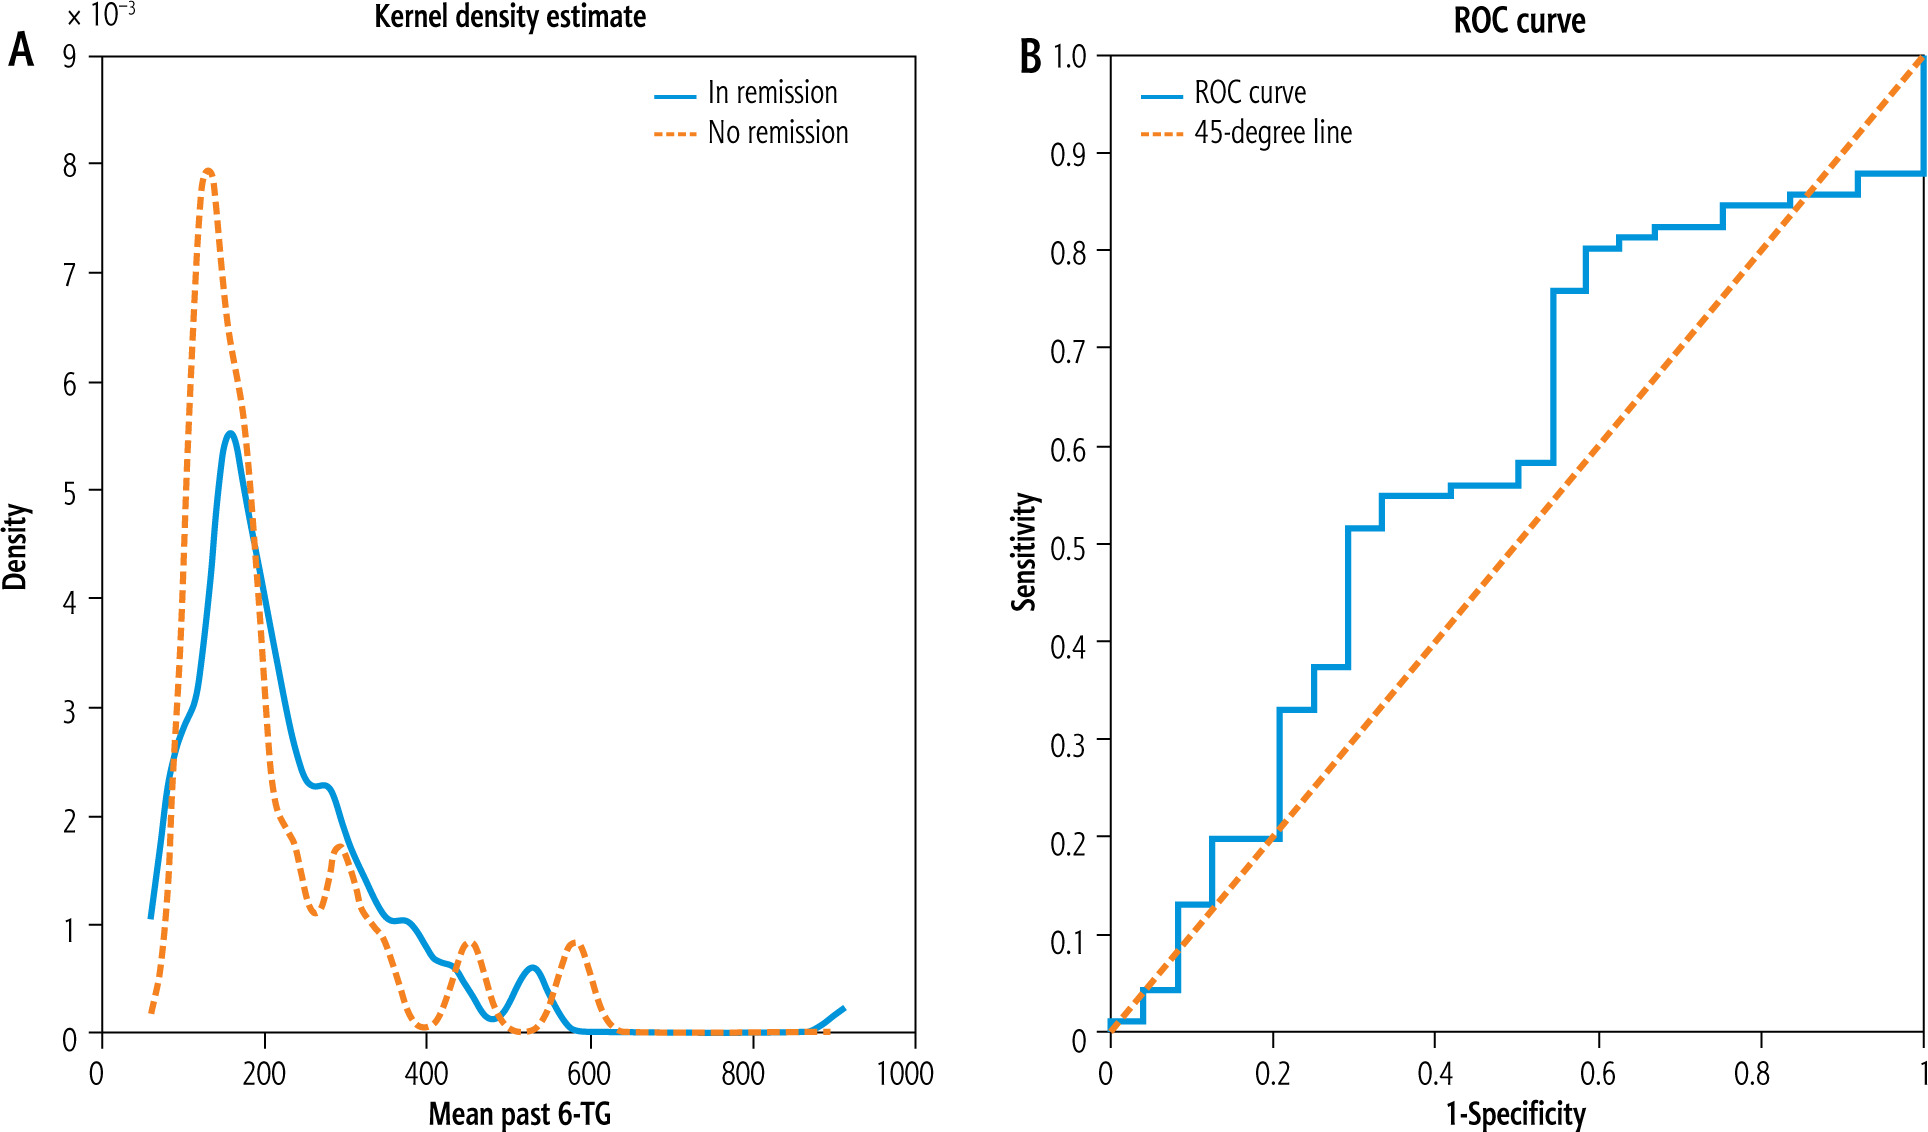
Table 2
Results of biochemical remission
Histologic remission
In our clinical practice we perform a liver biopsy approximately after two years of maintenance treatment. In this part we discuss the relationship between 6-TG concentration and the biopsy outcomes that, analogously to the presentation of results related to biochemical remission, are reported in two different variants, A and B, which correspond to various timing conventions of 6-TG measurement. The fact that biopsies are performed less frequently than the biochemical examinations severely limits the number of observations in the sample studied in this section. This also led us to constrain the set of statistical tools applied in this part to 3 tests: the t-test, the Mann-Whitney-Wilcoxon test and the KolmogorovSmirnov test.
Variant A. Number of patients: 22 (a subgroup of the sample of 44 children). The number of observations in this variant was 28. The p-value of the t-test was 0.34 (with the mean 6-TG level in the sample classified as patients in remission being 192.6 pmol/8 × 108 RBC and the value corresponding to those with active disease being 160.2 pmol/8 × 108 RBC). The p-value of the Mann-Whitney-Wilcoxon test was 0.35 (with the medians of 170.5 for patients in remission and 161.5 with no remission). Finally, the p-value of the Kolmogorov Smirnov test was 0.58.
Variant B. Number of patients: 28. The size of the sample was 34. The p-values of Student’s t, Mann-Whitney-Wilcoxon and Kolmogorov-Smirnov tests were 0.90, 0.80 and 0.99, respectively. The mean (median) past average 6-TG concentration in the subsample of patients in remission was 209.24 pmol/8 × 108 RBC (172.8 pmol/ 8 × 10⁸ RBC) and for those with an active disease it was 213.6 pmol/8 × 108 RBC (190 pmol/8 × 108 RBC) (Table 3).
Table 3
Results of histologic remission
Discussion
Autoimmune hepatitis is a liver disease which can lead to liver failure if not treated properly. Nowadays, the standard therapy consists of either prednisolone (or prednisone) or azathioprine, and there have been only a few studies trying to answer the question of what level of 6-TG is appropriate for pediatric patients diagnosed with AIH. This is an important issue because the role of azathioprine metabolites in children suffering from AIH has not been defined yet [5]. What is also important, therapeutic drug monitoring of AZA is an important tool in patients who fail to respond to standard thiopurine doses or when patient noncompliance or toxicity is suspected [6]. Additionally, because of the differences in the disease phenotype and the AZA metabolism between pediatric patients and adult ones, the treatment of the former should not necessarily follow the guidelines formulated for the latter. In what follows, we compare our results to those discussed in the literature to argue that there is no conclusive evidence on the effective 6-TG concentration that can be targeted in the course of AIH treatment in pediatric patients.
Our analysis of biochemical remission outcomes corroborates the consensus presented in the majority of studies, which is that the difference in 6-TG levels between patients in remission and those with active disease is not statistically significant. It is worth emphasizing that there is only one meta-analysis reporting that the mean 6-TG levels were significantly higher among patients in remission than in those who were not, with a pooled difference of 15.67 pmol/8 × 108 RBC [6]. However, the authors also note that of the seven studies included in their meta-analysis, only 1 study had previously demonstrated such a relationship [6]. Moreover, the definition of remission was not unified, and it was based on several different threshold levels of ALT below which patients were classified as being in remission.
In our study, the results of all statistical tests – except for the Kolmogorov-Smirnov test for variant A, which referred to biochemical remission – were not statistically significant. To establish this fact, not only did we use the values of 6-TG concentration measured together with ALT (i.e., during the same follow-up visit), as described in the literature, but also, to account for the potential persistence of treatment, we documented that patients in remission and with no remission did not differ concerning either of the mean 6-TG concentrations measured up to the visit when the ALT level was assessed. Second, apart from exploring the relationship between 6-TG concentration and the biochemical remission rates, we contribute to the existing research by analyzing the relationship between 6-TG levels and histologic remission in patients with AIH.
We found no statistically significant difference in 6-TG levels between patients in remission and those not in remission, which is similar to Bolia et al. [5] and Sheiko et al. [4]. In our study, the median level of 6-TG in patients in remission was 192.5 pmol/8 × 108 RBC, while the level corresponding to those not in remission was 139.5 pmol/8 × 108 RBC. The analogous values reported by Bolia et al. are 271 pmol/8 × 108 RBC for those in remission and 224 pmol/8 × 108 RBC for children not in remission [5].
We documented a statistically insignificant correlation between 6-TG and ALT levels (in particular, the correlation coefficient in our study was –0.04 compared to –0.18 reported by Bolia et al. [5]). Similarly to Bolia et al. [5], we did not find any specific level of 6-TG that could be routinely targeted during the AIH treatment: the value of AUC associated with the ROC curve is relatively low both in our study (0.62) and theirs (0.61), and so are the sensitivity and the specificity of resulting optimal cut-off values. We found that the correlation between the dose of AZA and the corresponding 6-TG concentration was poor and statistically insignificant. In particular, we found that the correlation coefficient equaled 0.01 with the corresponding p-value of 0.93.
We found that the average rate of biochemical remission measured with ALT was higher for patients with 6-TG higher than 250 pmol/8 × 108 RBC compared to those with levels below that threshold, which is similar to Sheiko et al. [4]. More specifically, the mean remission rate for the former group was 85%, and it was 77% in the latter. It might be the case that the remission rates reported here are lower than those reported by Sheiko et al. because our definition of remission is more restrictive (we set the remission threshold at 40 U/l of ALT while Sheiko et al. used the threshold value of 50 U/l). Analogously to Sheiko et al., the difference between remission rates in our analysis was not statistically significant (the p-values associated with the t-test and the Fisher exact test were 0.37 and 0.43, respectively).
Interestingly, the results of Nguyen et al. [7] differ substantially compared to our results. Nguyen et al. observed relatively high 6-TG concentrations across patients in their sample. In particular, the mean 6-TG level reported by Nguyen et al. was 478 pmol/8 × 108 RBC (with a median of 427 pmol/8 × 108 RBC and the corresponding range 51-1966 pmol/8 × 108 RBC) [7], whereas the analogous value in our sample is 209.3 pmol/8 × 108 RBC. Nevertheless, similarly to our study, the Mann-Whitney-Wilcoxon test showed no significant difference between 6-TG levels in children in remission and those with active disease [7]. Another important aspect with respect to which the results of Nguyen et al. differ from those reported here (and from those analyzed by Bolia et al. [5] and Sheiko et al. [4]) is the statistically significant correlation between AZA dose and 6-TG level (with the coefficient of 0.31 and p-value equal below 0.001) [7].
We are not aware of any literature reporting levels of 6-TG that can be targeted in the course of treatment of AIH for pediatric patients. There is, however, a paper by Dhaliwal et al. [8] which includes both pediatric and adult patients (with a median age of 51 years and a range of 3-78), which reports the optimal cut-off for 6-TG concentration of 220 pmol/8 × 108 RBC based on the ROC curve featuring the AUC of 0.68 and the associated sensitivity of 83% (specificity of 62%) [8]. Moreover, in contrast to papers discussing pediatric populations, Dhaliwal et al. [8] observed higher 6-TG concentrations in patients in remission compared to those not maintaining remission (with the median of 237 pmol/8 × 108 RBC for the former and 177 pmol/8 × 108 RBC for the latter and with the p-value of the associated Mann-Whitney-Wilcoxon test equal to 0.03) [8]. Contrary to the results of Bolia et al. [5], Sheiko et al. [4] and our study, they found a negative, statistically significant correlation between ALT and 6-TG concentration of –0.32 (with the associated p-value of 0.007) [6]. On top of that, similarly to our analysis, Dhaliwal et al. [8] concluded that the correlation between the dose of AZA and 6-TG was statistically insignificant [8].
In their meta-analysis, Bolia et al. [6] tried to answer why Dhaliwal et al. [8] reached a different conclusion concerning the 6-TG levels in patients in/without remission compared to other articles. They concluded that the study by Dhaliwal et al. [8] was prospective and included only patients at the maintenance stage of treatment. This contrasts with other studies that included non-selected cohorts of patients receiving thiopurine therapy [6].
In an interesting study, Bąk-Drabik et al. [9] evaluated the usefulness of measuring thiopurine metabolites in children with inflammatory bowel disease and autoimmune hepatitis treated with azathioprine. Bąk-Drabik et al. [9] found that patients with 6-TG concentrations ranging from 230 to 450 pmol/8 × 108 RBC exhibited higher remission rates than the under- or overdosed patients. At the same time, the authors also emphasized that an optimal therapeutic 6-TG level for AIH was not determined [9].
At the same time, we are aware of two main limitations of our retrospective analysis. First, the type II error might have occurred in our study (especially in the investigation of 6-TG levels and histologic remission rates) due to the small sample size. Second, the frequency of collecting data was not equal across patients, reflecting the differences between the practice patterns of doctors employed in our department.


