


Introduction
Atopic dermatitis (AD) is a chronic and relapsing inflammatory skin disease. Major clinical manifestations of AD include dry skin, intense itching and eczematous rash [1, 2]. The clinical course of AD generally starts from the childhood, and this disorder poses a serious impact on patients’ quality of life.
The etiological factors of AD are still not well understood, but accumulating evidence suggests that disturbance of the immune system serves as a critical contributing factor to onset and progression of this disorder, and an abnormal imbalance of Th1 and Th2 mediated immune responses has also been observed in patients with AD [3–5]. It is well established that cytokines play vital roles in regulating T cell mediated immune responses, and thus it is believed that gene polymorphisms of cytokines may somehow influence the risk of AD [6, 7].
Over the last decade, investigators all over the world have repeatedly attempted to estimate the relationships between cytokine polymorphisms and the risk of AD, yet the relationships between these gene polymorphisms and the risk of AD remain inconclusive. Considering that several previous meta-analyses have already covered Th2-related cytokines [8, 9], we decided to focus on polymorphisms of Th1-related cytokines, which include tumour necrosis factor-α (TNF-α), interleukin-1 (IL-1), interleukin-6 (IL-6) and interleukin-18 (IL-18) in this meta-analysis.
Aim
We aimed to evaluate associations between Th1-related cytokine polymorphisms and the risk of AD through a meta-analysis.
Material and methods
The authors strictly adhere to the PRISMA guidelines in study design and implementation [10].
Literature search and inclusion criteria
A thorough literature search in Medline, Embase, Wanfang, VIP and CNKI was performed by the authors with the following key words: (Tumour necrosis factor-αOR TNF-α OR Interleukin-1 OR IL-1 OR Interleukin-6 OR IL-6 OR Interleukin-18 OR IL-18) AND (polymorphism OR polymorphic OR variation OR variant OR mutant OR mutation OR SNP OR genotypic OR genotype OR allelic OR allele) AND (atopic dermatitis OR atopic eczema). Moreover, we also manually screened the reference lists of retrieved publications to make up for the potential incompleteness of electronic literature searching.
Selection criteria of eligible publications include the following four points: 1. Studies of case-control or cohort design; 2. Explore relationships between polymorphisms in TNF-α, IL-1, IL-6 or IL-18 and the risk of AD; 3. Give genotypic frequencies of TNF-α, IL-1, IL-6 or IL-18 polymorphisms in cases with AD and population-based controls; 4. The full manuscript with required genotypic frequencies of TNF-α, IL-1, IL-6 or IL-18 polymorphisms is retrievable or buyable. Articles would be excluded if one of the following three criteria is met: 1. Studies without complete data about genotypic frequencies of TNF-α, IL-1, IL-6 or IL-18 polymorphisms in cases with AD and population-based controls; 2. Narrative or systematic reviews, meta-analysis or comments; 3. Case series of subjects with AD. If duplicate publications are retrieved from literature search, we would only include the most complete one for quantitative analyses.
Data extraction and quality assessment
The authors extracted the following data items from eligible publications: 1. Last name of the leading author; 2. Publication year; 3. Country and ethnicity of study population; 4. The number of cases with AD and population-based controls; 5. Genotypic frequencies of TNF-α, IL-1, IL-6 or IL-18 polymorphisms in cases with AD and population-based controls. Hardy-Weinberg equilibrium was then tested by using genotypic frequencies of TNF-α, IL-1, IL-6 or IL-18 polymorphisms. The quality of eligible publications was assessed by the Newcastle-Ottawa scale (NOS) [11], and these with a score of 7–9 were considered to be publications of good quality. Two authors extracted data and assessed quality of eligible publications at the same time. A thorough discussion until a consensus is reached would be endorsed in case of any discrepancy between two authors.
Statistical analysis
All statistical analyses were performed with the Cochrane Review Manager software. Relationships between TNF-α, IL-1, IL-6 or IL-18 polymorphisms and the risk of AD were estimated by using odds ratio and its 95% confidence interval. The statistically significant p value was set at 0.05. The authors used I2 statistics to assess heterogeneities among eligible publications. The authors would use DerSimonian-Laird method, which is also known as the random effect model, to merge the results of eligible publications if I2 is larger than 50%. Otherwise, the authors would use Mantel-Haenszel method, which is also known as the fixed effect model, to merge the results of eligible publications. Meanwhile, subgroup analyses by ethnic groups were also performed by the authors. Stabilities of quantitative analysis results were tested by deleting one eligible publication each time, and then merging the results of the rest of eligible publications. Publication biases were evaluated by assessing symmetry of funnel plots.
Results
Characteristics of included studies
One hundred and ninety-three publications were retrieved by the authors by using our searching strategy. Forty publications were then selected to be screened for eligibility after omitting unrelated and repeated publications. Ten reviews and five case series were further excluded, and another four publications without all necessary genotypic data were further excluded by the authors. In total twenty-one publications met the selection criteria, and were finally selected for quantitative analyses (Figure 1). Data extracted from eligible publications were summarized in Table 1.
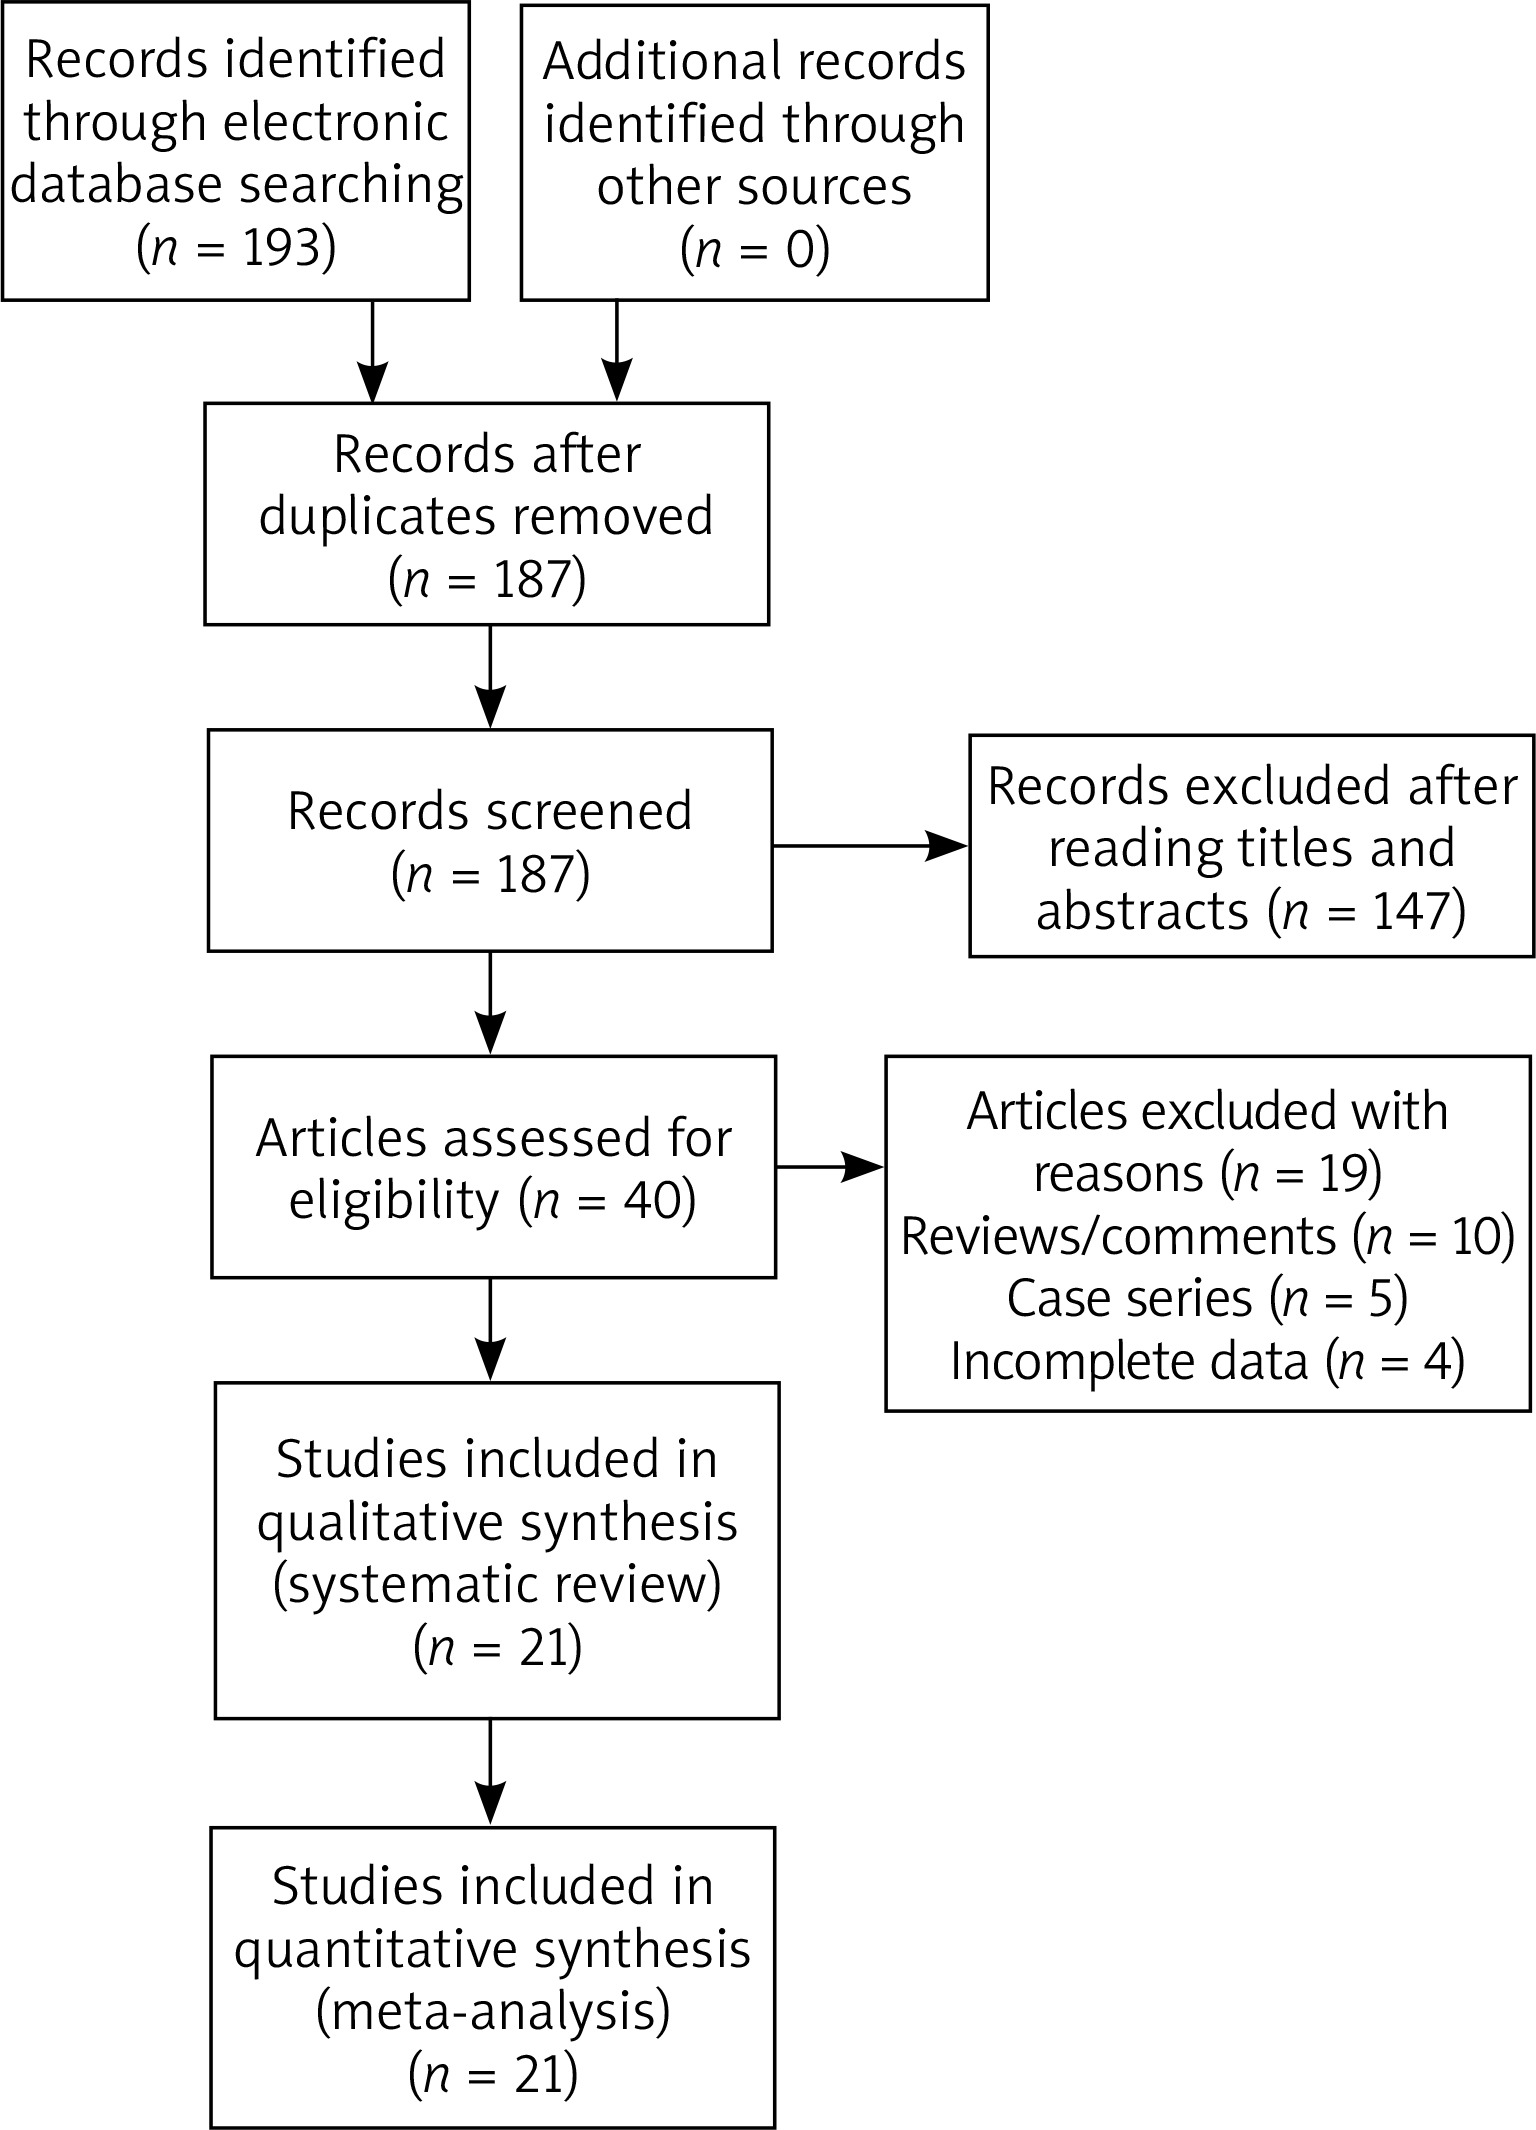
Table 1
The characteristics of included studies in the current meta-analysis
Quantitative analyses of TNF-α polymorphisms and AD
Seven publications explored the relationship between TNF-α -238 G/A polymorphism and the risk of AD, and twelve publications explored the relationship between TNF-α -308 G/A polymorphism and the risk of AD. The merged quantitative analyses did not reveal any positive results for TNF-α -238 G/A and -308 G/A polymorphisms (Table 2).
Table 2
Merged quantitative analysis results of the current study
Quantitative analyses of IL-1 polymorphisms and AD
Four publications explored the relationship between IL-1A -889 C/T polymorphism and the risk of AD, five publications explored the relationship between IL-1B +3954 C/T polymorphism and the risk of AD, and four publications explored the relationship between IL-1B −511 C/T polymorphism and the risk of AD. The merged quantitative analyses revealed that IL-1B +3954 C/T polymorphism was significantly associated with the risk of AD in overall population (recessive comparison: OR = 0.61, p = 0.02) and Caucasians (recessive comparison: OR = 0.59, p = 0.02). Nevertheless, we did not observe any positive results for IL-1A -889 C/T and IL-1B −511 C/T polymorphisms (Table 2).
Quantitative analyses of IL-6 polymorphisms and AD
Five publications explored the relationship between IL6 -174 G/C polymorphism and the risk of AD. The merged quantitative analyses did not reveal any positive results for the IL6 -174 G/C polymorphism (Table 2).
Quantitative analyses of IL-18 polymorphisms and AD
Six publications explored the relationship between IL-18 -137G/C polymorphism and the risk of AD. The merged quantitative analyses revealed that IL-18 -137G/C polymorphism was significantly associated with the risk of AD in overall population (dominant comparison: OR = 2.06, p = 0.007; recessive comparison: OR = 0.24, p < 0.001; over-dominant comparison: OR = 0.74, p = 0.05; allele comparison: OR = 2.04, p = 0.003), Caucasians (allele comparison: OR = 1.45, p = 0.05) and Asians (dominant comparison: OR = 3.75, p < 0.001; recessive comparison: OR = 0.18, p < 0.001; over-dominant comparison: OR = 0.64, p = 0.04; allele comparison: OR = 3.41, p < 0.001) (Table 2).
Sensitivity analysis
The authors examined stabilities of quantitative analysis results by deleting one eligible publication each time, and then merging the results of the rest of publications. The trends of associations were not significantly altered in sensitivity analyses, which indicated that from a statistical perspective, our quantitative analysis results were reliable and stable.
Discussion
This meta-analysis robustly estimated associations between TNF-α, IL-1, IL-6 or IL-18 polymorphisms and the risk of AD. The quantitative analysis results showed that IL-1B +3954 C/T and IL-18 -137G/C polymorphisms were significantly associated with the risk of AD. Nevertheless, we did not observe any positive associations for TNF-α-238 G/A, TNF-α -308 G/A, IL-1A -889 C/T, IL-1B −511 C/T and IL6 -174 G/C polymorphisms.
A few points should be considered when interpreting our findings. First, based on findings of previous observational studies, it is believed that investigated TNF-α, IL-1, IL-6 and IL-18 polymorphisms may alter mRNA expression level or protein function of TNF-α, IL-1, IL-6 and IL-18, generate an imbalance status between Th1 and Th2-related immune responses, and then influence the risk of AD [12, 13]. Nevertheless, the functionalities of investigated polymorphisms are still not well understood, and thus further studies are still needed to explore the exact underlying molecular mechanisms of the observed positive results for IL-1B +3954 C/T and IL-18 -137G/C polymorphisms. Second, we wish to study all polymorphic loci of TNF-α, IL-1, IL-6 and IL-18. Nevertheless, our literature search did not reveal sufficient eligible publications to support quantitative analyses for other polymorphic loci of these cytokines, so we only explored associations with the risk of AD for several most common TNF-α, IL-1, IL-6 and IL-18 polymorphisms. Additionally, it is also worth noting that polymorphisms in other Th1-related cytokines such as IL-8 and IL-12 could not be investigated in a meta-analysis because only a few previous publications tried to elucidate the roles of these polymorphisms in AD, and therefore, we could not find sufficient relevant publications to warrant quantitative analyses. Third, considering that only a few studies were found to be eligible for quantitative analyses, it is also possible that the sample sizes of our quantitative analyses were still inadequate to reveal the real associations of TNF-α, IL-1, IL-6 and IL-18 polymorphisms with the risk of AD. So future studies with larger sample sizes still need to confirm our findings.
The major limitations of this meta-analysis were summarized as below. Firstly, our quantitative analysis results were only based on unadjusted integrating of previous publications. Without access to raw data of eligible publications, we can only estimate associations based on re-calculations of raw genotypic frequencies, but we have to admit that lack of further adjustment for baseline characteristics may certainly influence authenticity of our findings [14]. Secondly, environmental factors may also affect relationships between TNF-α, IL-1, IL-6 or IL-18 polymorphisms and the risk of AD. However, the majority of authors only focused on genetic associations in their publications, so it is impossible for us to explore genetic-environmental interactions in a meta-analysis of these previous publications [15]. Thirdly, we did not include grey literatures for quantitative analyses because these literatures are always incomplete and it is impossible for us to extract all required data from these literatures or assess their quality. Nevertheless, since we did not consider grey literatures for quantitative analyses, despite the fact that funnel plots were found to be overall symmetrical, we acknowledged that publication biases still may impact reliability of our merged results [16].
Conclusions
This meta-analysis demonstrates that IL-1B +3954 C/T and IL-18 -137G/C polymorphisms may affect the risk of AD. However, further studies with larger sample sizes are still needed to confirm our findings. Besides, scholars should also try to explore underlying molecular mechanisms of associations between above-mentioned polymorphisms and the risk of AD in the future.